0732
Persistent anosmia following COVID-19 results in significant connectivity differences within olfactory regions: a resting state fMRI analysis1Centre for Obesity Research, University College London, London, United Kingdom, 2Biomedical Research Centre at UCLH and UCL, National Institute for Health Research, London, United Kingdom, 3NMR Research Unit, Queen Square MS Centre, Department of Neuroinflammation, UCL Queen Square Institute of Neurology, University College London, London, United Kingdom, 4Centre for Medical Image Computing, Department of Medical Physics and Biomedical Engineering, University College London, London, United Kingdom, 5Department of Electrical, Computer and Biomedical Engineering, University of Pavia, Pavia, Italy, 6IRCCS C., Mondino Foundation, Pavia, Italy, 7Brain Connectivity Centre, IRCCS Mondino Foundation, Pavia, Italy, 8Department of Brain and Behavioural Sciences, University of Pavia, Pavia, Italy
Synopsis
Anosmia or loss of smell is a common COVID-19 symptom. We studied a group of individuals with persistent anosmia and those who had recovered olfactory function following COVID-19 infection as well as healthy volunteers. Using resting state EPI and seed based analysis we found significant differences in connectivity between olfactory nodes and prefrontal regions known to be involved in smell processing. Furthermore, our analysis also identified connectivity differences between olfactory regions and brain areas involved in appetite control, highlighting areas of the brain that may be affected by COVID-19 related anosmia.
Introduction
A common symptom of COVID-19 is anosmia, loss of the sense of smell. Structural neuroimaging research looking at COVID-associated anosmia shows olfactory bulb atrophy as well as GM changes in the orbitofrontal and insula cortex.1,2,3 For some, smell recovers, whereas for others anosmia persists alongside other manifestations of long-COVID.4 This study aims to assess olfactory node connectivity in patients still suffering from anosmia against those with recovered olfactory function following COVID.Methods
Forty six subjects were included in this study and stratified into three groups based on COVID antibody (Ig) presence and anosmia state, as determined using the University of Pennsylvania Smell Identification Test.5 Groups were defined as Ig negative (Ig-ve, n=18, 9F, age (SD)=38.7(11.4)), Ig positive with persistent anosmia (Ig+P, n=8, 7F, age=53.1(12.2)) and Ig positive who previously had anosmia but recovered normal olfactory function (Ig+R, n=20, 17F, age=39.3(13.4)). Recruitment occurred during the UK’s first wave and therefore impact of multiple COVID infections, additional virus variants and vaccinations was avoided.Resting-state T2* weighted images were acquired using a 3T Philips Ingenia CX (Philips Healthcare, Best, The Netherlands) system. Data was acquired using an echo planar imaging (EPI) sequence with the following parameters: TR=4000ms, TE=25ms, voxel size=3mm isotropic, Nslices=43, acq time=6m40s with 100 timepoints. A 1mm isotropic T1 weighted volume was also acquired for spatial normalisation and registration purposes.
Timeseries data were processed by following the ENIGMA rs-fMRI pipeline6 using a combination of AFNI and NiftyReg7 software. In brief, EPI data were denoised using a Marchenko-Pastur principal component analysis (MP-PCA) method to identify and subsequently remove principal components which originate due to thermal noise, followed by timeseries despiking. Slice timing and motion correction was performed and data normalised to MNI space. WM and CSF signal was extracted and regressed along with the saved motion regressors before smoothing with a 6mm3 FWHM Gaussian kernel.
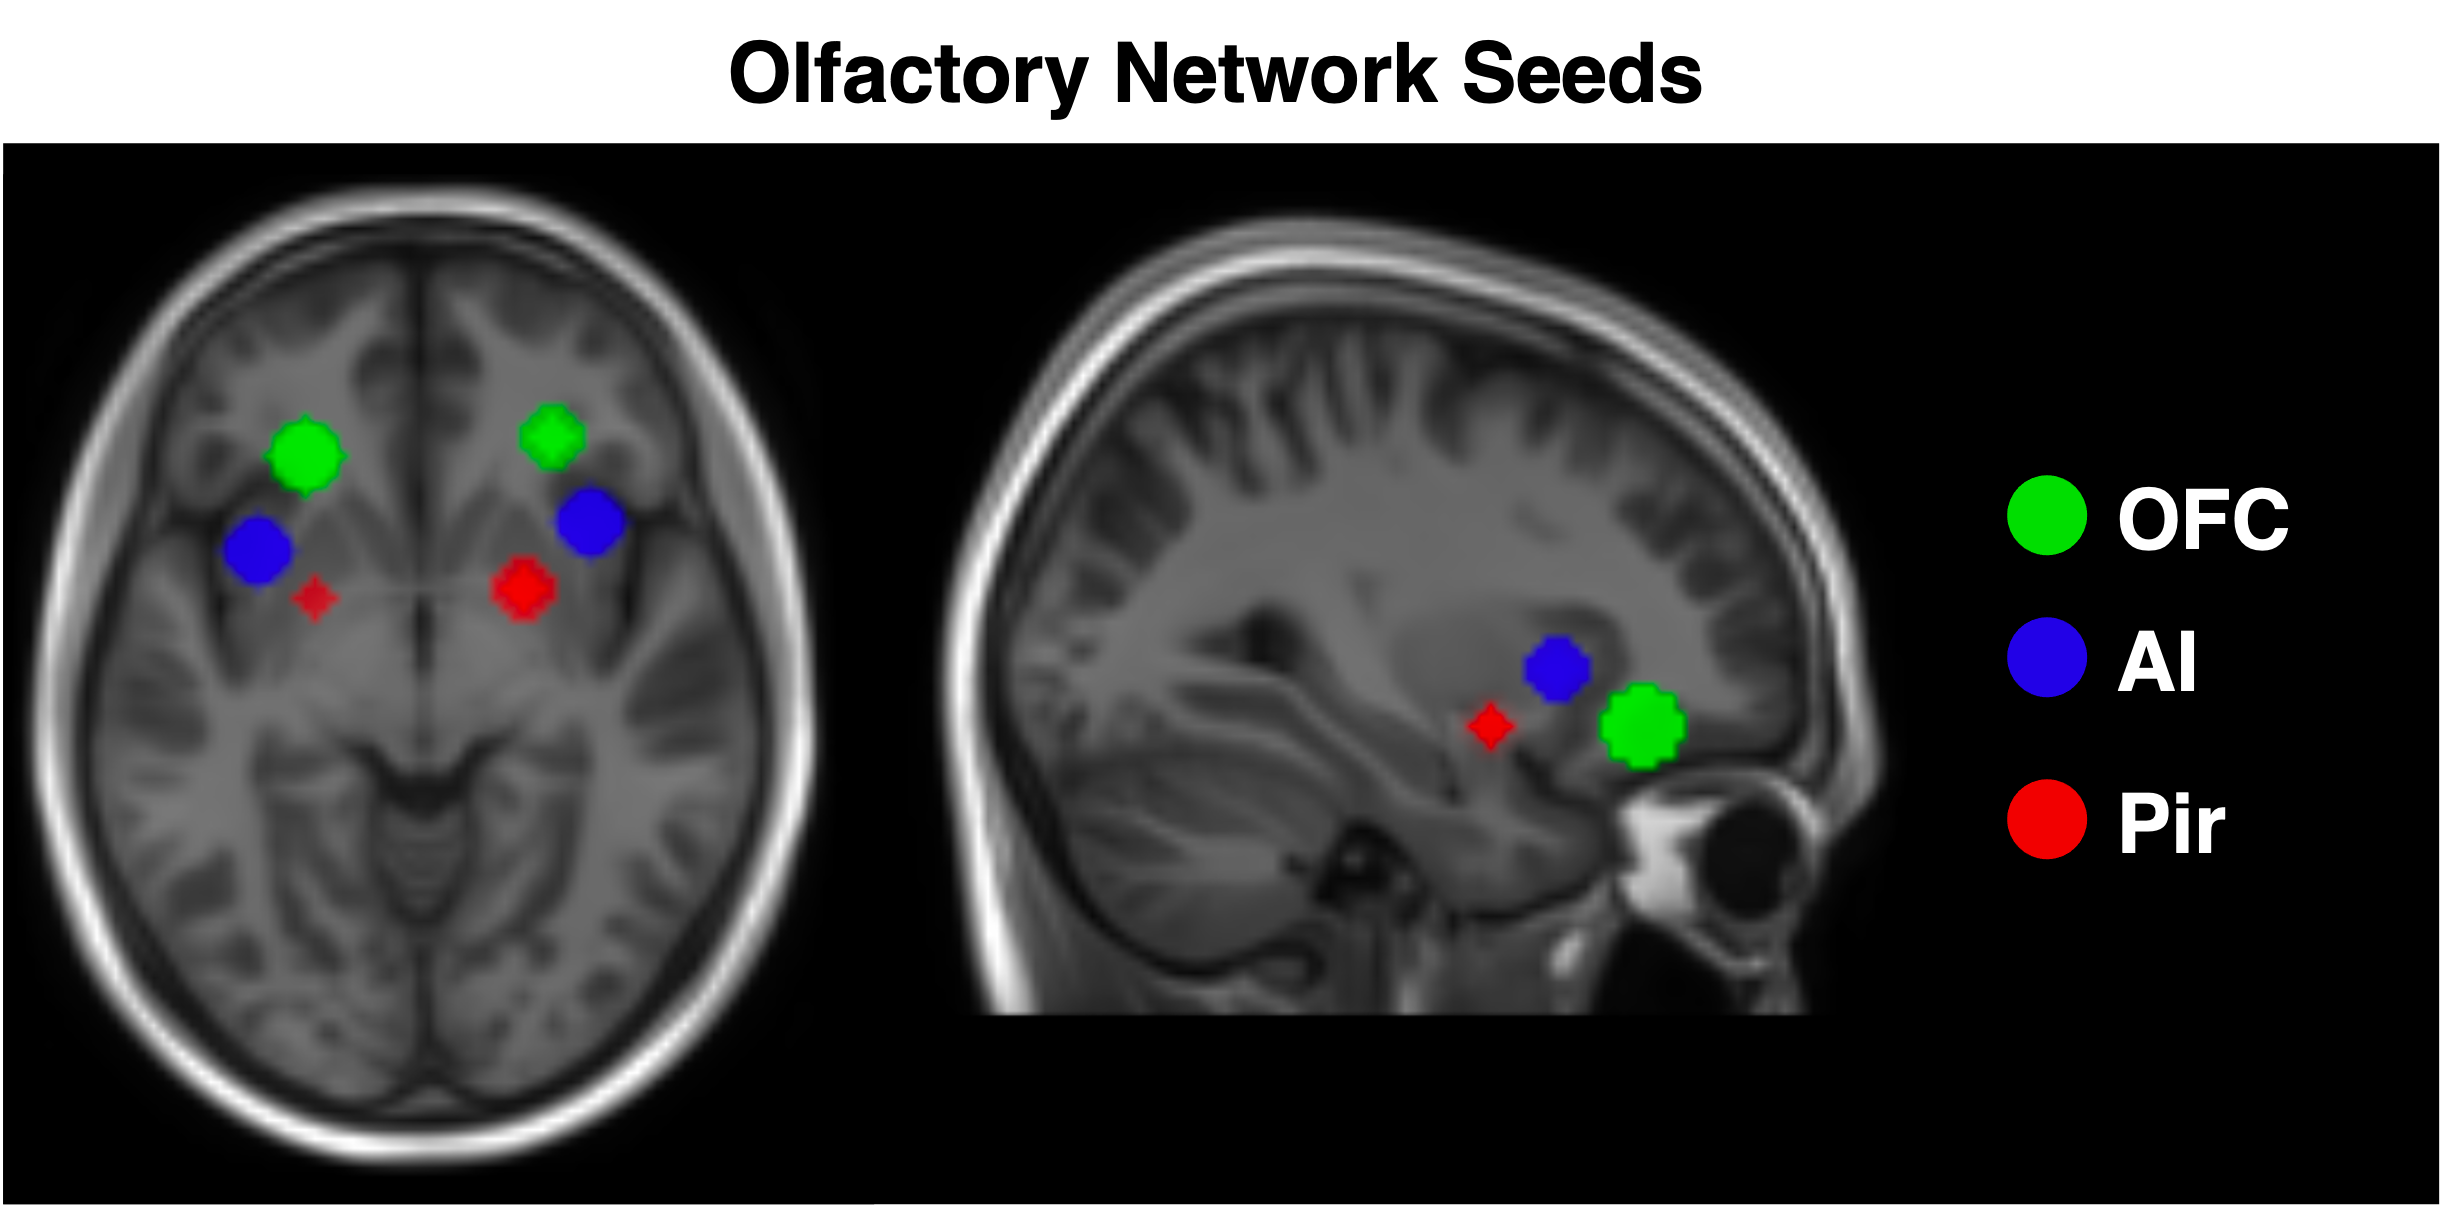
To guide our analysis, we referred to Peter et al8 who previously investigated resting state olfactory networks comprising 6 anatomical nodes; bilateral orbitofrontal cortex (OFC), anterior insula (AI) and piriform cortex. Seeds for these regions were created using the co-ordinates published in Tobia et al9 (Fig 1). Seed time courses were extracted and regressed against processed EPI data. These correlation maps were Fisher-z transformed to produce connectivity maps for each subject and for each individual seed.
Group connectivity differences were assessed through a second level mass univariate analysis using statistical parametric mapping software (SPM). For each seed a one-way ANOVA with age and sex as covariates was constructed, and all main group contrasts were tested. Parametric contrast t-maps were created with a cluster forming threshold of p<0.001. Significant clusters were assessed at p<0.05 family wise error threshold.
For interpretation significant clusters were used as masks to extract values from seed and subject specific Z-maps and plotted alongside parametric maps. In addition, the Yale BioImage Suite Medical Image Analysis Software (https://bioimagesuiteweb.github.io/webapp/mni2tal.html) was used for anatomical referencing.
Results
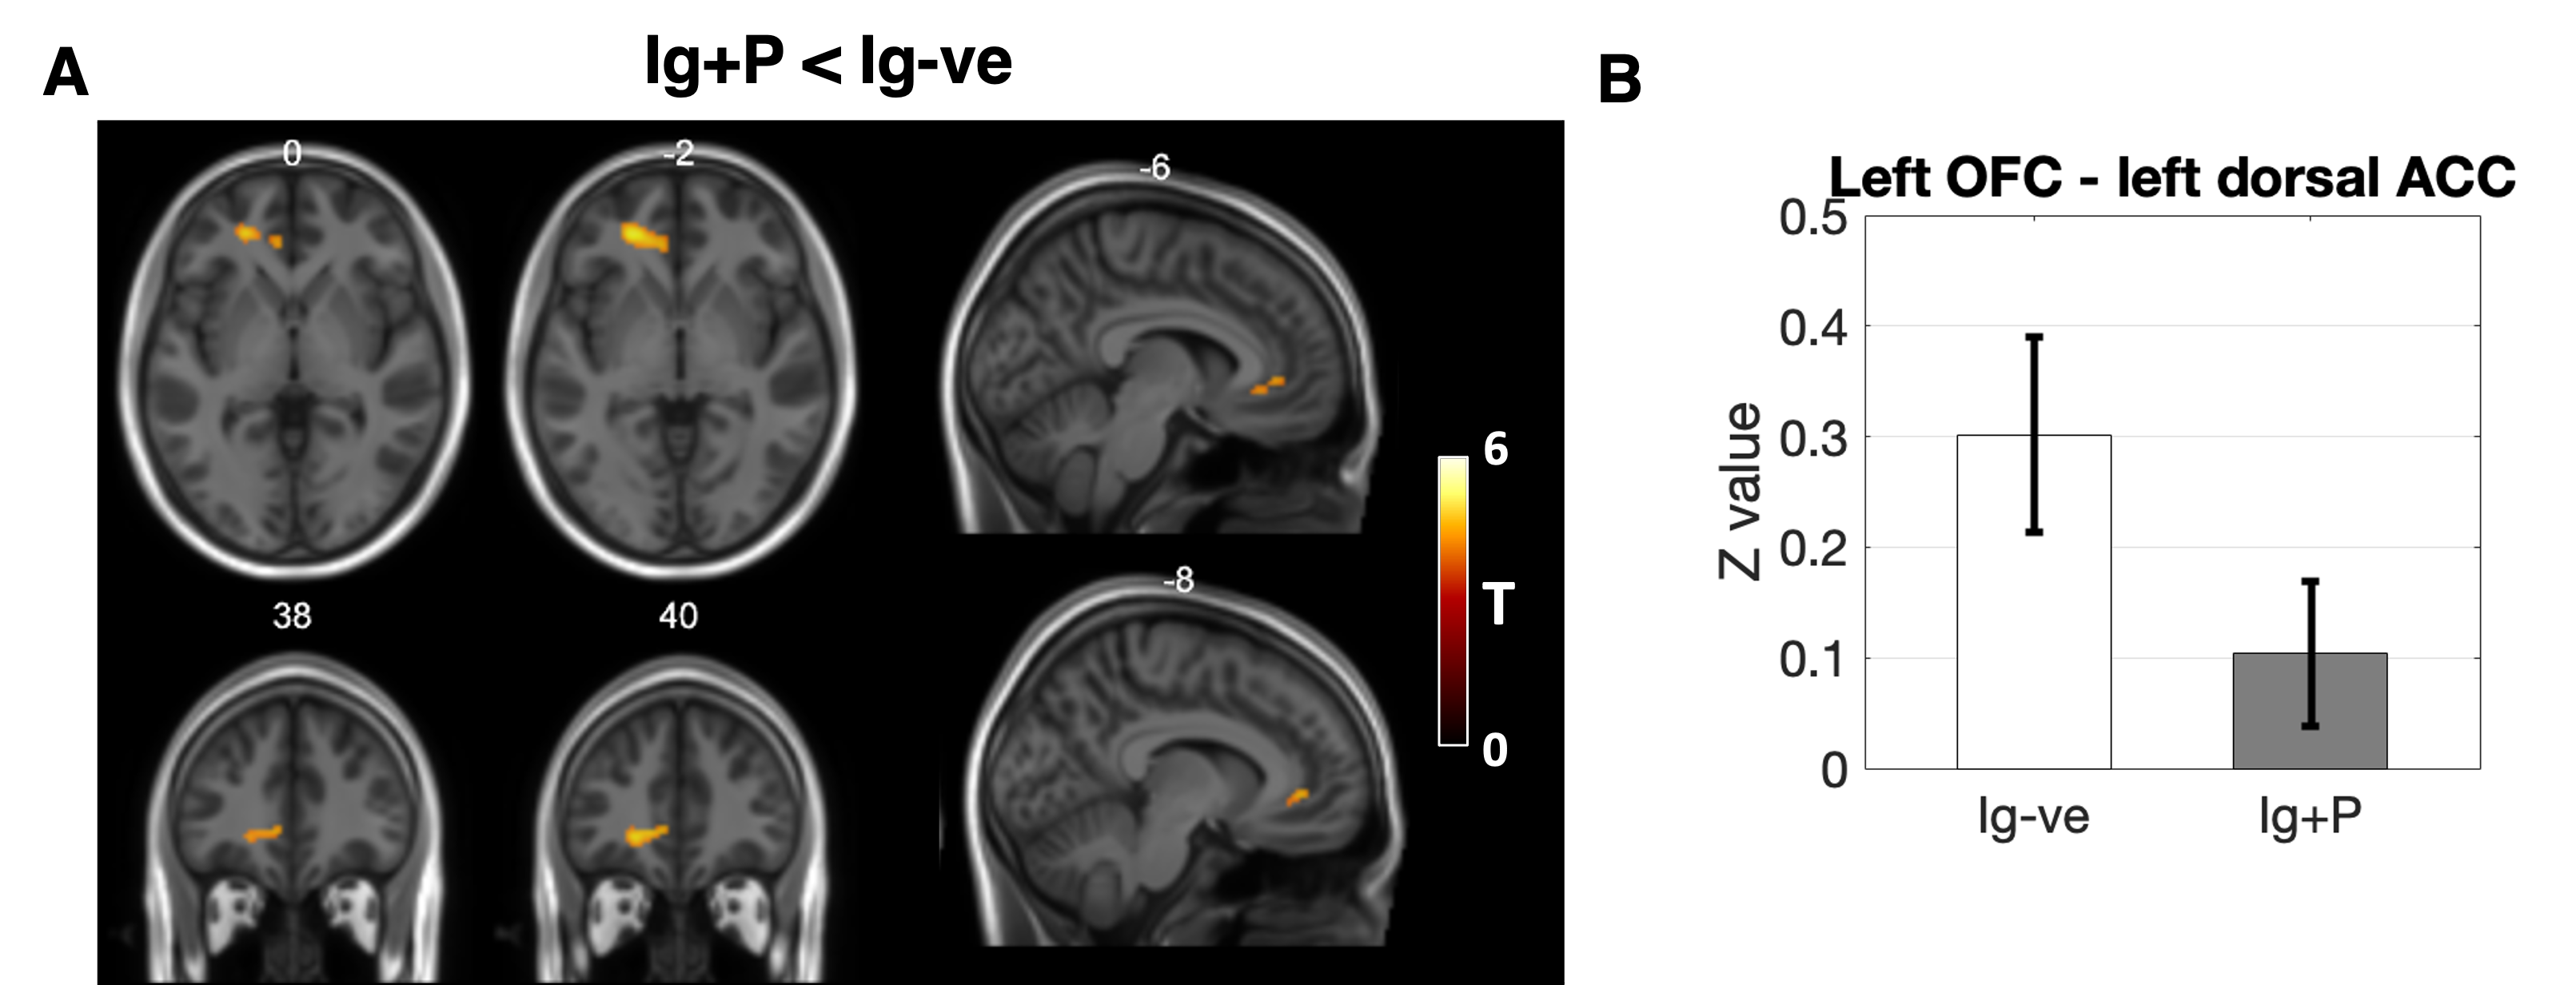
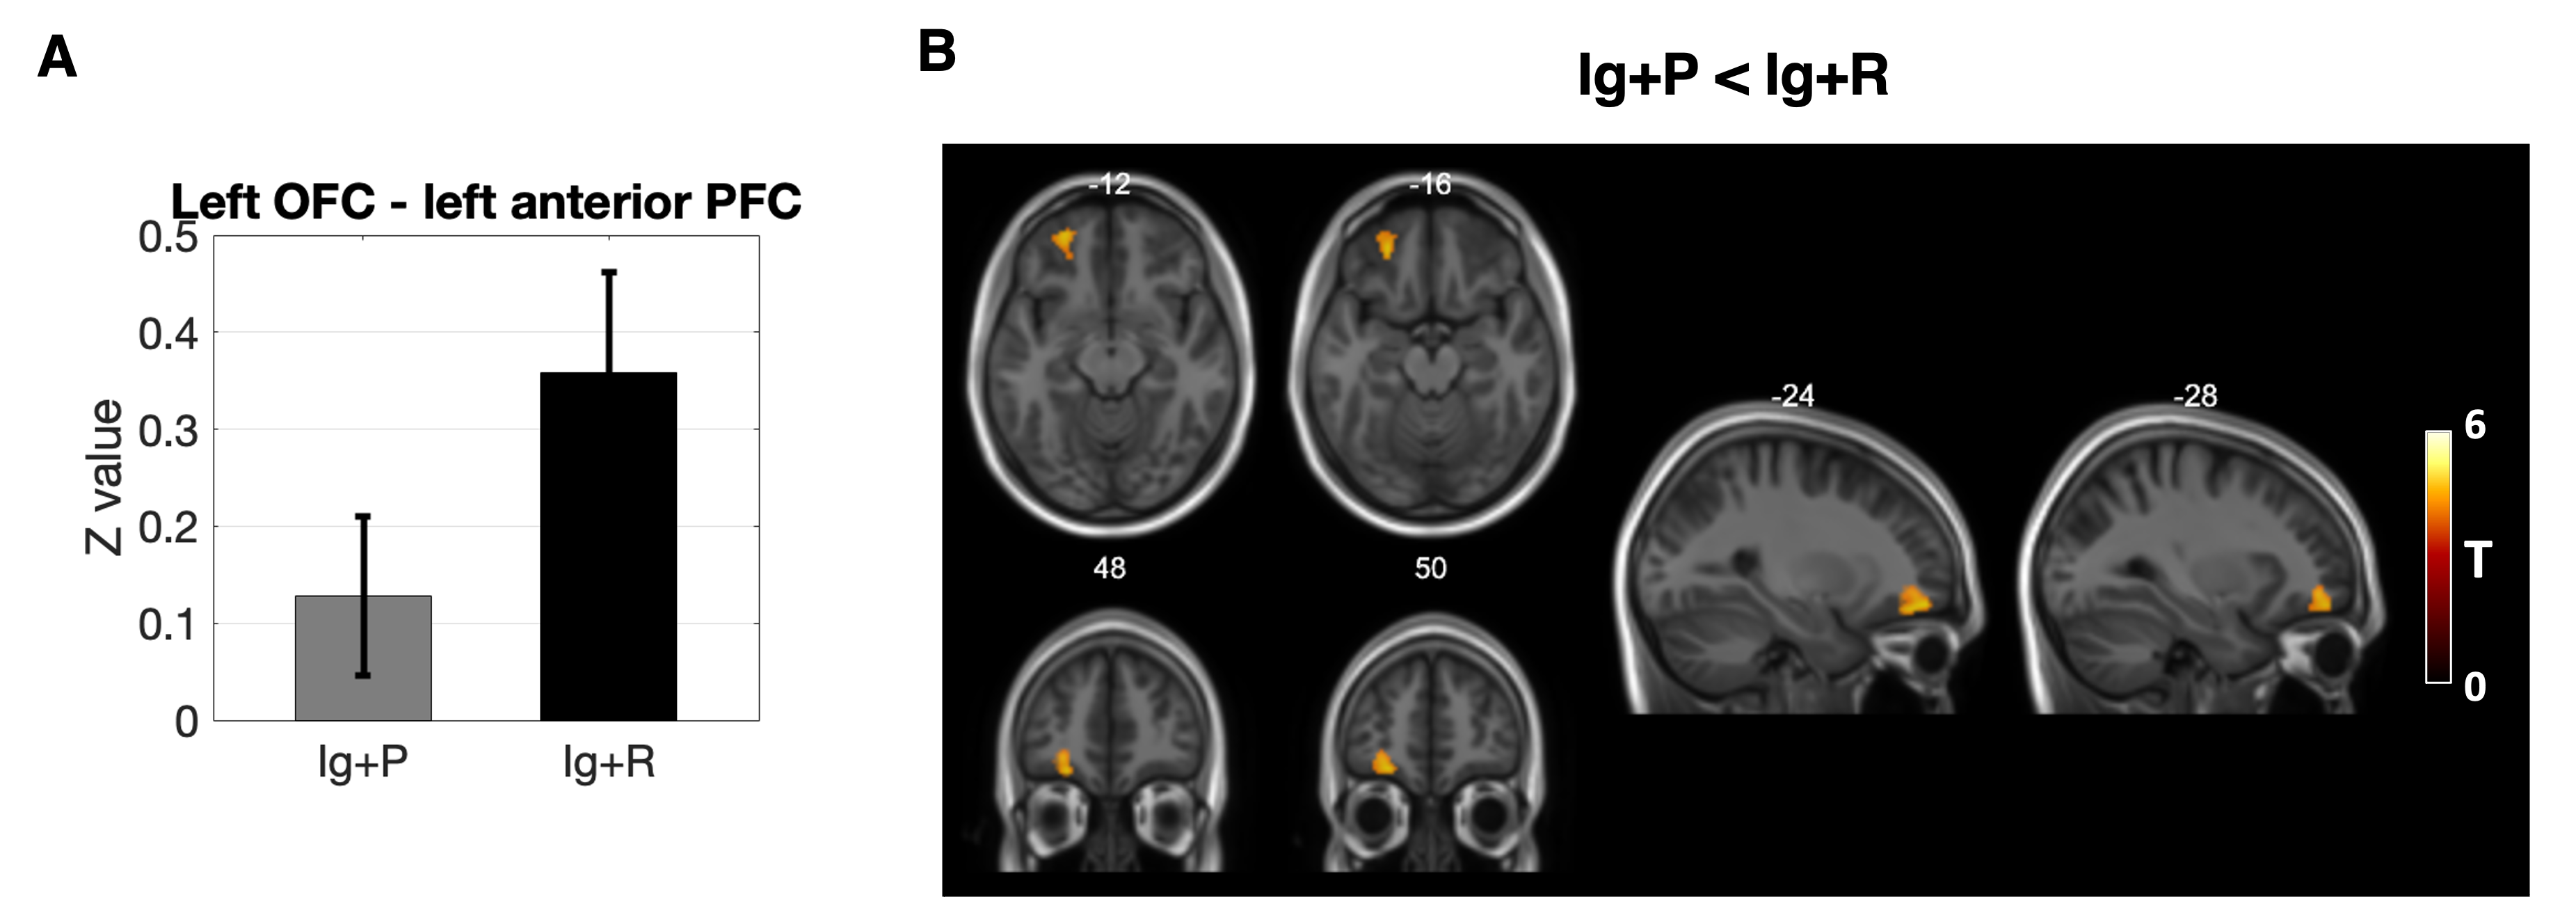
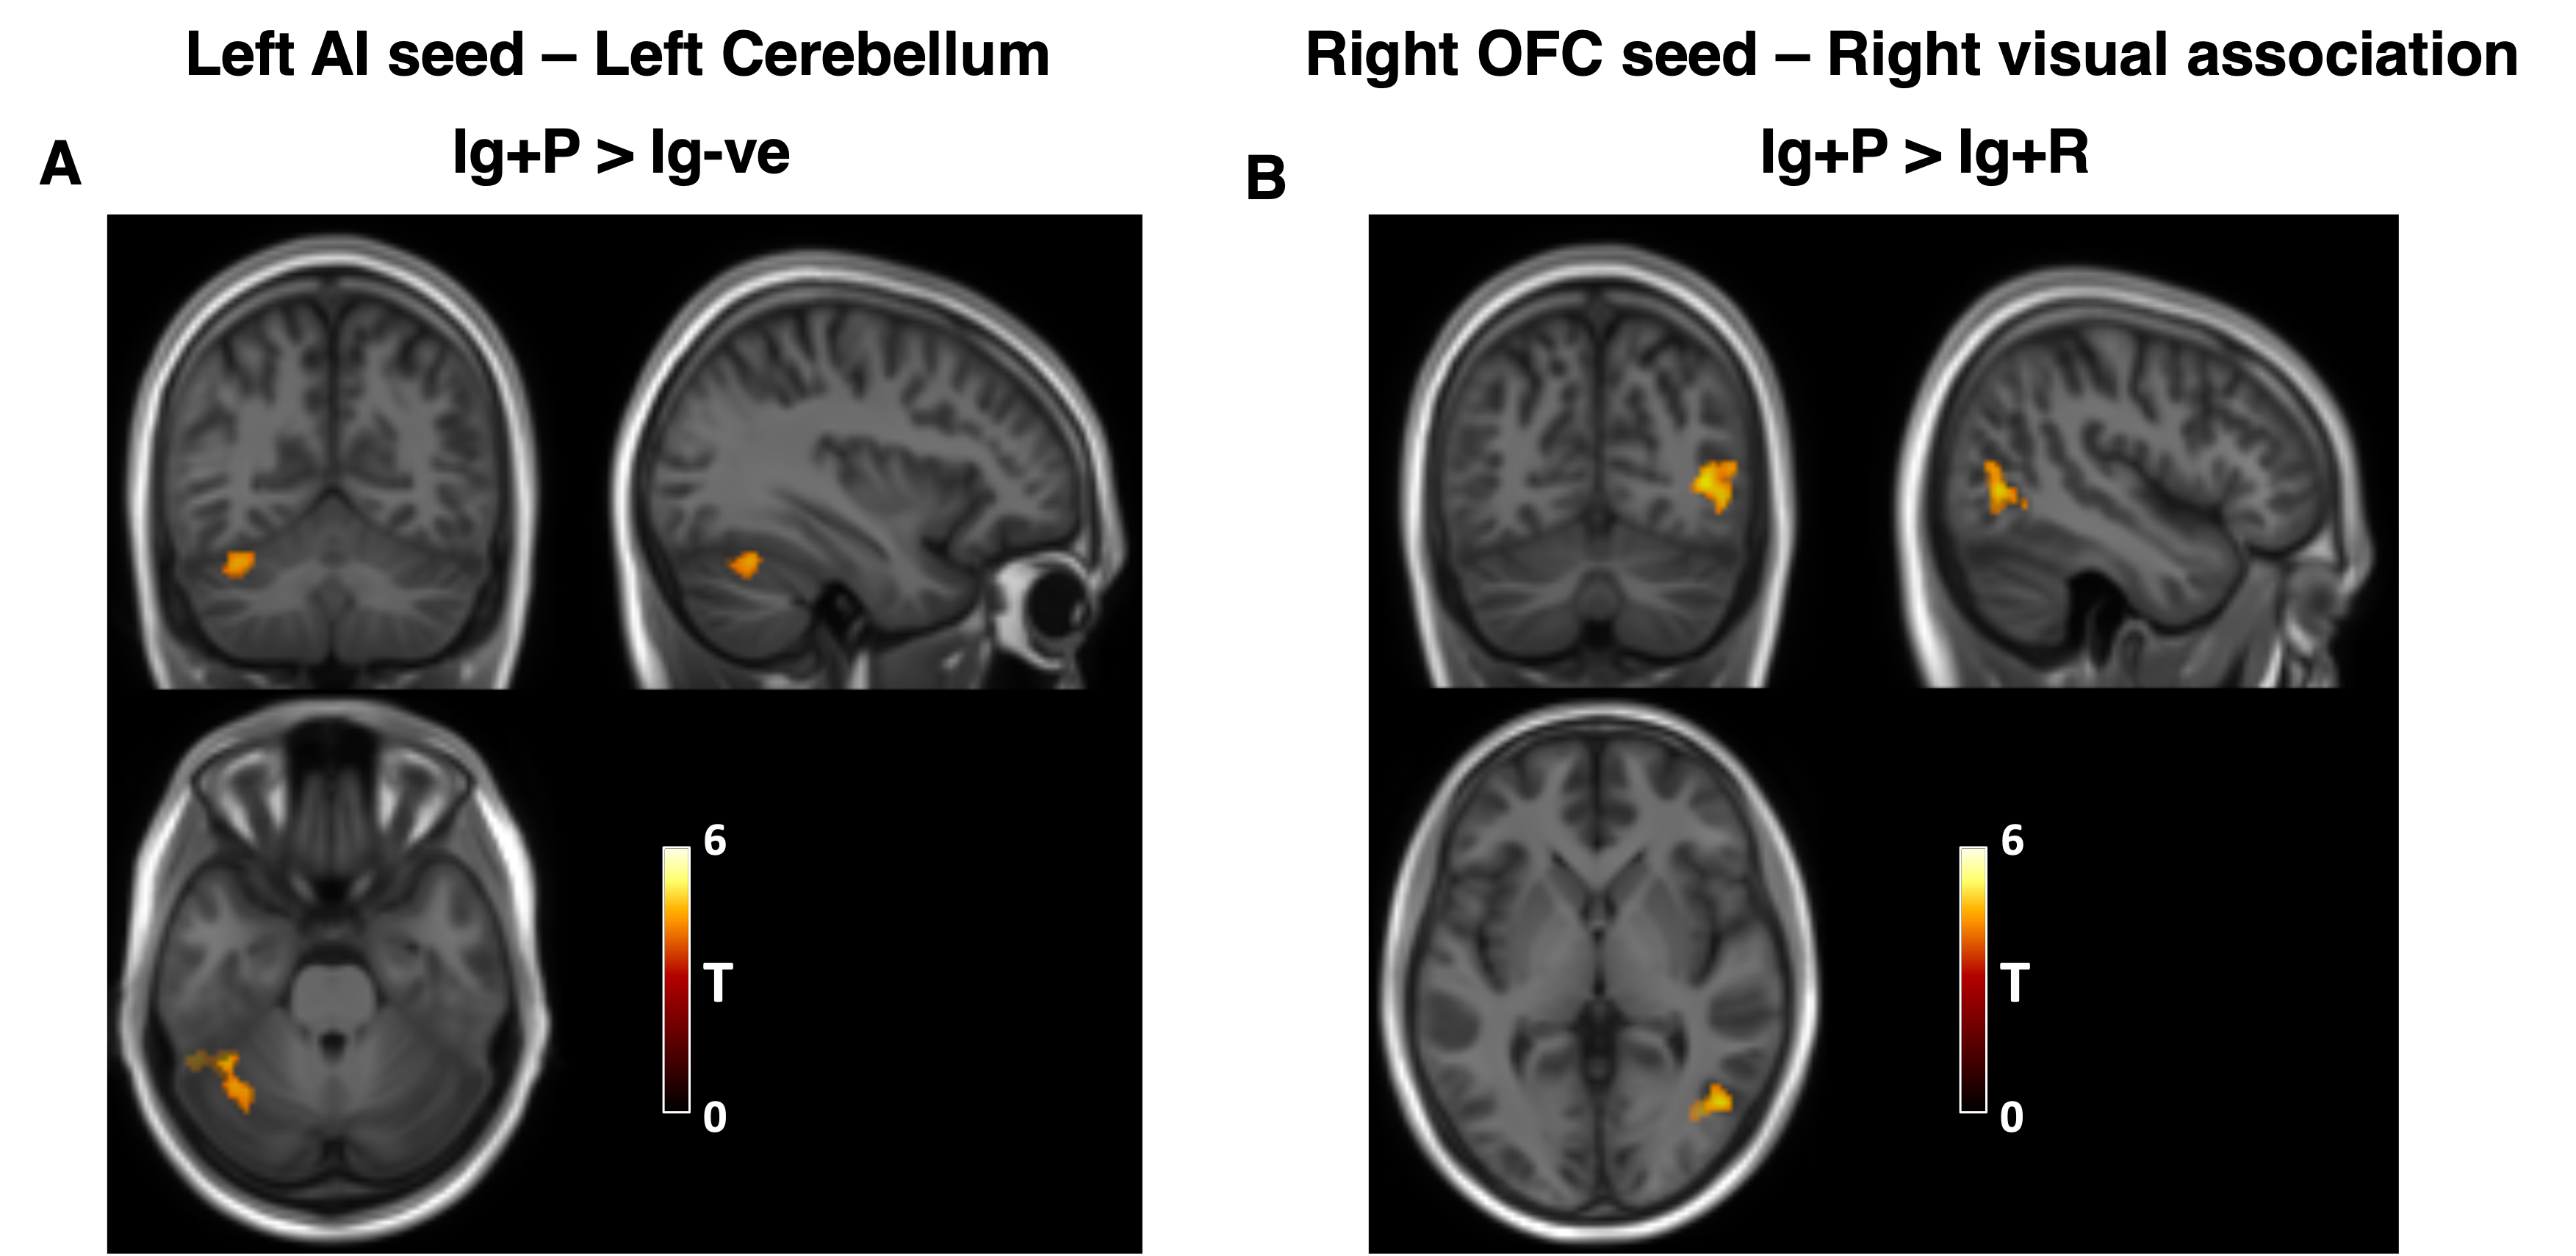
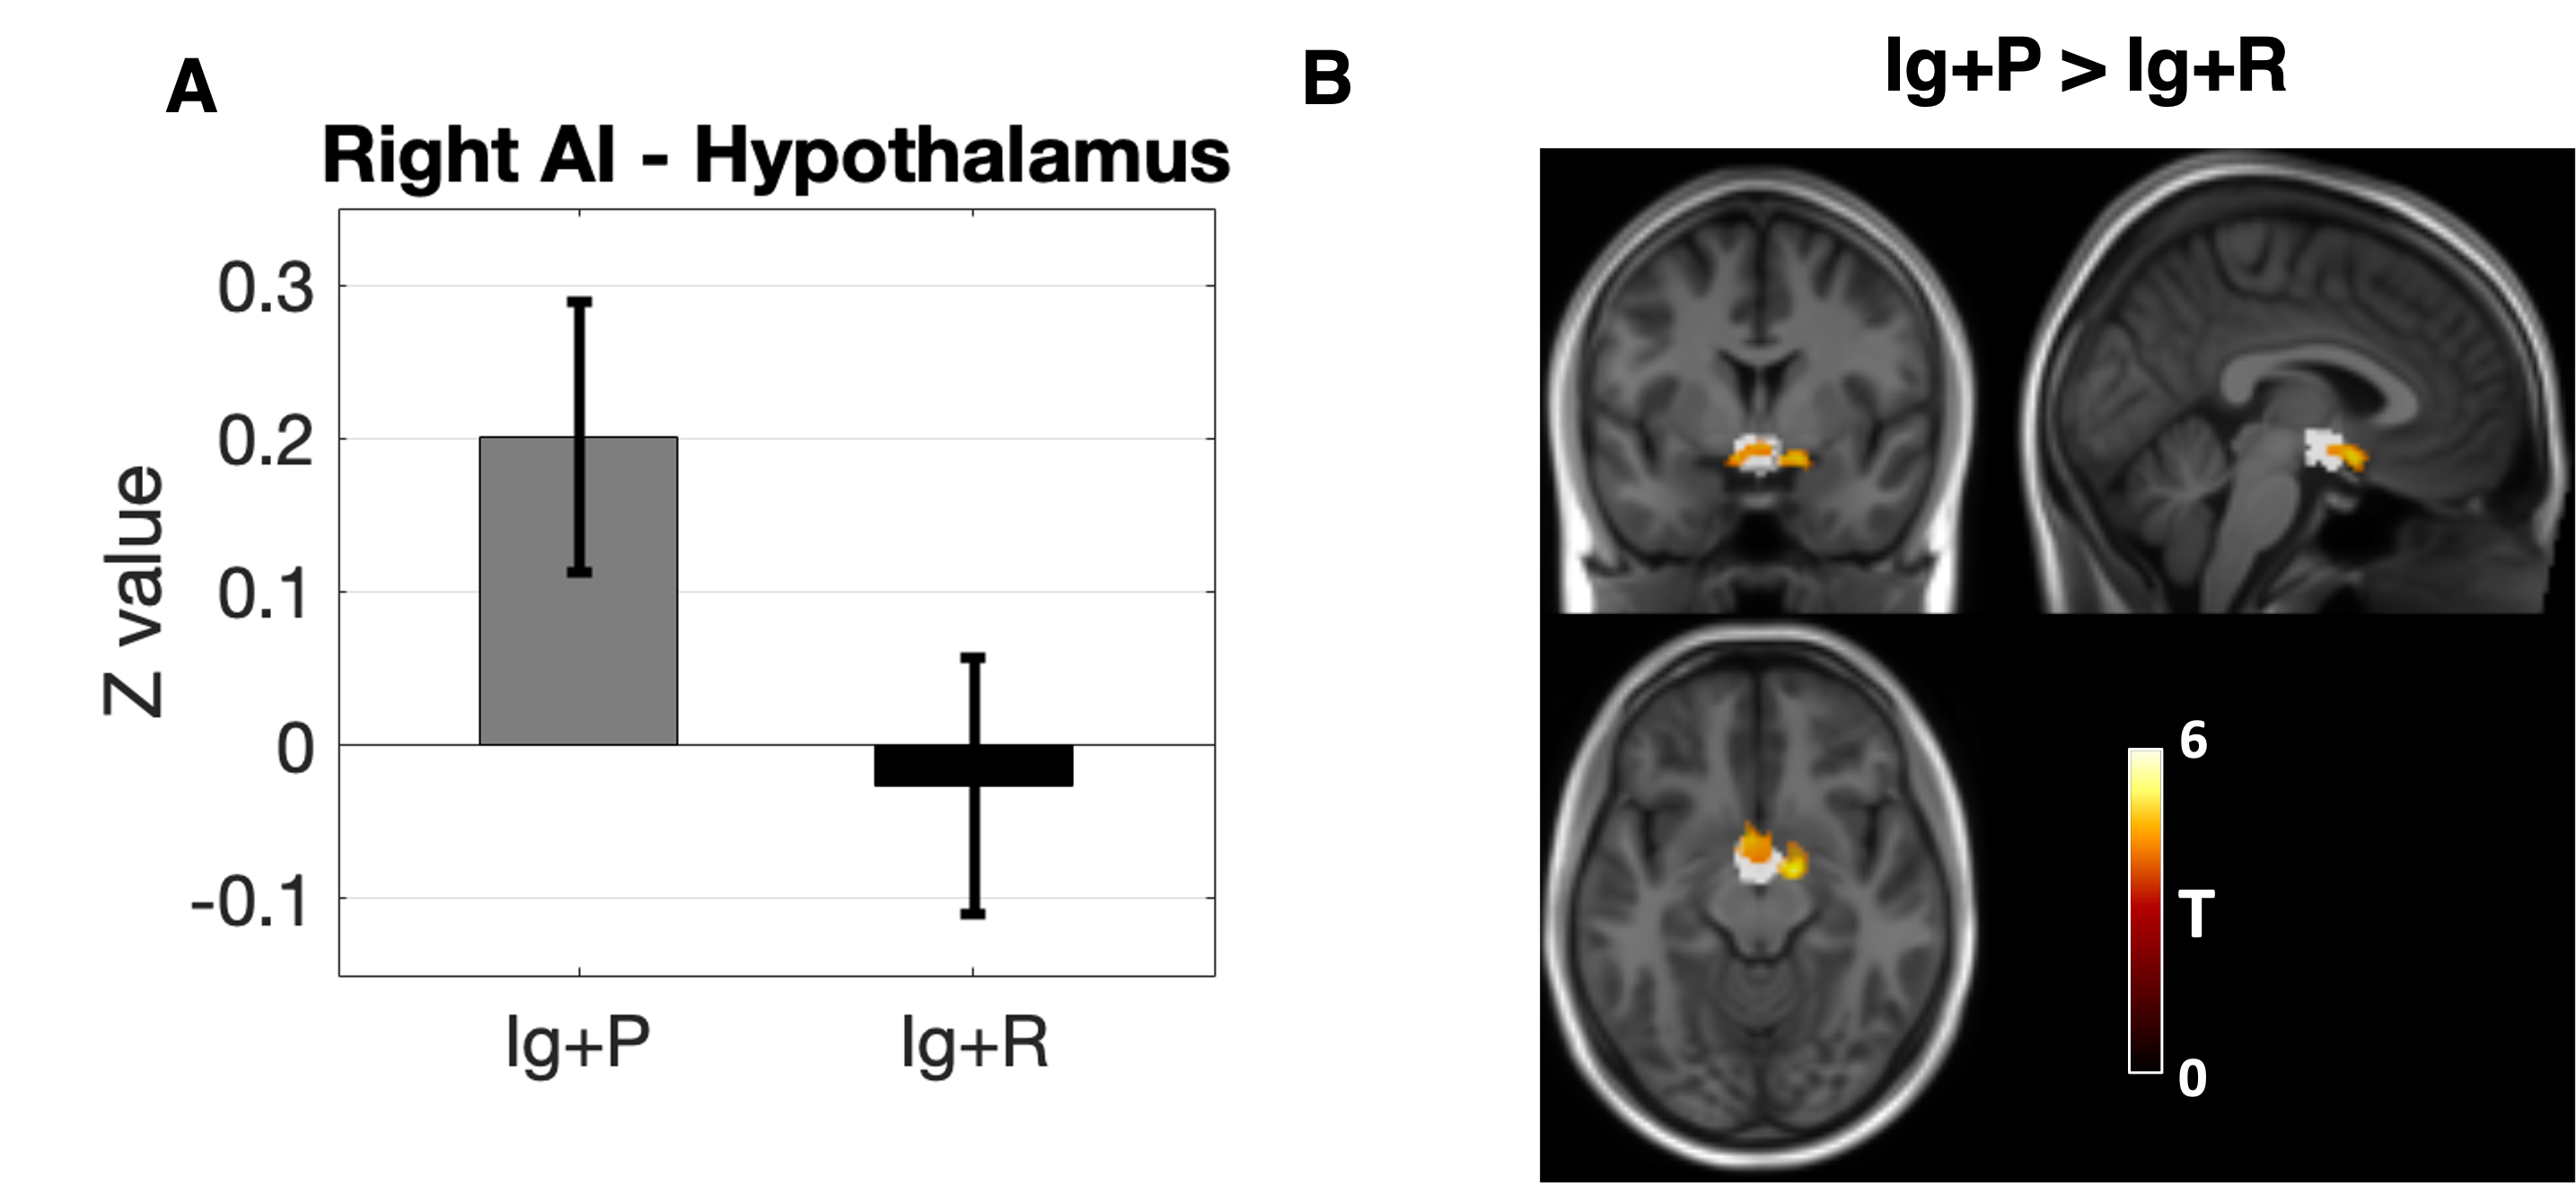
When comparing Ig+P with Ig-ve subjects, the L-OFC-seed analysis showed a significant (p=0.038, T=4.72) reduction in connectivity between the L-OFC seed and a cluster within the left Dorsal Anterior Cingulate Cortex (dACC)(fig 2). R-OFC-connectivity maps yielded a significant cluster (p=0.04, T=4.27) which covers the right visual association cortex and fusiform gyrus which was increased in the Ig+P group compared to the Ig-ve group (fig 4). Finally, Ig+P subjects displayed an increase in connectivity between the left anterior insula and a cluster (p=0.018, T=4.91) located in the cerebellum, left Crus I, compared to Ig-ve group (fig 4).When comparing Ig+P with Ig+R subjects, L-OFC analysis showed a significant reduction (p=0.029, T=4.32) in connectivity with a cluster within the left anterior Prefrontal Cortex (aPFC)(fig 3). L-AI seed analysis showed a significant (p=0.009, T=5.55) increase in connectivity between the seed and a region that overlapped with the hypothalamus Ig+P group when compared to the Ig+R group (fig 5).
This analysis did not present any Ig+R vs Ig-ve group differences.
Discussion
This study found significant resting connectivity differences, both of increased and decreased strength, between individuals who developed COVID-19 related persistent anosmia, who were not hospitalised, those who recovered olfactory function and healthy volunteers. Specifically, there was hypo-connectivity between the L-OFC and a region of the ldACC, known to be involved in odour processing.10 Furthermore, the persistent anosmia group showed significant hyper-connectivity between the R-OFC the visual association cortex and fusiform gyrus as well as between the L-AI and the left Crus I region of the cerebellum. In addition, persistent anosmia subjects also displayed significant hyper-connectivity between the R-AI and the hypothalamus compared to those who recovered their sense of smell. Both regions are involved in eating behaviour and appetite which may also have been affected by anosmia in these patients.11 Finally no differences were observed between healthy controls and subjects who recovered normal olfactory function from anosmia suggesting no long lasting functional impact once smell was recovered. To conclude, such findings may suggest a combination of alterations that may involve damage and recovery processes, opening mechanistic questions that can be investigated further with multi-modal imaging data12 and with odorant task-based fMRI.13Acknowledgements
The authors would like to thank the volunteers and subjects who took part in this study along with the radiographers and members of staff who helped in all aspects of the set up of the study and acquisition of the data.References
1. Chetrit A, Lechien JR, Ammar A et al. Magnetic resonance imaging of COVID-19 anosmic patients reveals abnormalities of the olfactory bulb: Preliminary prospective study. J Infect. 2020;81(5):816-46.
2. Chiu A, Fischbein N, Wintermark M et al. COVID-19-induced anosmia associated with olfactory bulb atrophy. Neuroradiology. 2021;63(1):147-8.
3. Gwenaëlle Douaud, Soojin Lee, Fidel Alfaro-Almagro et al. Brain imaging before and after COVID-19 in UK BiobankmedRxiv 2021.06.11.21258690; doi:https://doi.org/10.1101/2021.06.11.2125869
4. Lee Y, Min P, Lee S et al. Prevalence and Duration of Acute Loss of Smell or Taste in COVID-19 Patients. J Korean Med Sci. 2020;35(18):e174. Published 2020 May 11. doi:10.3346/jkms.2020.35.e174
5. Doty RL, Shaman P, Kimmelman CP et al. University of Pennsylvania Smell Identification Test: a rapid quantitative olfactory function test for the clinic. Laryngoscope. 1984 Feb;94(2 Pt 1):176-8.
6. Adhikari BM, Jahanshad N, Shukla D et al. Heritability estimates on resting state fMRI data using ENIGMA analysis pipeline. Pac Symp Biocomput. 2018;23:307-318. PMID: 29218892
7.Modat M, Cash DM, Daga P et al. Global image registration using a symmetric block-matching approach. J Med Imaging (Bellingham). 2014 Jul;1(2):024003. doi: 10.1117/1.JMI.1.2.024003.
8. Moa G Peter, Peter Fransson, Gustav Mårtensson et al. Normal Olfactory Functional Connectivity Despite Lifelong Absence of Olfactory Experiences, Cerebral Cortex, Volume 31, Issue 1, January 2021, Pages 159–168, https://doi.org/10.1093/cercor/bhaa217
9. Tobia, Michael J.; Yang, Qing X.; Karunanayaka, Prasanna Intrinsic intranasal chemosensory brain networks shown by resting-state functional MRI, NeuroReport: May 4, 2016 - Volume 27 - Issue 7 - p 527-531 doi: 10.1097/WNR.0000000000000579
10. García-Cabezas MÁ, Barbas H. A direct anterior cingulate pathway to the primate primary olfactory cortex may control attention to olfaction. Brain Struct Funct. 2014;219(5):1735-1754. doi:10.1007/s00429-013-0598-3
11. Wright, Hazel, Li, Xiaoyun, Fallon, Nicholas B et al. Differential effects of hunger and satiety on insular cortex and hypothalamic functional connectivity. European Journal of Neuroscience, 2016. 43 (9). 1181 - 1189.
12. Gandini Wheeler-Kingshott, C A.M. Yiannakas M, Marakonidis J et al. Advanced magnetic resonance imaging to study brain tissue alterations in people infected with SARS-COV-2. ISMRM 2021, Montreal, Digital Poster 1742.
13. Tabert MH, Steffener J, Albers MW, Kern DW, Michael M, Tang H, Brown TR, Devanand DP. Validation and optimization of statistical approaches for modeling odorant-induced fMRI signal changes in olfactory-related brain areas. Neuroimage. 2007 Feb 15;34(4):1375-90. doi: 10.1016/j.neuroimage.2006.11.020. Epub 2006 Dec 28. PMID: 17196831.
Figures