0731
Myocardial Metabolic Changes Detected Post-COVID-19 with Hyperpolarized Pyruvate1University of Texas Southwestern Medical Center, Dallas, TX, United States
Synopsis
Noninvasive detection of myocardial inflammation can be challenging. Up to 73% of patients recovered from COVID-19 had increased native T1 on cardiac MRI1 representing inflammation or edema. Therefore, we tested whether hyperpolarized (HP) [1-13C]pyruvate detectis post-COVID-19 inflammation in the myocardium. HP [1-13C]lactate has been suggested as a surrogate imaging marker of inflammation in the heart2,3, attributed to increased glycolytic activity in infiltrating white cells plus a possible increase in activity of lactate dehydrogenase. We demonstrate the feasibility of imaging with HP [1-13C]pyruvate as noninvasive method to detect metabolic changes that may identify cardiac inflammation in the convalescent stage after COVID-19.
INTRODUCTION
Although clinical myocarditis is a rare manifestation of COVID-19, a large proportion of patients who have recovered from COVID-19 (~73%) have evidence of increased cardiac T1 by cardiac MRI that may represent inflammation or edema in a subacute setting. This disconnect supports the use alternate imaging strategies to better identify the presence of myocardial inflammation. Imaging with hyperpolarized (HP) agents offers the detection of flux in individual enzyme-catalyzed reactions in the myocardium without ionizing radiation. After injection of HP[1-13C]pyruvate, [13C]bicarbonate and [1-13C]lactate can be produced in vivo through pyruvate dehydrogenase (PDH) and lactate dehydrogenase (LDH), respectively. HP [1-13C]lactate production has been suggested as a surrogate imaging marker of inflammation. Increased lactate-to-pyruvate ratio in inflamed tissue has been attributed to increased glycolytic activity in infiltrating white cells plus a possible increase in activity of LDH. HP [13C]bicarbonate production indicates flux through PDH, an enzyme critical for carbohydrate oxidation, and a biomarker of mitochondrial integrity. We designed a pilot study to evaluate the feasibility of using hyperpolarization technology among patients with prior hospitalization due to COVID-19 infection.METHODS
Patients hospitalized with COVID-19 – confirmed by reverse transcription-polymerase chain reaction – identified at two hospitals affiliated with our medical center between September, 2020, and September, 2021 were studied after written informed consent was obtained. Exclusion criteria were: contraindications to MRI, prior cardiovascular disease, clinical evidence of active cardiopulmonary symptoms and severe chronic kidney disease. All subjects had standard commercial testing for high-sensitivity detection of troponin T or I as part of hospital standard-of-care. Hyperpolarization procedures: briefly, [1-13C]pyruvic acid (Sigma-Aldrich, St Louis, MO, USA) mixed with 15-mM radical (AH111501; GE Healthcare, Waukesha, WI, USA), was assembled with a clinical fluid path (GE Healthcare) and polarized. An integrated 1H and 13C cardiac MR protocol was performed on a 3T MRI scanner (750w; GE Healthcare, Waukesha, WI, USA), with the scanner body coil for RF excitation and 1H data acquisition and two-loop 13C Helmholtz surface coils (PulseTeq Limited; Chobham, Surrey, UK) for 13C data acquisition. First, 1H cardiac cine MRI was performed for structural reference and characterization of the cardiac cycle in short-, vertical-long-, and horizontal-long-axis planes during expiratory breath hold, with cardiac gating (FOV = 400 × 400 mm2, spatial resolution = 2.1 × 2.1 mm2, slice thickness = 8 mm, flip angle = 50o, TE = 1.2 ms, TR = 3.4 ms, number of phases/cycle = 30). Second, HP 13C pyruvate, lactate and bicarbonate signal was acquired in mid ventricular short axis, with the injection of HP 13C pyruvate (0.43 mL/kg body weight, confirmed for quality assurance parameters) at 5 mL/s followed by a 25mL saline flush using a MedRad injector (Bayer HealthCare LLC), with a time-resolved multi-echo spiral imaging sequence at end-diastole, using a spectral-spatial RF pulse interleaved every one R-R (FOV = 400 × 400 mm2, spatial resolution = 16 × 16 mm2, slice thickness = 30 mm, δ TE = 9.6 ms, #echo = 6, flip angle = 60o for bicarbonate and lactate, 20o for pyruvate). After acquisition of the first 13C data set, glucose was administered as a paste (48 grams). One hour later, HP imaging with [1-13C]pyruvate was repeated. Conventional 1H cardiac MRI studies were performed for correlation on a wide bore 3T scanner (Ingenia; Philips, Best, The Netherlands) with a 32-channel phased array digital receiver coil to acquire cardiac volumes, mass, function, native T1 and T2 mapping, and post-contrast scar imaging (0.1 mmol/kg gadobutrol (Gadavist/Gadovist; Bayer HealthCare LLC, Whippany, USA)) imaging.RESULTS AND DISCUSSION
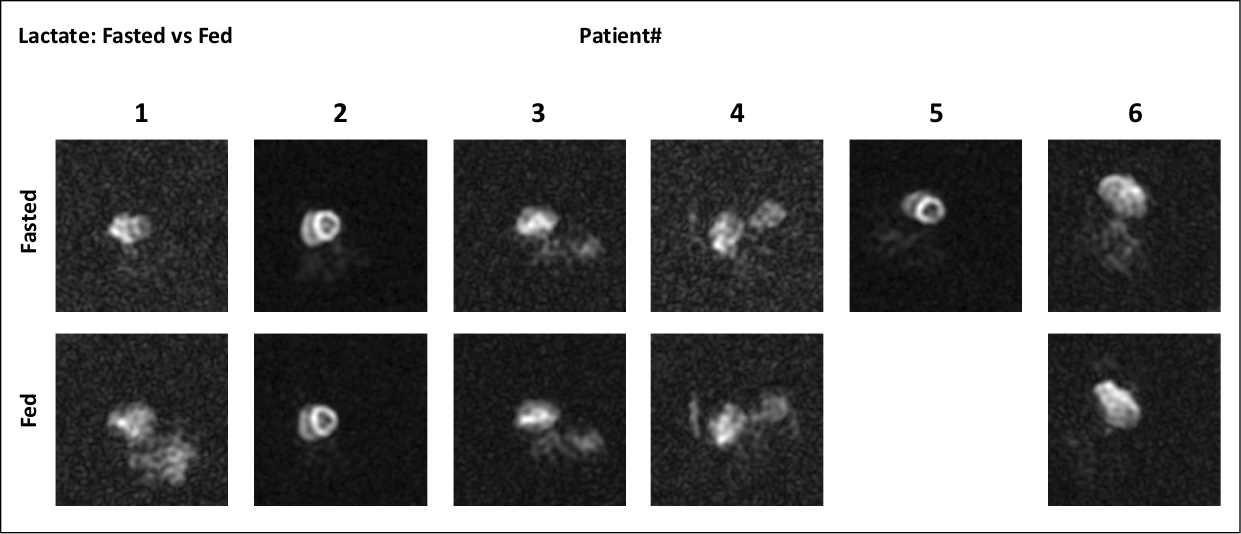
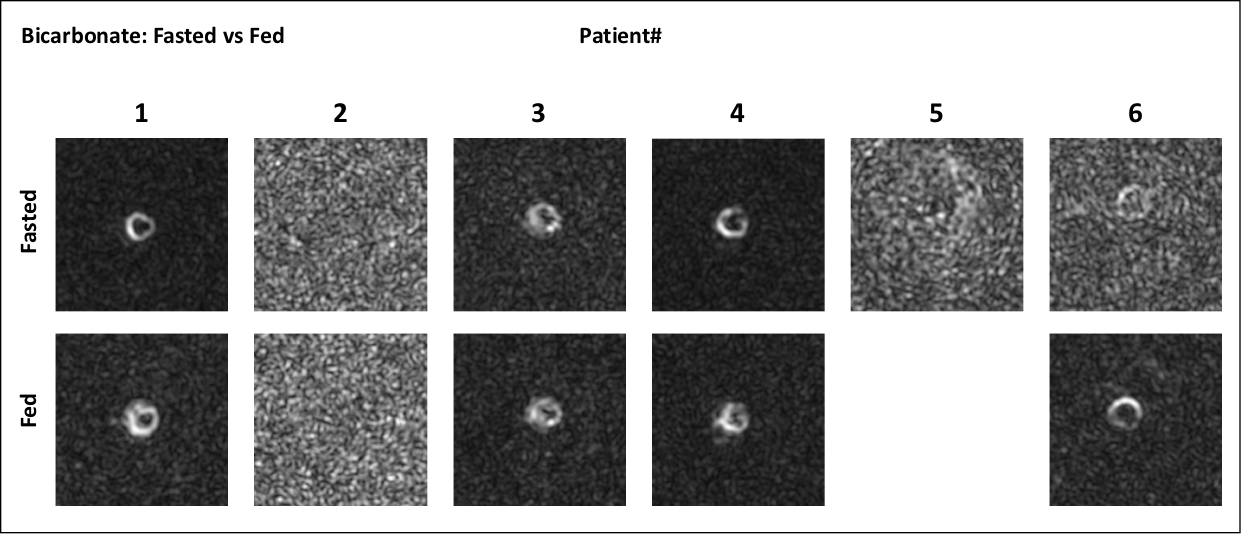
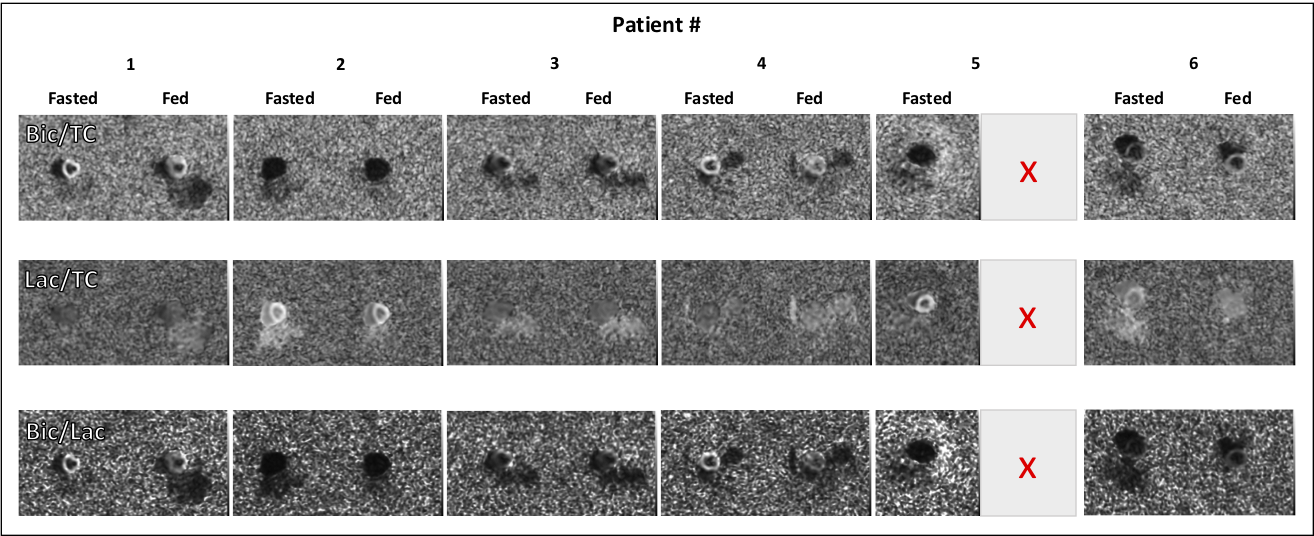
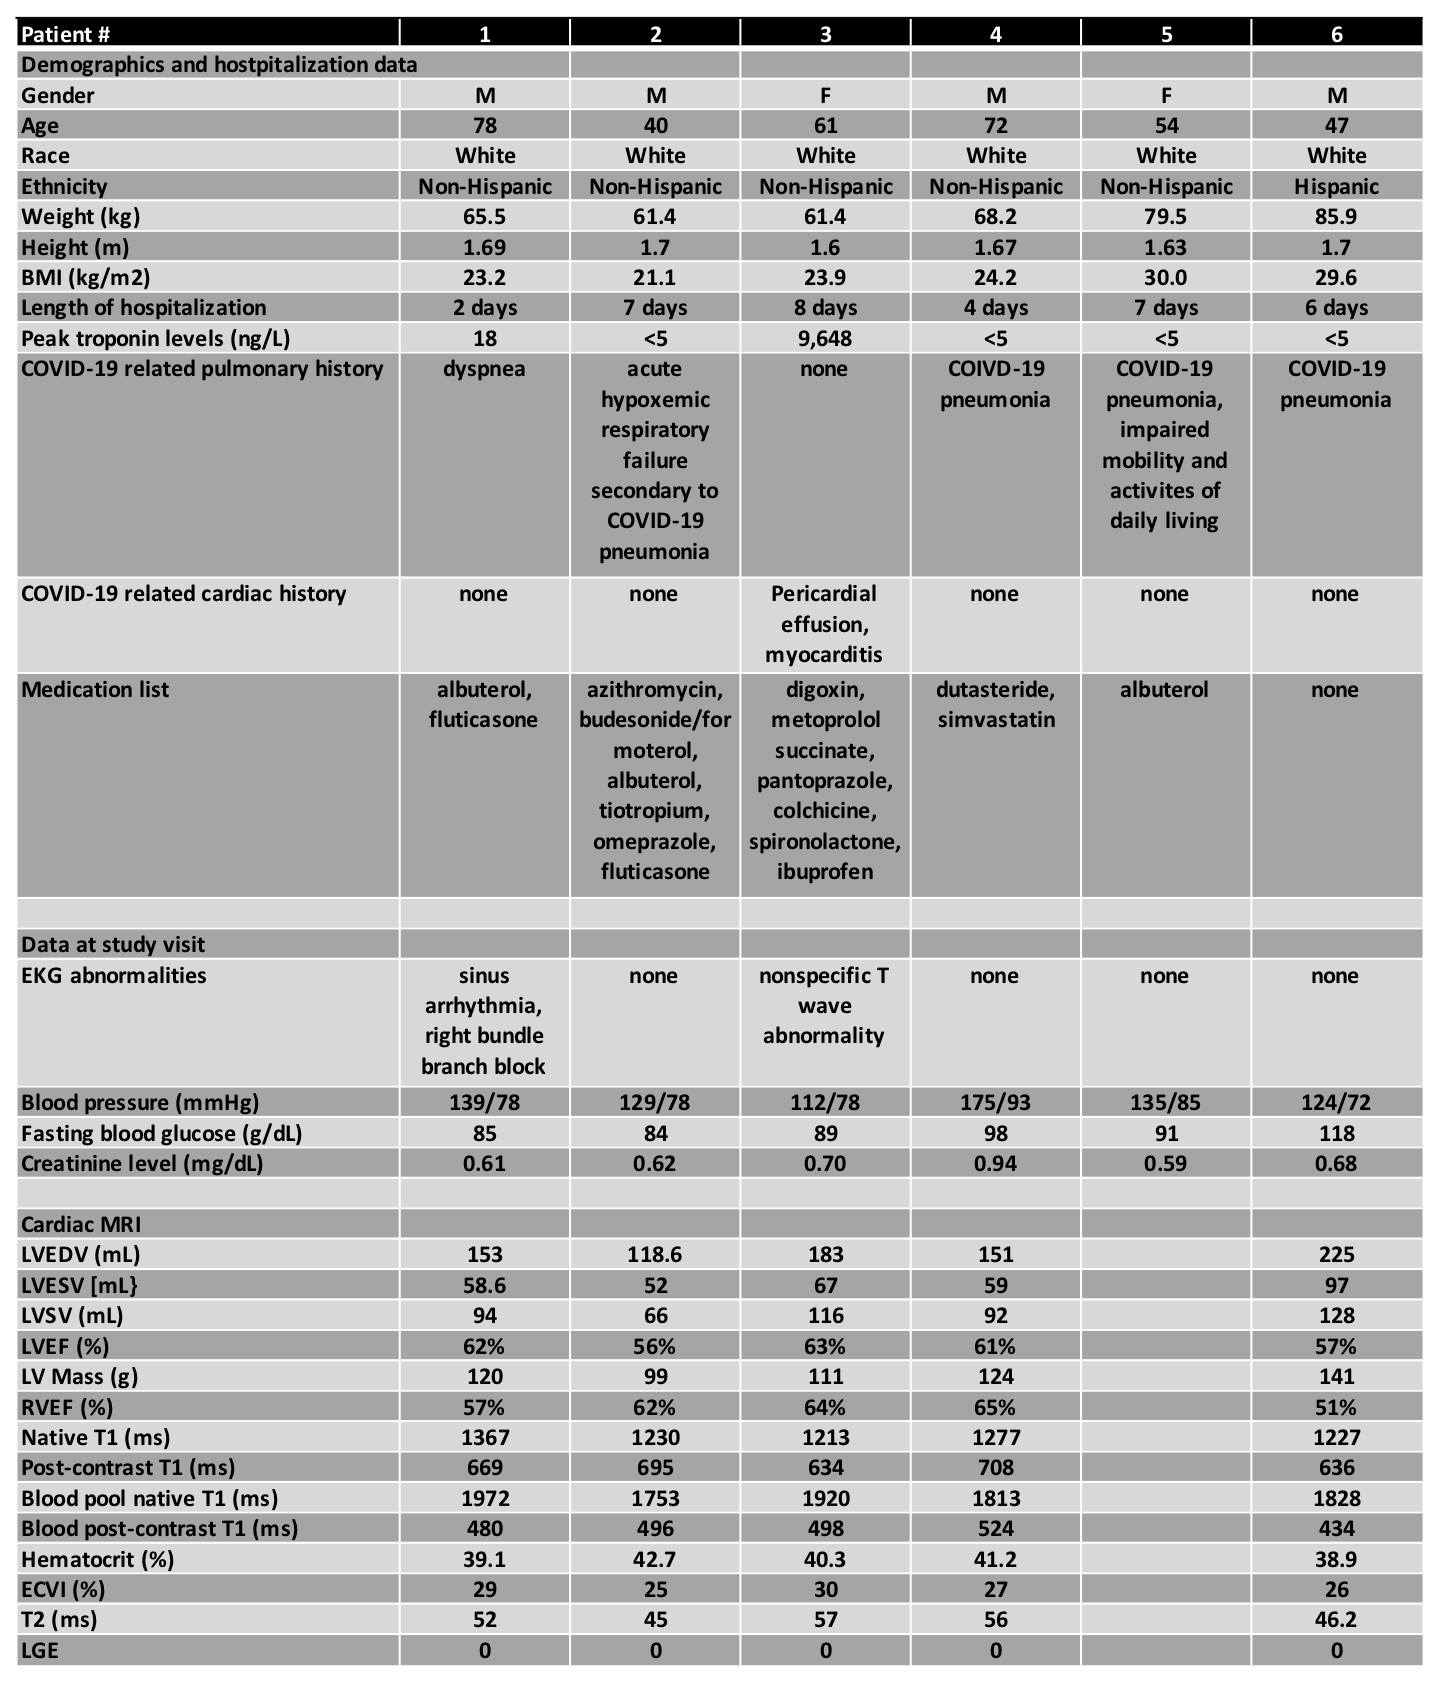
Six patients recovered after COVID-19 (age = 58.6 ± 14.6 years; 4 males and 2 females) were studied. Patient characteristics are shown in Table 1. Of six patients enrolled only one patient had a significant increase in high sensitivity troponin T test, and was diagnosed with myocarditis. There were no differences in cardiac function, with values within normal range.Figure 1 shows time-resolved hyperpolarized 13C cardiac images for lactate during fasting and fed conditions. Figure 2 shows time-resolved hyperpolarized 13C cardiac images for bicarbonate during fasting and fed conditions.Figure 3 shows metabolite ratios of bicarbonate to total carbon, lactate to total carbon and bicarbonate to lactate. All patients tolerated the injection of HP 13C pyruvate well. Of the six patients one was not able to tolerate the oral glucose load and exited the study before the second injection and the conventional CMRI. A notable increase in lactate production was present in patients 2 and 5 during fasting state, and persistent after glucose ingestion in patient 2, indicating increased glycolysis. Interestingly, these results were not associated with increased troponin level during hospitalization, or with an increase in T1 or T2 values, therefore more likely representing a change in the oxidative myocardial metabolism with decreased utilization of pyruvate.CONCLUSION
Imaging the metabolic products of HP [1-13C]pyruvate in the myocardium after COVID-19 infection is feasible and well-tolerated by patients. This technology enables a new approach to testing hypotheses about cardiac inflammation and myocardial metabolic function.Acknowledgements
Personnel Support: We appreciate the clinical research team and the supporting staffs of the Advanced Imaging Research Center at UT Southwestern – Crystal E. Harrison, PhD, James Ratnakar, PhD, Jeannie Baxter, RN, Kelley Derner, RN, Salvador Pena, Dan Tetrick, and Maida Tai. We also thank GE Healthcare and Galen Reed, PhD, for the technical support on operating the SPINlab polarizer.
Funding: National Institutes of Health of the United States (P41 EB015908, S10 RR029119, S10 OD018468, R01 NS107409); The Welch Foundation (I-2009-20190330); The Cancer Prevention and Research Institute of Texas (RP180404).
References
1. Puntmann VO, Carerj ML, Wieters I, et al. Outcomes of Cardiovascular Magnetic Resonance Imaging in Patients Recently Recovered From Coronavirus Disease 2019 (COVID-19). JAMA Cardiol. 2020;5(11):1265-1273.
2. Lewis AJM, Miller JJ, Lau AZ, et al. Noninvasive Immunometabolic Cardiac Inflammation Imaging Using Hyperpolarized Magnetic Resonance. Circ Res. 2018;122(8):1084-1093.
3. Anderson S, Grist JT, Lewis A, Tyler DJ. Hyperpolarized (13) C magnetic resonance imaging for noninvasive assessment of tissue inflammation. NMR in biomedicine. 2021;34(3):e4460.
Figures