0729
Quantifying Fetal Vertebral Body Calcium Changes Using Quantitative Susceptibility Mapping1Department of Radiology, Wayne State University, Detroit, MI, United States, 2SpinTech Inc., Bingham Farms, MI, United States, 3Department of Radiology, Shandong Provincial Hospital, Shandong University, Jinan, China, 4Department of Radiology, Shandong Provincial Hospital Affiliated to Shandong First Medical University, Jinan, China
Synopsis
In vivo fetal vertebral calcium content was quantified using local quantitative susceptibility mapping (QSM) collected as part of a STAGE double flip angle (FA) protocol. A strong decreasing average vertebral susceptibility as a function of gestational age was seen in 54 normal fetuses including 37 cases with QSM data available at both FA’s and 17 cases with QSM at one FA totaling 91 independent datasets. An almost one-to-one linear correlation was seen between the QSM values from both FA’s. These results provide strong evidence of an in vivo MR-based quantitative technique to measure calcium development pre-term.
Introduction
The spine is a vital and complex structure, supporting the body as a whole and serving as a conduit for safe passage of the neural elements. Any bone mineral density (BMD) variations caused by vertebral disorders, such as pathologic changes in calcification and hematopoietic bone marrow, may affect the magnetic susceptibility.1 It is believed that in human fetuses, under normal circumstances, roughly 80% of fetal bone growth occurs during the third trimester.2 Despite limited literature, there appears to be some post-mortem evidence of increasing vertebral calcification in fetuses as a function of GA.3 Nevertheless, an in vivo evaluation of the normal calcification process in the fetal spine has yet to be studied. Therefore, the purpose of this study was to quantify calcium deposition in the vertebrae of fetuses at their second and third trimesters in vivo using QSM and provide reference information on the normal development of the vertebral calcium content. We hypothesized that the calcium deposition in the fetal vertebrae generally increases over GA leading to a corresponding decreasing trend in susceptibility.Methods
A total of 54 patients (average GA: 30.79±4.23 weeks, range: 23.00-38.57 weeks) during the second and third trimesters were recruited and underwent MR imaging on a 3T Siemens Skyra. The maternal demographic information is summarized in Table 1. The MRI data were collected as part of a 2D double FA triple-echo GRE Strategically Acquired Gradient Echo (STAGE) imaging protocol covering the fetal spine with the following imaging parameters: repetition time (TR) = 40ms, TE1 = 7.52ms, TE2 = 18.84ms and TE3 = 30.16ms; FA1 = 8o and FA2 = 40o, matrix size = 384 × 384, pixel bandwidth = 260Hz/pixel, in-plane resolution = 1 × 1mm2, slice thickness = 3mm collected over 48 slices with a total acquisition time = 6 minutes and 32 seconds per sequence (8.16 second per slice).In order to avoid severe dephasing effects from vertebral calcium content at longer TE’s, only the data from the first echo were used for QSM processing. The susceptibility mapping post-processing steps were as follows: a BET (threshold=0.2, erosion=4, island=2000) for brain extraction;4 3DSRNCP for phase unwrapping;5 SHARP for background field removal (threshold=0.05, kernel=6)6 and, finally, a TKD technique for inverse filtering7 with an iterative approach (threshold=0.1, iterations=4)8 was used for susceptibility reconstruction. In order to eliminate signal interference and potential streaking artifacts from the surrounding tissue, an in-house MATLAB-based local QSM approach was applied prior to susceptibility reconstruction using a manual region of interest (ROI) traced around the vertebral column for a few consecutive slices.
Separate 3D-ROIs were drawn individually on each vertebra primarily in the thoracic and lumbar aspects in which the vertebrae are considered to be of the proper size at that stage9 as shown in Figure 1. Using SPIN software (SpinTech, Inc., Bingham Farms, MI, USA) the boundaries were manually drawn on continuous 2D slices on as many fetal vertebral bodies as possible throughout the imaging slab showing hypointense signal without visible motion or streaking artifacts and including at least 30 pixels within the total 3D ROI. The average susceptibility values from the aggregate ROIs were then extracted from each subject as an estimation of spinal calcification and then plotted as a function of GA. Moreover, to evaluate the consistency of QSM measurements between the two FA’s, the average susceptibility values from FA = 8o were plotted against those of FA = 40o in 37 subjects from which QSM data for both FA’s were available.
Results
Figure 2 shows the average susceptibility as a function of GA. A linear regression model was fit to the combined data revealing a decreasing trend with a slope of -52.3 ppb/week and a Pearson correlation coefficient (PCC) of 0.83 (p<0.001 for both). In the 37 subjects for whom STAGE local QSM data from both FA’s were available, the mean ± standard deviation of the average susceptibility was -1111 ± 278 ppb and -1081 ± 262 ppb for the 8o and 40o FA data, respectively, with the paired sample t-test showing no significant difference between the two. (p = 0.156) The correlation between the individual corresponding average values was also fit by a linear regression model with a slope of 0.95 and a PCC value of 0.90, as shown in Figure 3. (p < 0.001 for both).Discussion and Conclusions
To our knowledge, this is the first in vivo and in utero imaging study quantifying calcium content in the fetal spine. The decrease in average vertebral susceptibility as a function of GA is aligned with previous autopsy-based literature on normal ossification and bone development pre-term. In conclusion, QSM in the vertebrae is a reliable technique for evaluating fetal BMD. Our results provide reference values for calcium content during the second and third trimesters in the fetus. Such information would facilitate early detection of ossification defects in the fetal spine as early as 20 weeks of gestation. The significance of our findings awaits further testing in pregnancies affected by fetal vertebrae abnormalities.Acknowledgements
No acknowledgement found.References
1. Schick F, Nagele T, Lutz O, Pfeffer K, Giehl J. Magnetic susceptibility in the vertebral column. J Magn Reson B 1994;103:39-52.
2. Kovacs CS. Calcium and bone metabolism disorders during pregnancy and lactation. Endocrinol Metab Clin North Am 2011;40:795-826.
3. Oyedepo AC, Henshaw DL. Calcification of the lumbar vertebrae during human fetal development. Calcif Tissue Int 1997;61:179-182.
4. Smith SM. Fast robust automated brain extraction. Human brain mapping 2002;17:143-155.
5. Abdul-Rahman HS, Gdeisat MA, Burton DR, Lalor MJ, Lilley F, Moore CJ. Fast and robust three-dimensional best path phase unwrapping algorithm. Applied optics 2007;46:6623-6635.
6. Schweser F, Deistung A, Lehr BW, Reichenbach JR. Quantitative imaging of intrinsic magnetic tissue properties using MRI signal phase: an approach to in vivo brain iron metabolism? NeuroImage 2011;54:2789-2807.
7. Haacke EM, Tang J, Neelavalli J, Cheng YC. Susceptibility mapping as a means to visualize veins and quantify oxygen saturation. Journal of magnetic resonance imaging : JMRI 2010;32:663-676.
8. Tang J, Liu S, Neelavalli J, Cheng YC, Buch S, Haacke EM. Improving susceptibility mapping using a threshold-based K-space/image domain iterative reconstruction approach. Magnetic resonance in medicine : official journal of the Society of Magnetic Resonance in Medicine / Society of Magnetic Resonance in Medicine 2013;69:1396-1407.
9. Scaal M. Early development of the vertebral column. Semin Cell Dev Biol 2016;49:83-91.
Figures
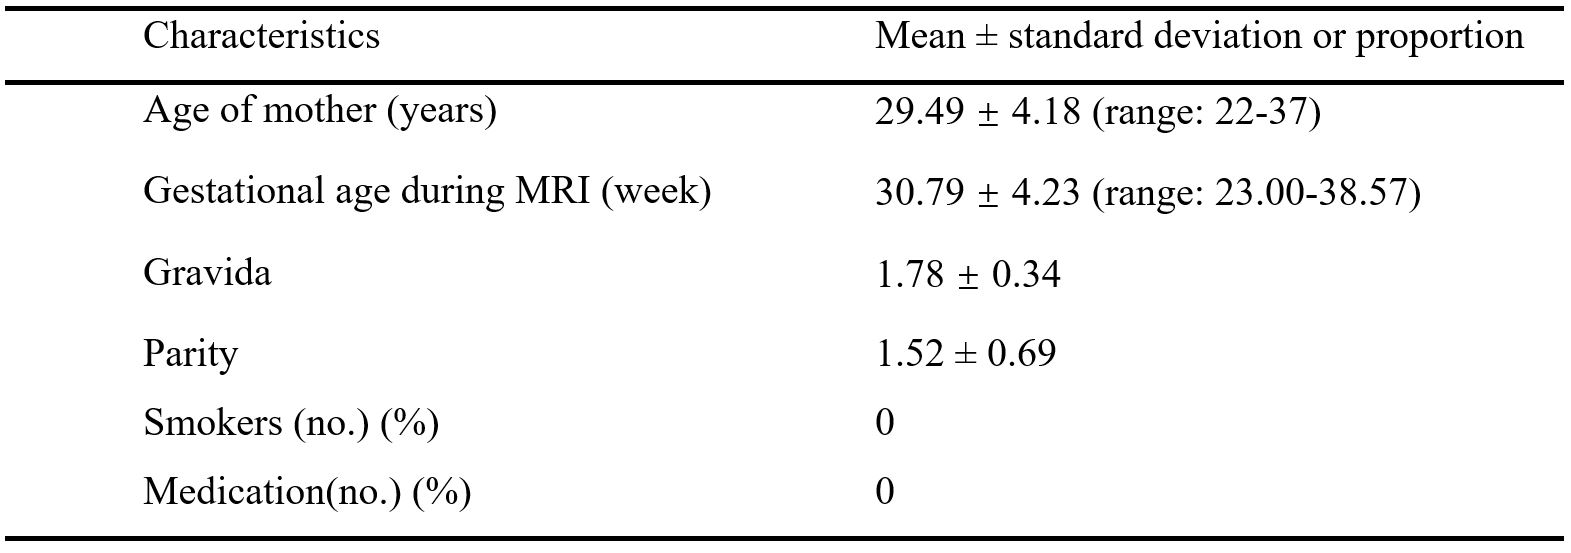
Table 1. Maternal demographic information.
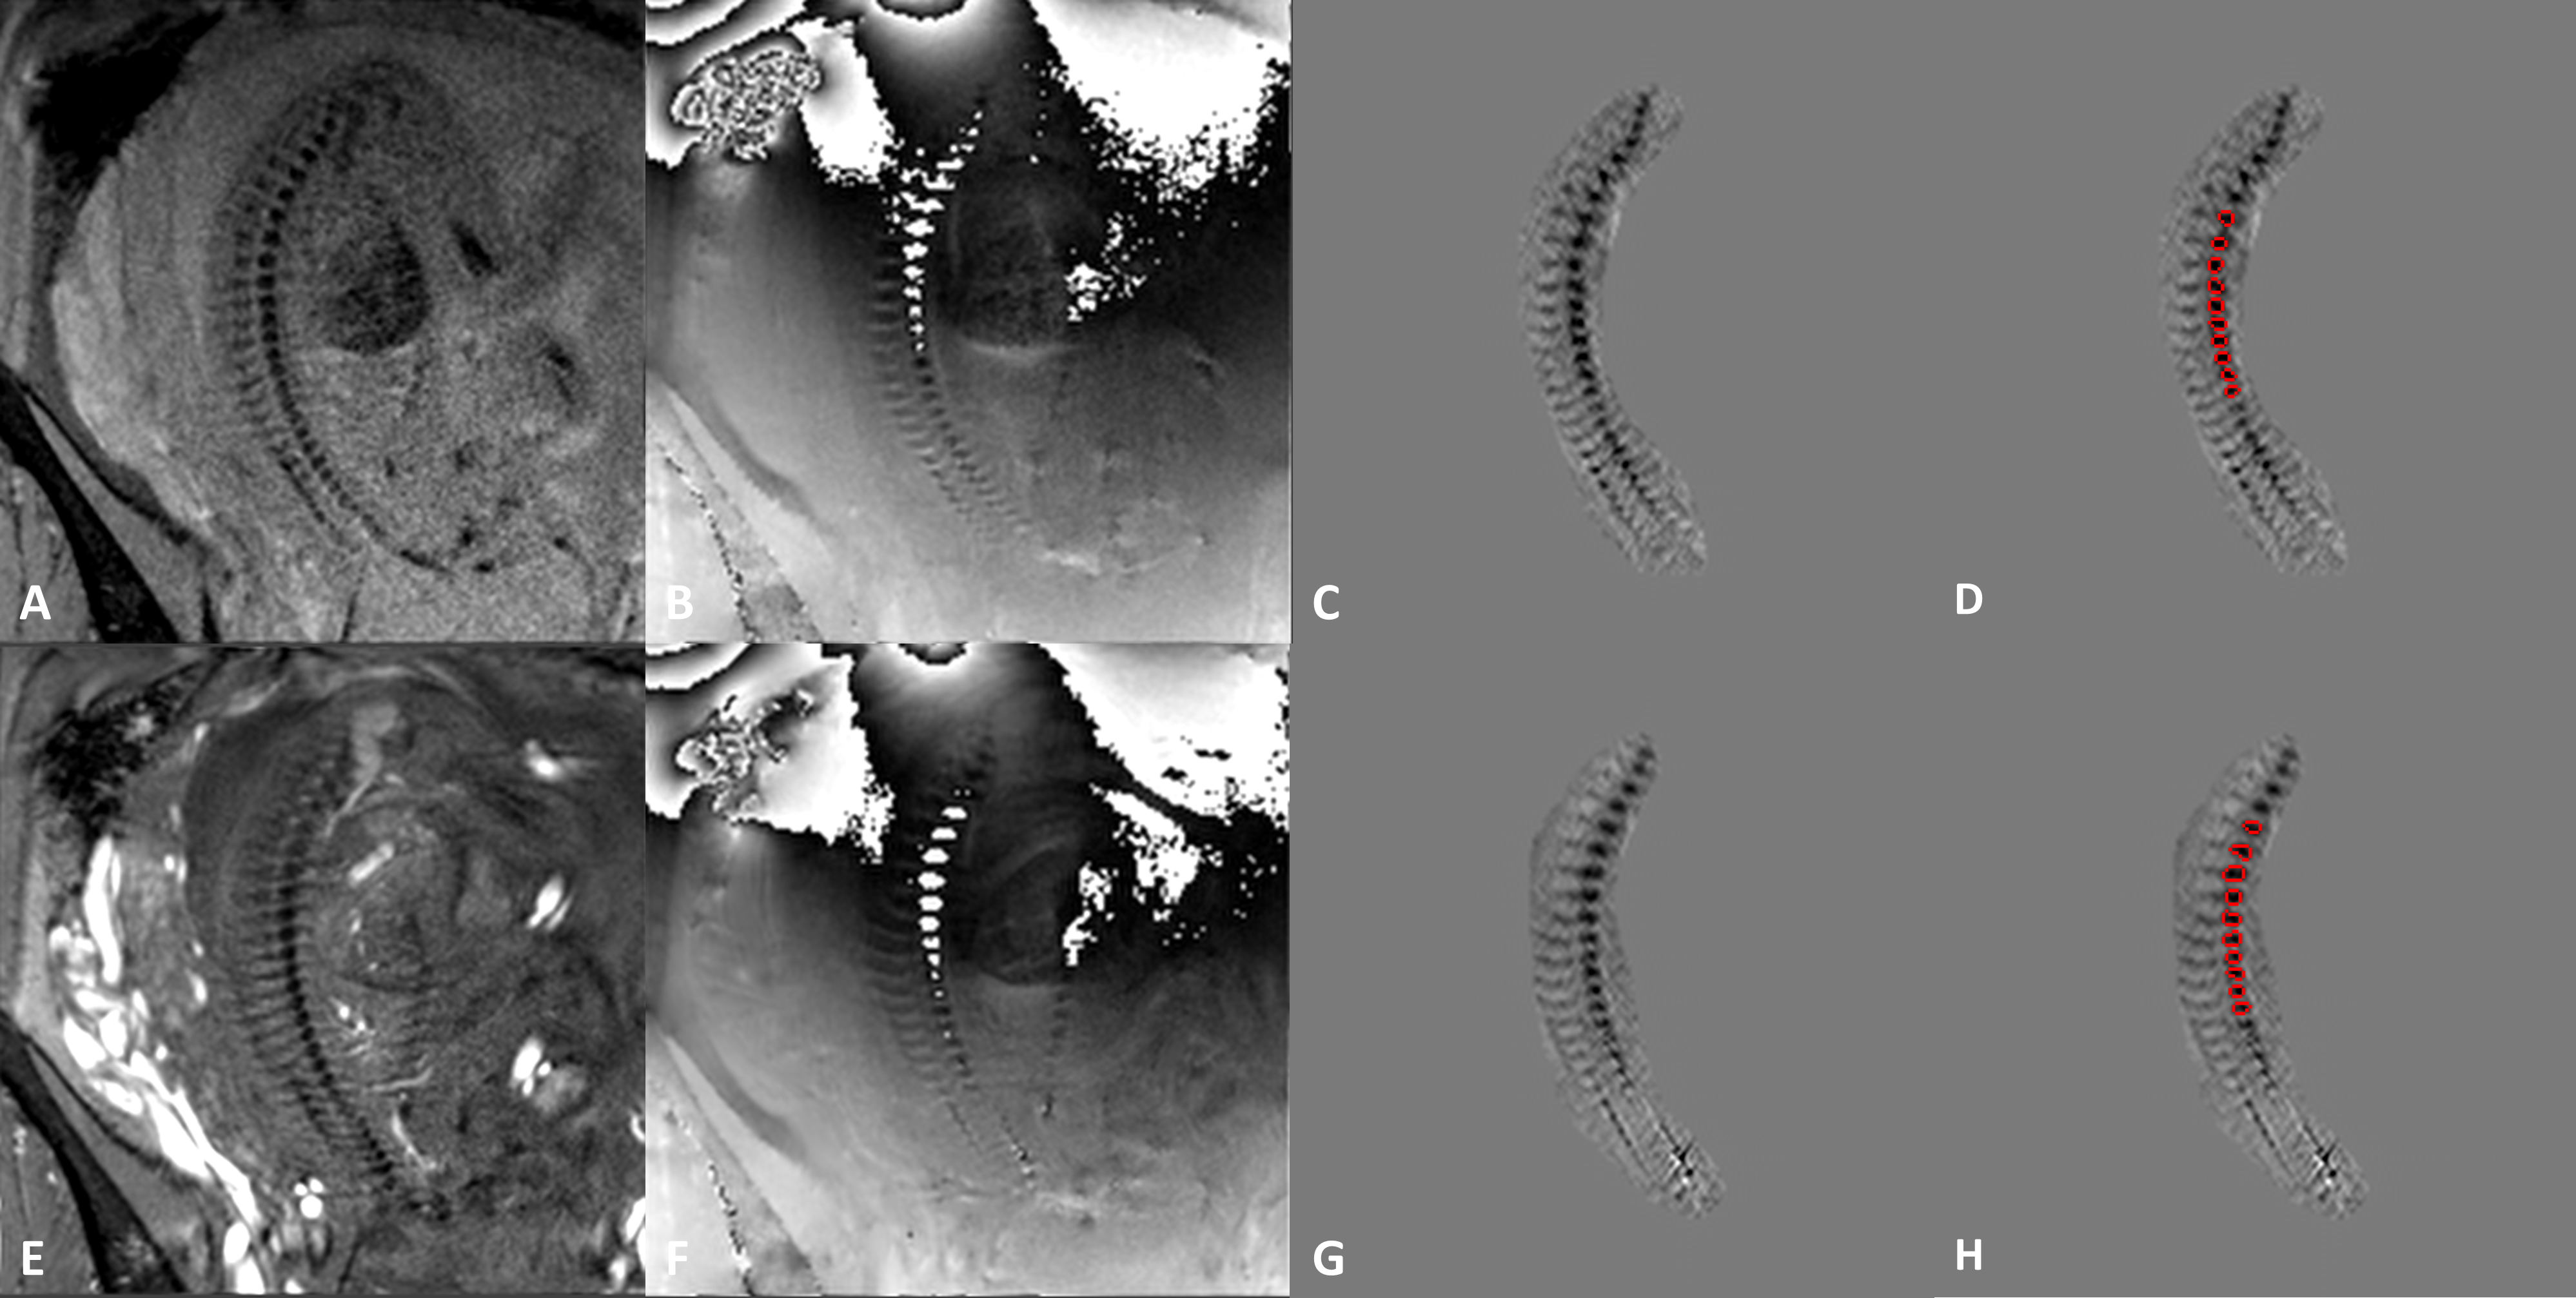
Figure 1. STAGE low and high flip angle original data and the post-processed local QSM data of the spine in a fetus at 25 weeks and 5 days of gestational age. A-D) original magnitude, phase, and local QSM without and with the corresponding ROIs overlaid on the susceptibility maps from the 8o FA data, respectively. E-H) original magnitude, phase, and local QSM without and with the corresponding ROIs overlaid on the susceptibility maps from the 40o FA data, respectively.
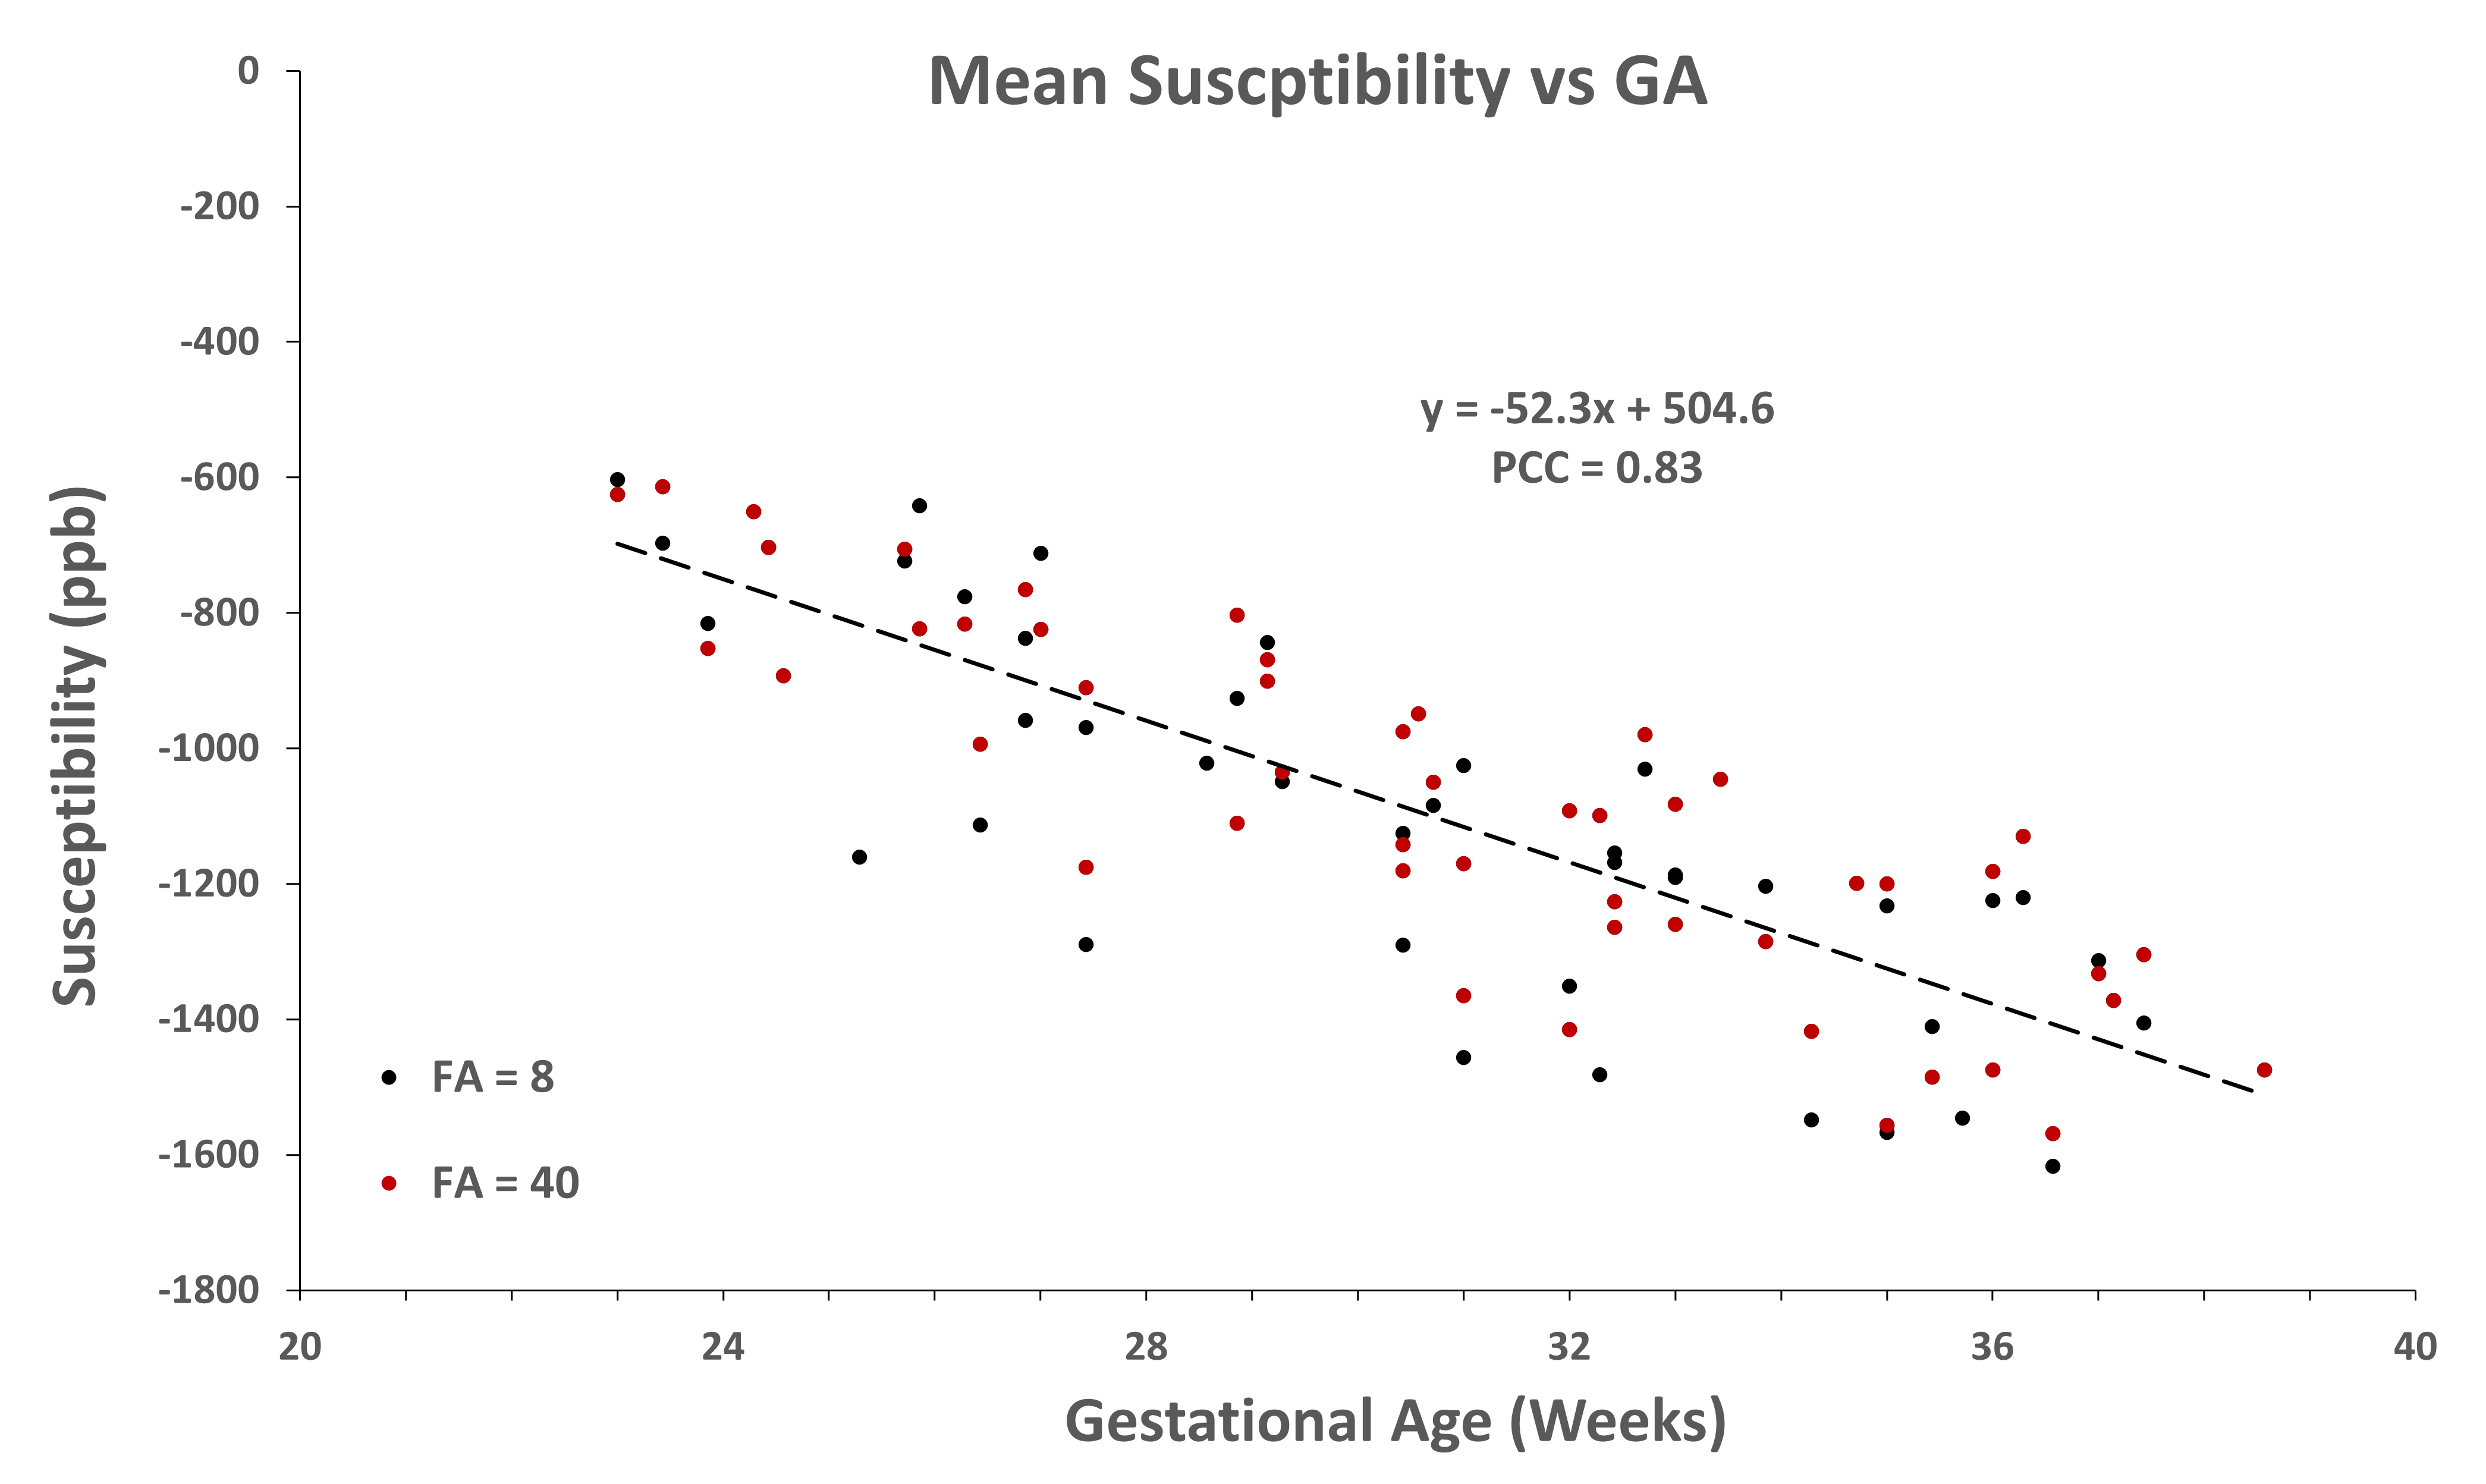
Figure 2. Fetal vertebral calcium deposition is measured by susceptibility as a function of gestation age. A linear regression model was fit to the data that shows a decreasing trend (i.e., increasing calcium content) as a function of GA with a slope of 52.3 ppb per week and a Pearson correlation coefficient of 0.83. (p-values < 0.001 for all regression parameters) Black circles: average vertebral susceptibility values derived from the 8o phase data. Red circles: average vertebral susceptibility values derived from the 40o phase data.
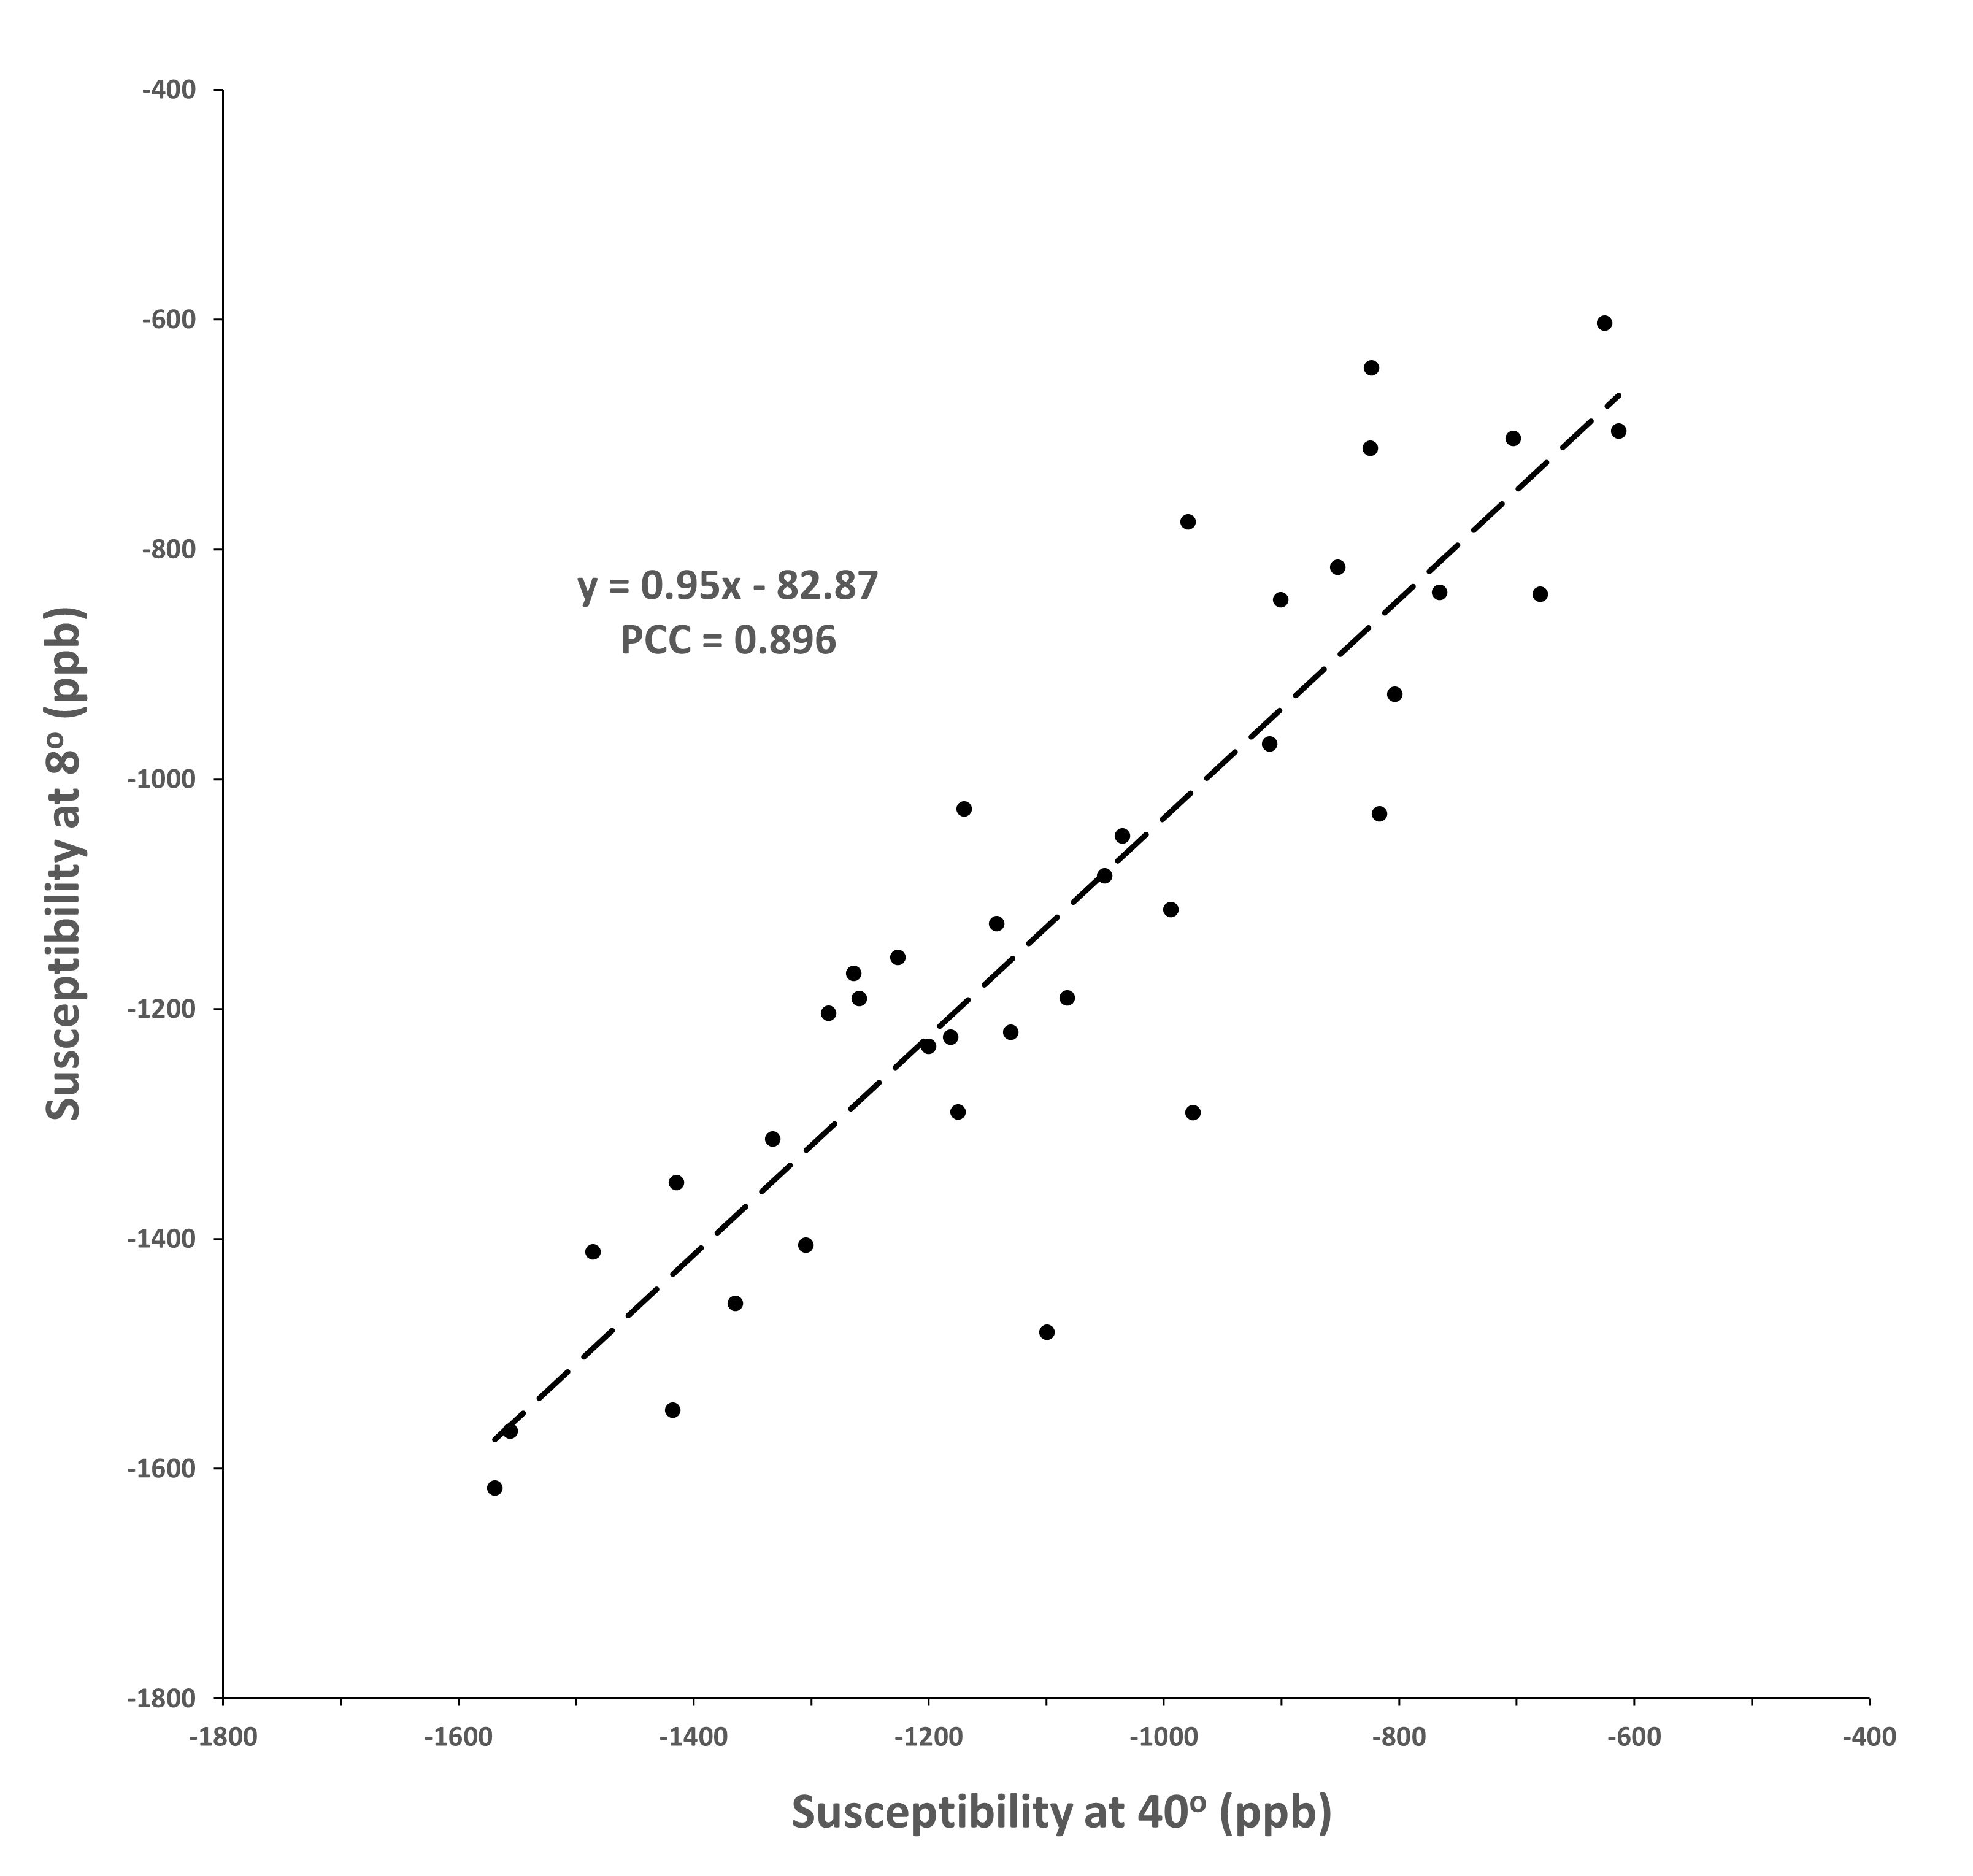
Figure 3. Linear correlation between the average vertebral susceptibility values extracted from the local QSM at FA 8o and 40o STAGE data. The correlation between the individual corresponding average values was fitted by a linear regression model with a slope of 0.95 and a PCC value of 0.90 (p < 0.001).