0728
Automatic Segmentation of Twin Regions in Mo-Di Placentae Based on Geometric Analysis of Spatiotemporal BOLD MRI Signals1Computer Science and Artificial Intelligence Laboratory, Electrical Engineering and Computer Science, Massachusetts Institute of Technology, Cambridge, MA, United States, 2Maternal and Fetal Medicine, Brigham and Women’s Hospital, Harvard Medical School, Boston, MA, United States, 3Fetal-Neonatal Neuroiaging and Developmental Science Center, Boston Children's Hospital, Harvard Medical School, Boston, MA, United States
Synopsis
We propose an automatic segmentation method for delineating functional regions of the placenta responsible for each twin in Mo-Di placentae. The study of differences in MRI biomarkers between identical twins promises to elucidate placental function and fetal development. We combine temporal information from BOLD MRI time series and spatial information from the umbilical cord insertion in a flattened placenta representation. We demonstrate alignment of the automatic segmentation results with expert manual delineations and subsequent agreement of dynamic MRI signals in the identified regions with those derived from expert segmentations. Our method enables automatic localized analysis of the placenta.
Introduction
Blood oxygen level dependent (BOLD) magnetic resonance imaging (MRI) has been suggested as a potential tool to study placental oxygenation1-8. BOLD MRI studies of pregnant women focus on mean whole-organ signal changes, discarding important spatiotemporal variations. Recently, a regional time-to-plateau (TTP) measure3 has been shown to capture placental oxygen transport in discordant monochorionic diamniotic (Mo-Di) twins and demonstrate correlations with placental histologic abnormalities, thus highlighting the importance of localized analysis of placental function. Here we evaluate three strategies for creating voxel profiles for segmentation to identify functional regions responsible for each twin. We evaluate the proposed method and show that the quality of segmentation is significantly better when computed on a flattened representation of the placenta9.Methods
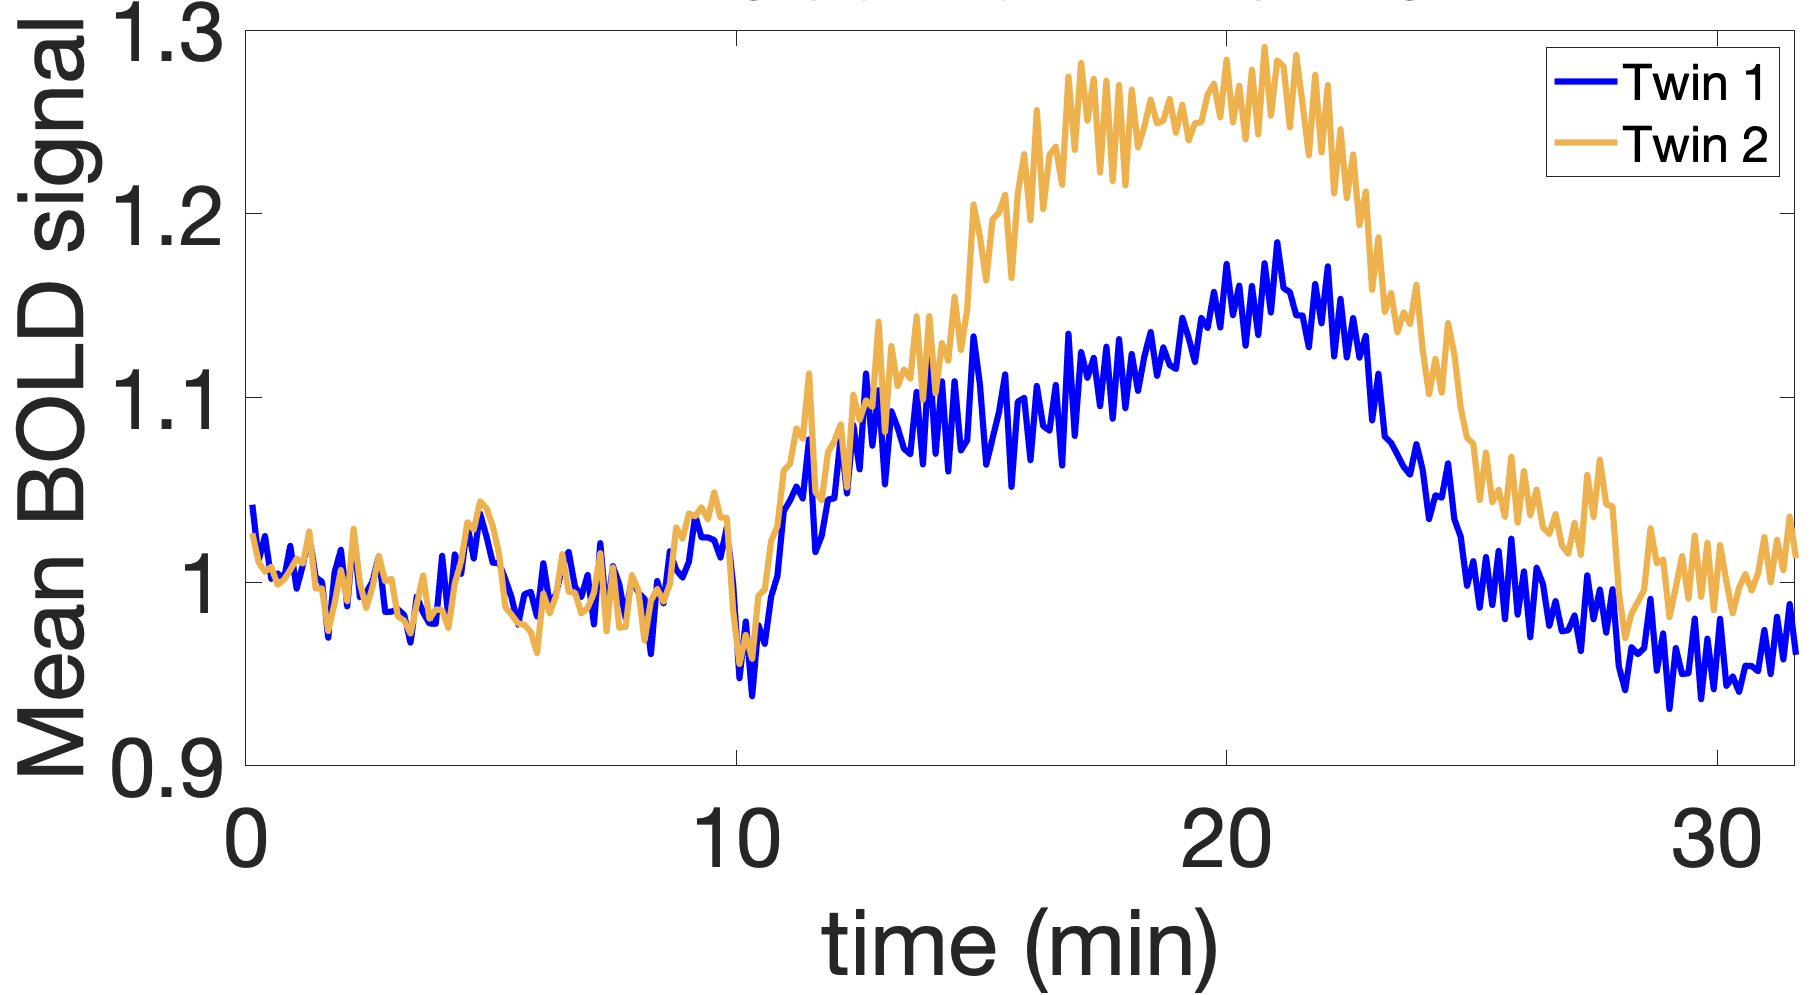
Subjects: In this IRB-approved study, six pairs of Mo-Di twins (gestational age: 28-34 weeks) were enrolled. Four subjects were discordant twin pairs (labeled D1-D4) and two were concordant (labeled C1-C2) based on the birth weight. Data acquisition: MRI BOLD scans were acquired on a 3T Skyra scanner (Siemens Healthcare, Erlangen, Germany) using single-shot gradient echo EPI sequence with isotropic voxels 3 mm3, TR=5.8-8s, TE=32-38ms, FA=90°. Maternal oxygen supply was alternated during the BOLD acquisition via a nonrebreathing facial mask to have three 10 min consecutive episodes: 1. Normoxic (21% O2), 2. Hyperoxic (100% O2, 15L/min), 3. Normoxic (21% O2) (Figure 1).Preprocessing: The placenta and the two cord insertions were manually segmented for one time point and propagated to all other BOLD MRI frames10. The cord insertions were validated by comparing to the pathology reports. The segmented placenta was then flattened9 and the twin regions were manually delineated and confirmed by an expert radiologist. Oxygen TPP maps were obtained by voxelwise gamma function fitting of the BOLD time series3.
Algorithm: We delineate the fetal regions of the placenta by associating each voxel with one of the two cord insertions based on the voxels’ similarity with the reference profile of k-nearest voxels from the small region around the insertion ($$$k=5$$$). We propose three methods for generating voxel profiles from the spatiotemporal BOLD signal: a) time+spatial: a voxel’s profile is the time course concatenated with its spatial coordinates; b) spatial: the distance from the cord insertion is used as the voxel’s feature; c) DM: employ Diffusion Maps11 to capture the underlying manifold of data. Distances in this embedding approximate the diffusion distance in the original domain, thereby capturing clusters and geometrical properties of the data. To include both spatial and temporal information, we build on previous work12-14 and define the graph-adjacency matrix by $$$A_{ij}=exp\left(-\left\Vert v_i-v_j\right\Vert^2/\epsilon\right)$$$ for voxels that are within a neighborhood of radius 5 and $$$A_{ij}=0$$$ otherwise, where $$$v_i$$$ denotes the BOLD time-series for voxel $$$i$$$.
Analysis: We measured agreement between the automatic and manual segmentations by evaluating volume overlap via the Dice Score15, maximum distance between the boundaries via the Hausdorff Distance16, and average distance between the boundaries via the Average Symmetric Surface Distance17 (ASSD).
Results and Discussion
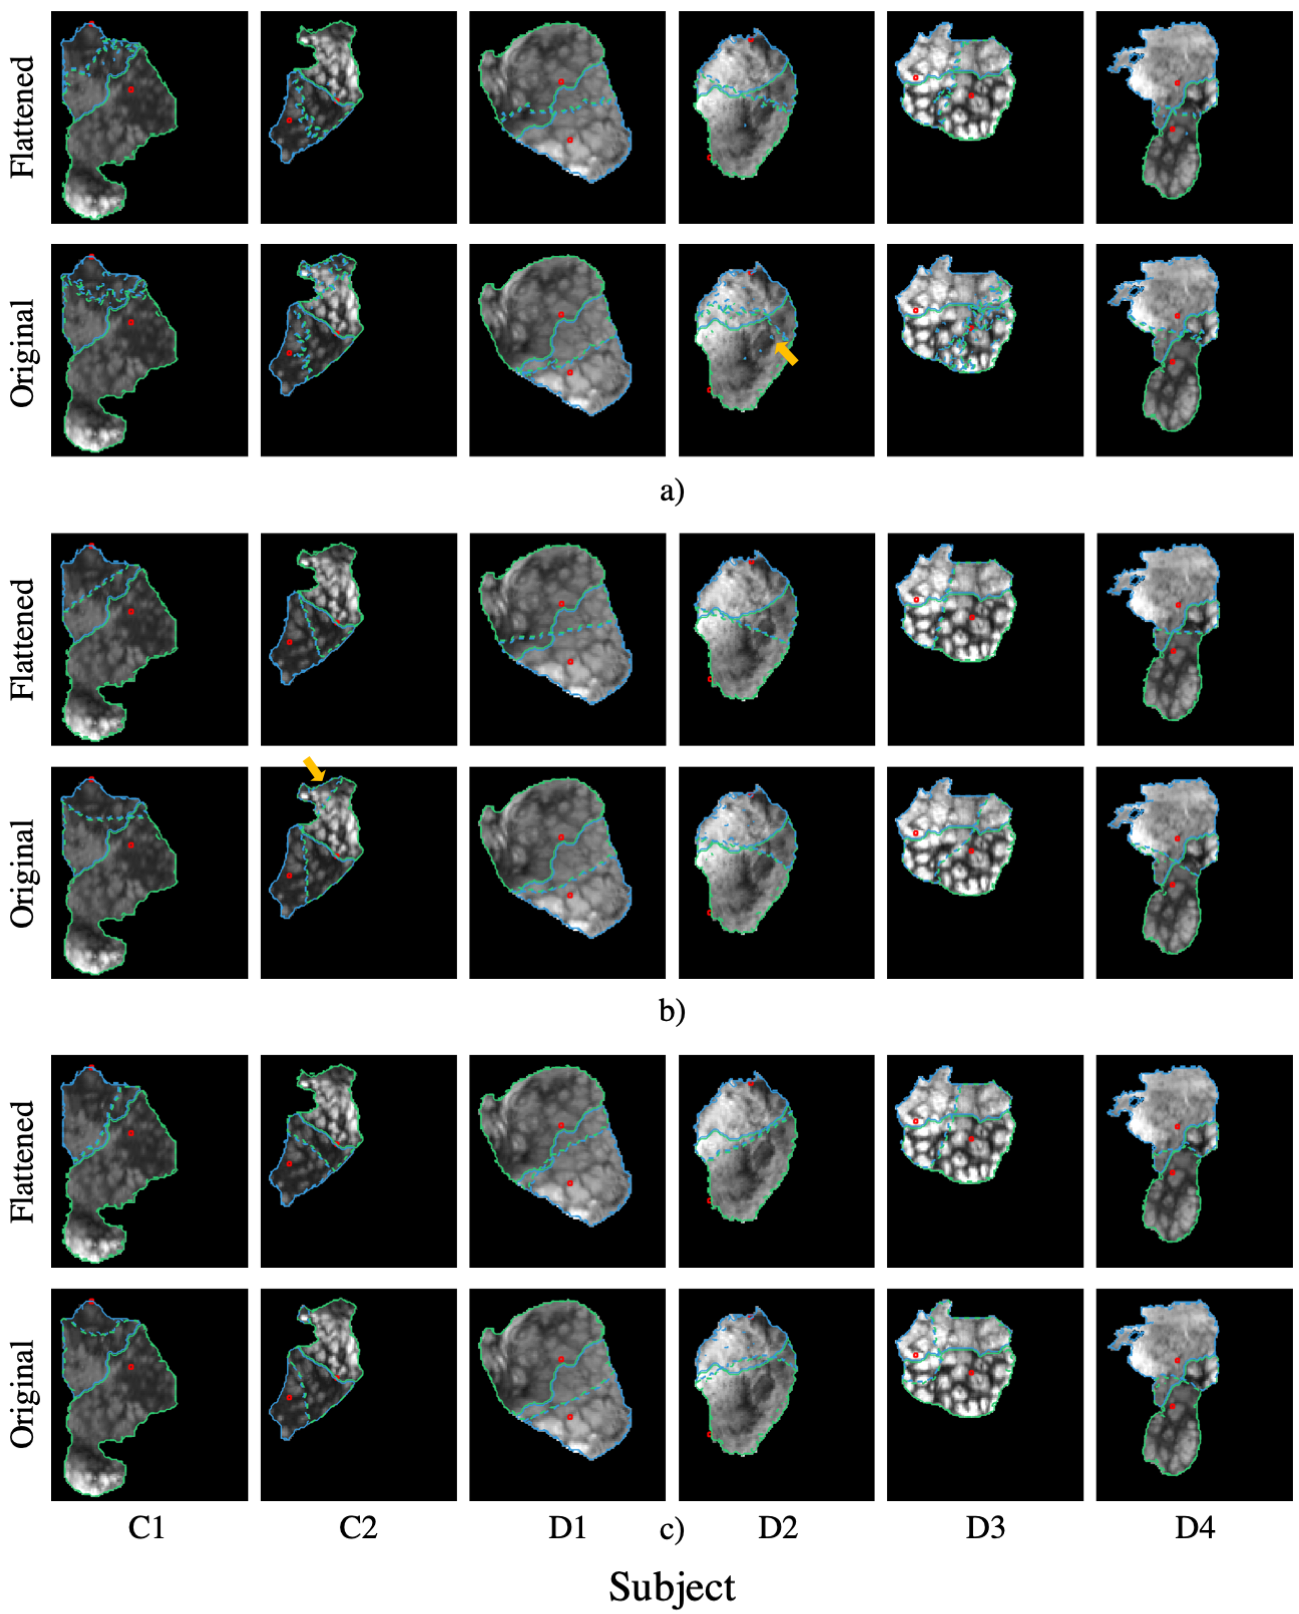
Figure 2 presents segmentation results in the flattened and original domains. Figure 3 shows visualizations of the resultant segmentations for each subject in the flattened and the original domains (after flattening for visualization). These results demonstrate significantly better segmentations in the flattened domain than in the original. We observe high overlap (mean Dice>0.83) and low average error (mean ASSD=7.05mm). Moreover, the segmentation differences of the spatial method between the flattened and original domains indicate that the placenta geometry in the flattened domain provides a strong prior for the segmentation. Additionally, the predictions in the original domain lead to floating islands and discontinuous twin regions (Figure 3).We visually observe from Figure 3 that the spatial and time+spatial methods heavily rely on the cord insertion locations and that the time+spatial method can result in disconnected regions in the flattened domain (e.g. subject C1 and D2). The DM method is less affected by the cord insertion locations, as can be seen by the segmentation boundary location in subjects C1 and D1. More subjects are needed for determining the best method.
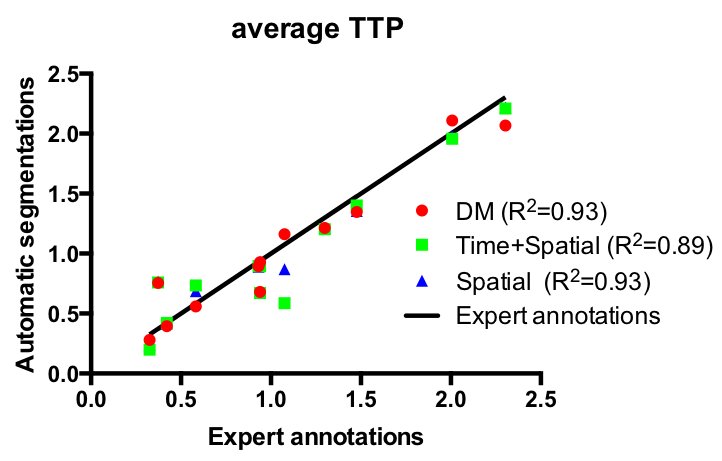
Our results suggest many potential applications. Automatically segmenting twin regions in the flattened space can enable quantitative studies comparing placental response in discordant twins. These segmentations can be used to develop biomarkers for placental health. To demonstrate the use of such possible biomarkers, we evaluate the TTP values of the segmented regions, since significant correlations between TTP and placental histologic abnormalities were demonstrated previously3. We observe no significant difference in TTP estimates across expert annotations and our predicted segmentations as shown in Figure 4, demonstrating that our method can be used for quantifying placental health.
Conclusion
We proposed an automatic method for segmentation of twin regions in the Mo-Di placentae in the flattened space, based on combining temporal signals of the BOLD MRI and spatial information of the umbilical cord insertion. We illustrated a potential clinical application by matching TTP estimates with those based on expert manual delineations. Combining our automatic twin region segmentation with local placental health biomarkers may prove useful in predicting twin pregnancy outcomes.Acknowledgements
This work was supported in part by NIH R01HD100009, U01HD087211, R01EB017337, P41EB015902, NIH NIBIB NACP41EB015902, Wistron Corporation, NSF GRFP, NSERC PGS D, MathWorks Fellowship, Viterbi Fellowship, Technion and the Schmidt Postdoctoral Award for Women.
References
1. Sørensen, A. et al. Changes in human placental oxygenation during maternal hyperoxia estimated by blood oxygen level-dependent magnetic resonance imaging (BOLD MRI). Ultrasound Obstet. Gynecol. 42, 310–314 (2013).2. Sørensen, A. et al. Placental oxygen transport estimated by the hyperoxic placental BOLD MRI response. Physiol Rep 3, (2015).
3. Luo, J. et al. In Vivo Quantification of Placental Insufficiency by BOLD MRI: A Human Study. Sci. Rep. 7, 3713 (2017).
4. Abaci Turk, E. et al. Placental MRI: Developing Accurate Quantitative Measures of Oxygenation. Top. Magn. Reson. Imaging 28, 285 (2019).
5. Pietsch, M. et al. APPLAUSE: Automatic Prediction of PLAcental health via U-net Segmentation and statistical Evaluation. Med. Image Anal. 72, 102145 (2021).
6. Sinding, M. et al. Placental baseline conditions modulate the hyperoxic BOLD-MRI response. Placenta 61, 17–23 (2018).
7. You, W. et al. Hemodynamic Responses of the Placenta and Brain to Maternal Hyperoxia in Fetuses with Congenital Heart Disease by Using Blood Oxygen–Level Dependent MRI. Radiology 294, 141–148 (2020).
8. Hutter, J. et al. Multi‐modal functional MRI to explore placental function over gestation. Magn. Reson. Med. 81, 1191–1204 (2019).
9. Abulnaga, S. M. et al. Placental Flattening via Volumetric Parameterization. Med. Image Comput. Comput. Assist. Interv. 11767, 39–47 (2019).
10. Turk, E. A. et al. Spatiotemporal alignment of in utero BOLD-MRI series. J. Magn. Reson. Imaging 46, 403–412 (2017).
11. Coifman, R. R. & Lafon, S. Diffusion maps. Appl. Comput. Harmon. Anal. 21, 5–30 (2006).
12. Ziyan, U., Tuch, D. & Westin, C.-F. Segmentation of thalamic nuclei from DTI using spectral clustering. Med. Image Comput. Comput. Assist. Interv. 9, 807–814 (2006).
13. Lenglet, C. et al. Mathematical methods for diffusion MRI processing. Neuroimage 45, S111–S122 (2009).
14. Shi, J. & Malik, J. Normalized cuts and image segmentation. IEEE Trans. Pattern Anal. Mach. Intell. 22, 888–905 (2000).
15. Sørenson, T. A Method of Establishing Groups of Equal Amplitude in Plant Sociology Based on Similarity of Species Content and Its Application to Analyses of the Vegetation on Danish Commons. (I kommission hos E. Munksgaard, 1948).
16. Birsan, T. & Tiba, D. One Hundred Years Since the Introduction of the Set Distance by Dimitrie Pompeiu. in System Modeling and Optimization 35–39 (Springer US, 2006).
17. Heimann, T. et al. Comparison and evaluation of methods for liver segmentation from CT datasets. IEEE Trans. Med. Imaging 28, 1251–1265 (2009).
Figures