0727
Quantifying Placental Structure and Function over Gestation with Combined T2*-diffusion MRI1Centre for Medical Image Computing, Department of Computer Science, University College London, London, United Kingdom, 2Centre for the Developing Brain, School of Biomedical Engineering and Imaging Sciences, King's College London, London, United Kingdom, 3Biomedical Engineering Department, School of Biomedical Engineering and Imaging Sciences, King's College London, London, United Kingdom, 4Department of Women and Children's Health, School of Life Course Sciences, King's College London, London, United Kingdom
Synopsis
We quantify placental structure and function over gestation with combined diffusion-relaxometry MRI. We apply a simultaneous T2*-diffusion acquisition protocol to a cohort of 65 pregnant participants, and hence estimate T2* and ADC maps, T2*-ADC spectra, and map T2*-ADC spectrum components with a data-driven technique, InSpect. We show InSpect is more sensitive to placental maturation than separate T2* and ADC mapping alone.
Introduction
MRI can quantify placenta structure and function over gestation and is hence promising for assessing pregnancy complications[1,2]. Multiple MRI parameters are sensitive to placental changes, including those related to pregnancy complications. T2* decreases over gestation and is lower in fetal growth restriction (FGR)[3,4] and preeclampsia(PE)[5]. The apparent diffusion coefficient (ADC) also decreases over gestation and is lower in FGR[6–8]. A limitation of these approaches is that T2* and diffusion properties interact and influence each other. We recently introduced a simultaneous T2*-diffusion technique that can disentangle these distinct MR properties, and shows promise for detecting dysfunctional placentas[9]. Here we apply this sequence to a large cohort of pregnant participants and hence calculate T2* and ADC maps, T2*-ADC spectra, and decompose canonical tissue components and their corresponding mappings with InSpect, a data-driven technique for quantitative MRI. We illustrate the sensitivity of these quantitative measures to normal placental maturation across gestation, and make an initial assessment into the effects of various pregnancy complications on them.Methods
65 pregnant participants were imaged in the supine position on a Philips Achieva 3T scanner. Ethical approval was obtained according to local procedures (REC 19-SS-0032, 14/LO/1169 and 19/LO/0852) and all participants gave informed consent. There were 33 controls, 7 pre-eclampsia, 6 chronic hypertension (CH), and 5 had FGR detected from antenatal ultrasound. 14 participants were lost to follow up, but we include them as “unclear” for completeness. The protocol (see [9] for full details) simultaneously varied diffusion encoding (b=0-1600 mm2/s) and echo time (TE=78,114,150,186 ms) to yield T2*-diffusion contrast.We manually defined an ROI comprising the placenta and adjacent section of uterine wall. We fit a joint T2*-ADC model voxelwise to the whole dataset with modified dmipy code [10]. We calculated the T2*-ADC spectra on the ROI-averaged signal, as in [9]. We also calculated the average of all participants’ spectra within each cohort. Finally, we fitted InSpect[11] – an unsupervised technique that identifies canonical components within quantitative MRI data and estimates spectra (in this case T2*-ADC) and corresponding mappings for each component. We fit InSpect to all participant images simultaneously and specified 7 components, in line with previous work[11]. Finally, we took the mean value of the derived T2*, ADC, and InSpect component fraction maps within the ROI.
Results
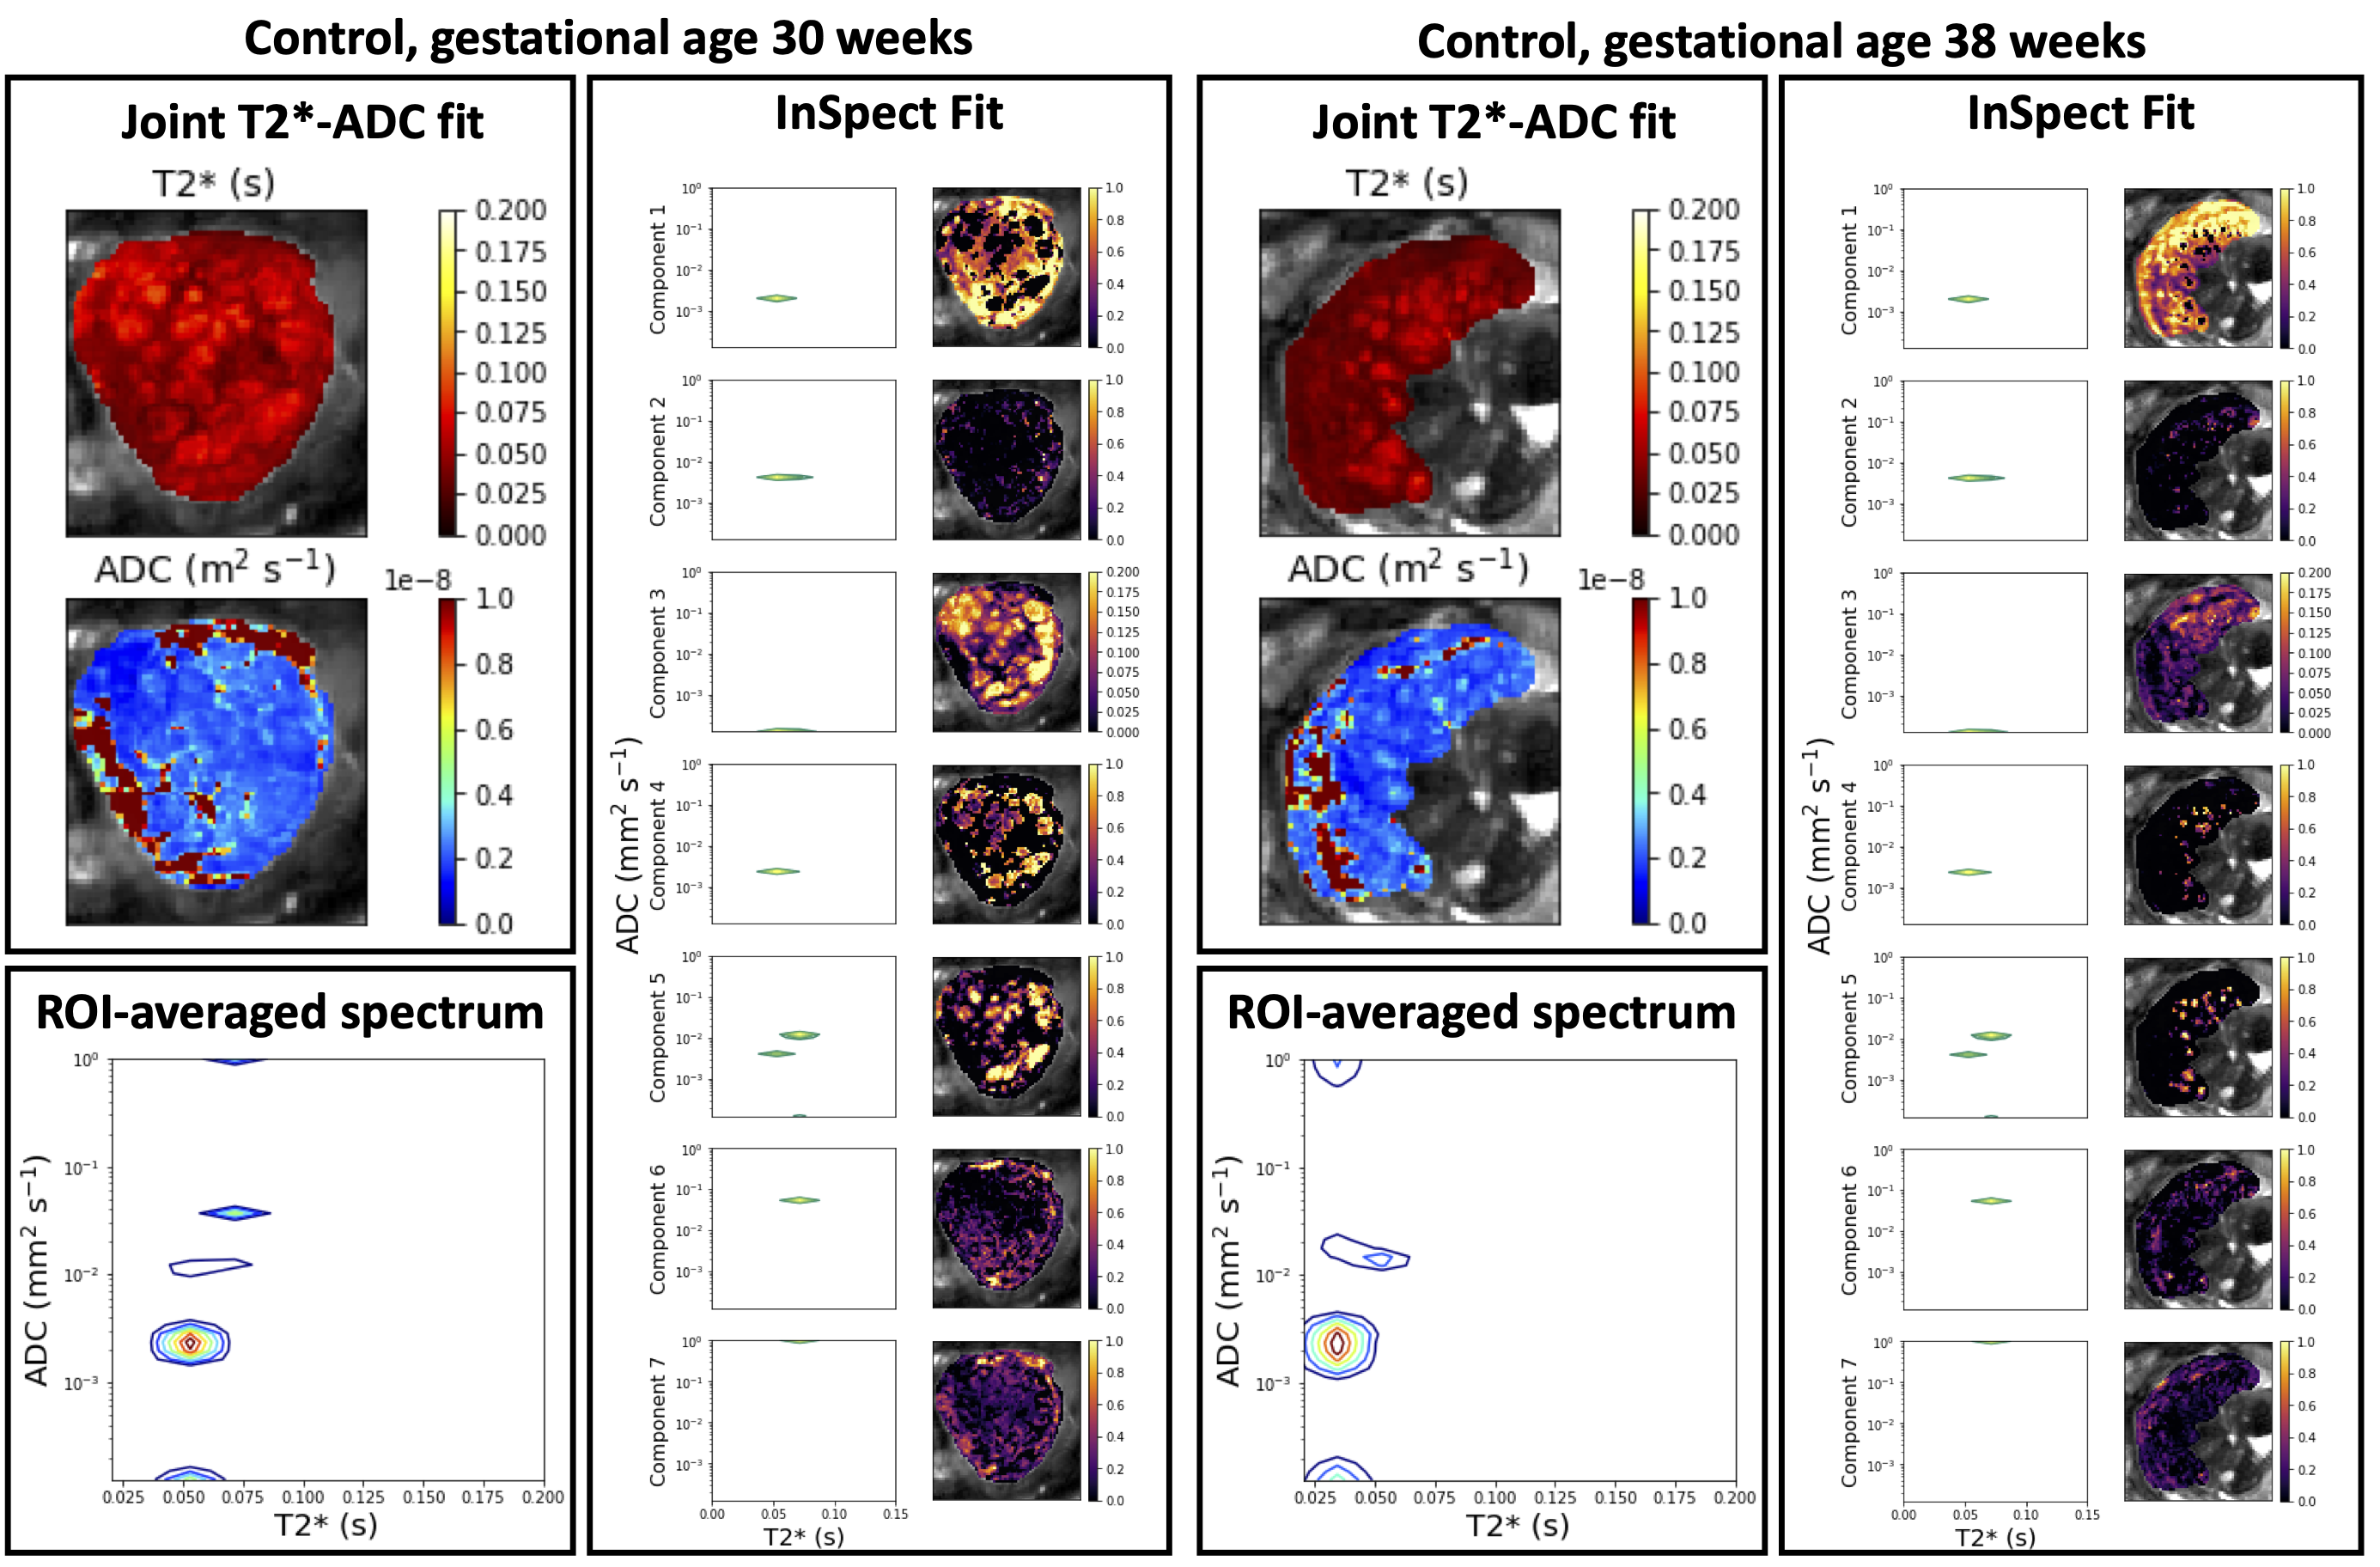
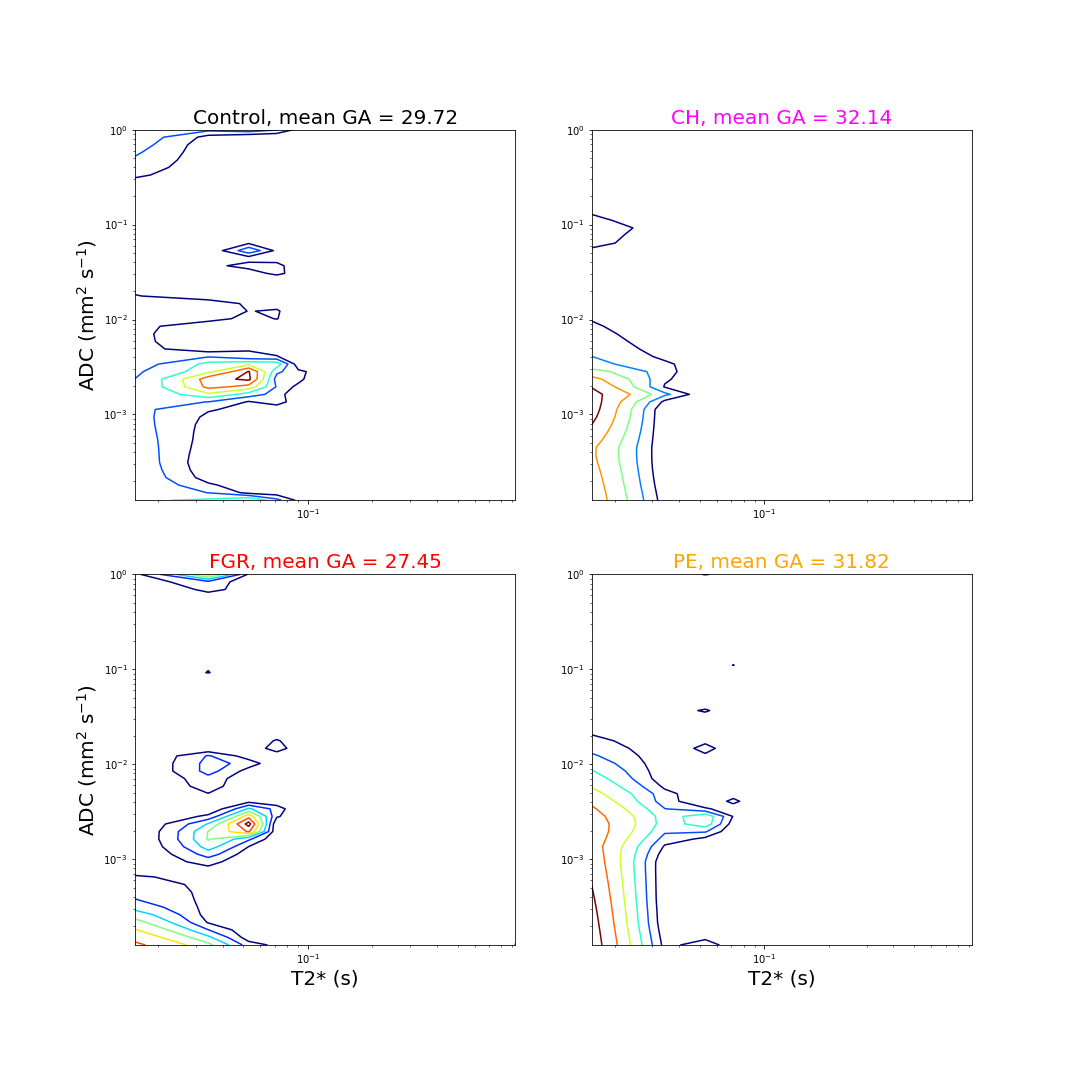
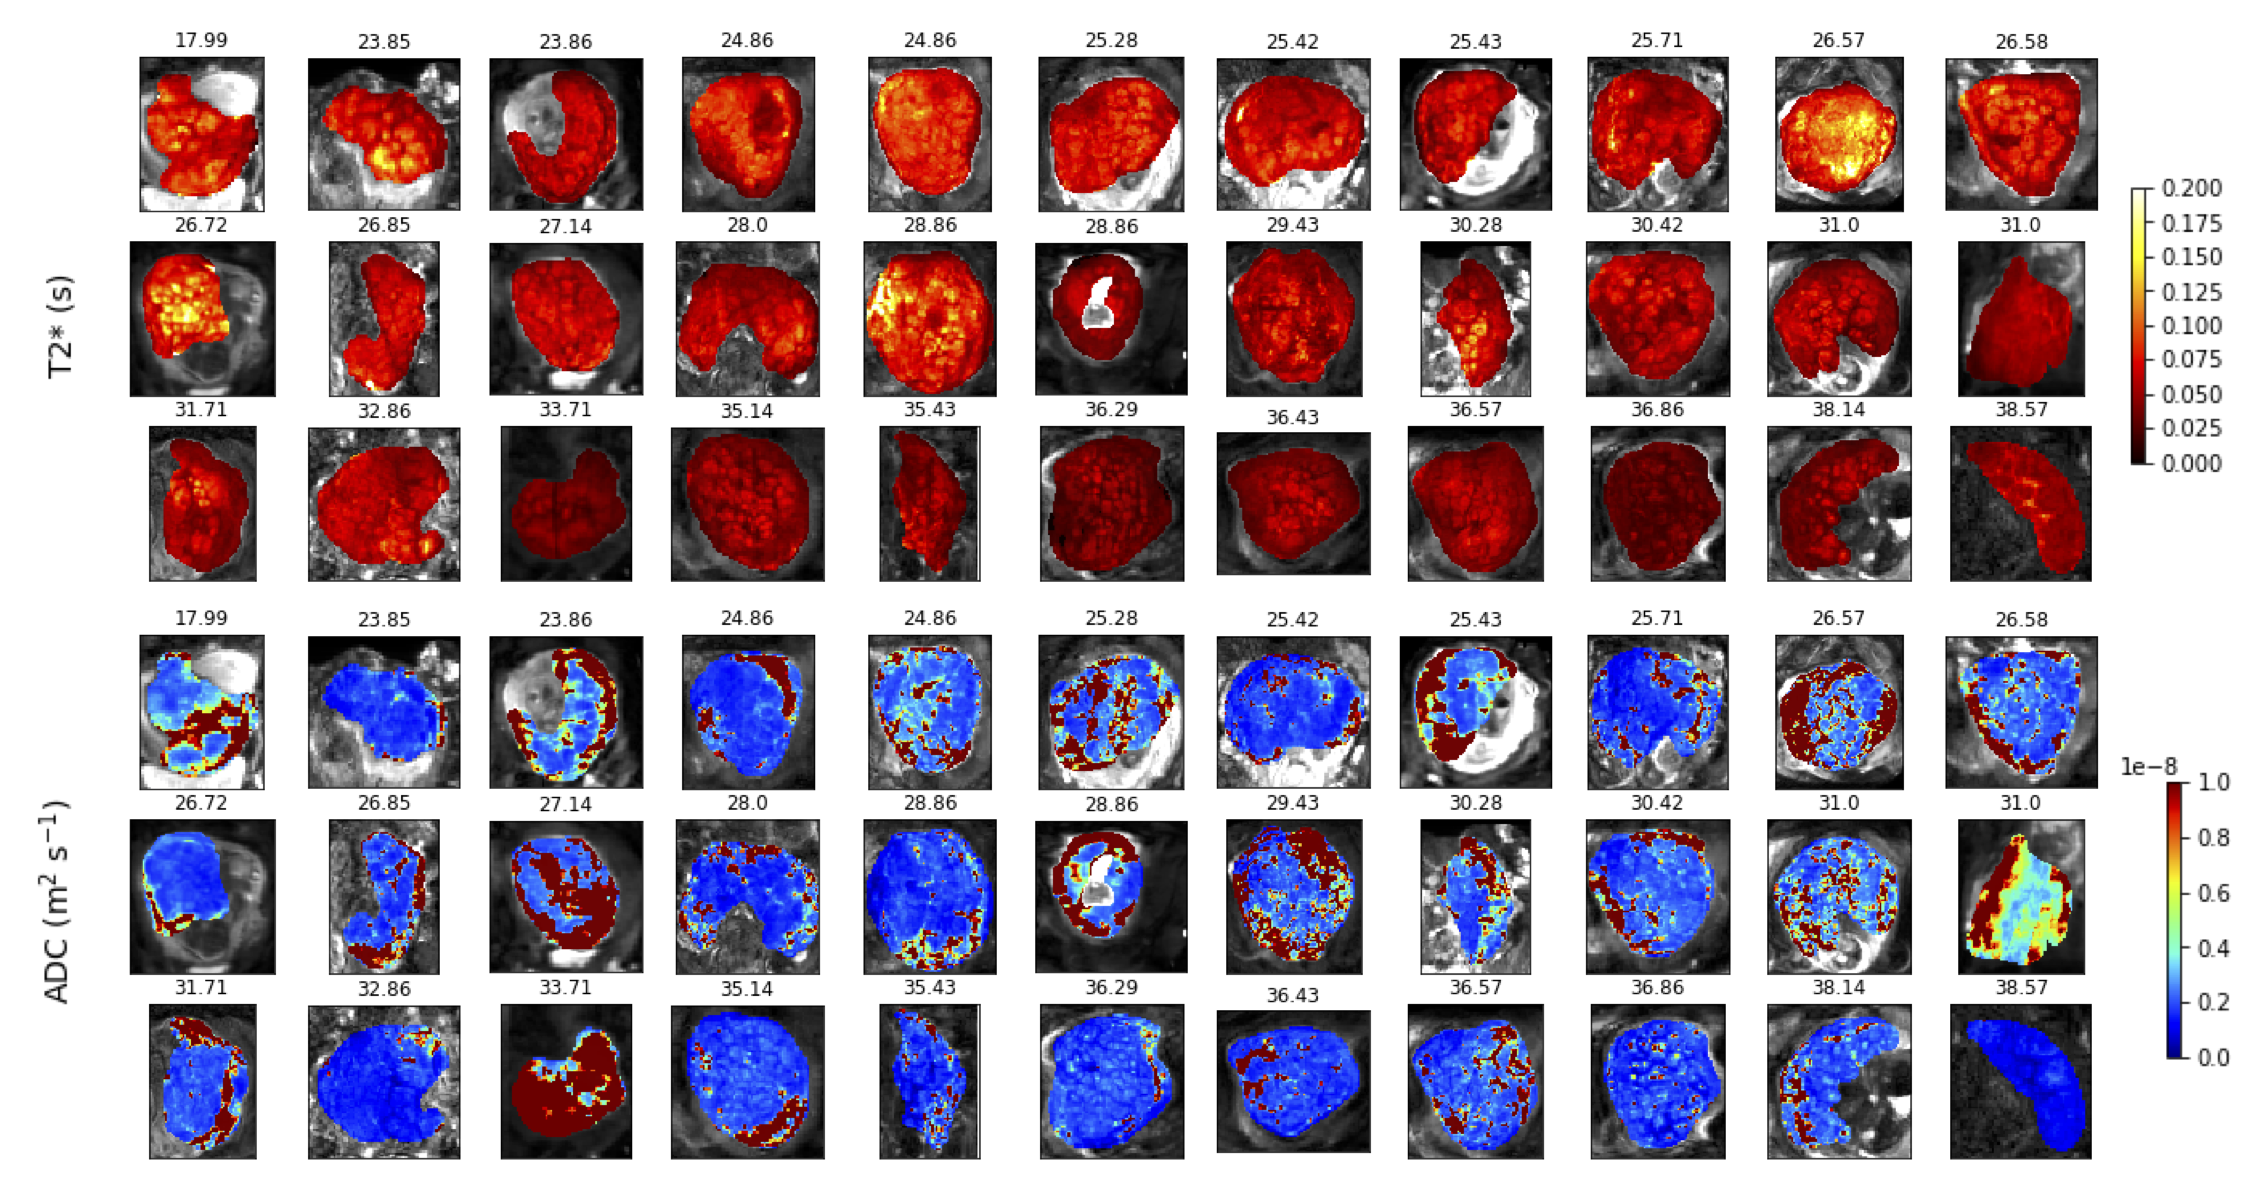
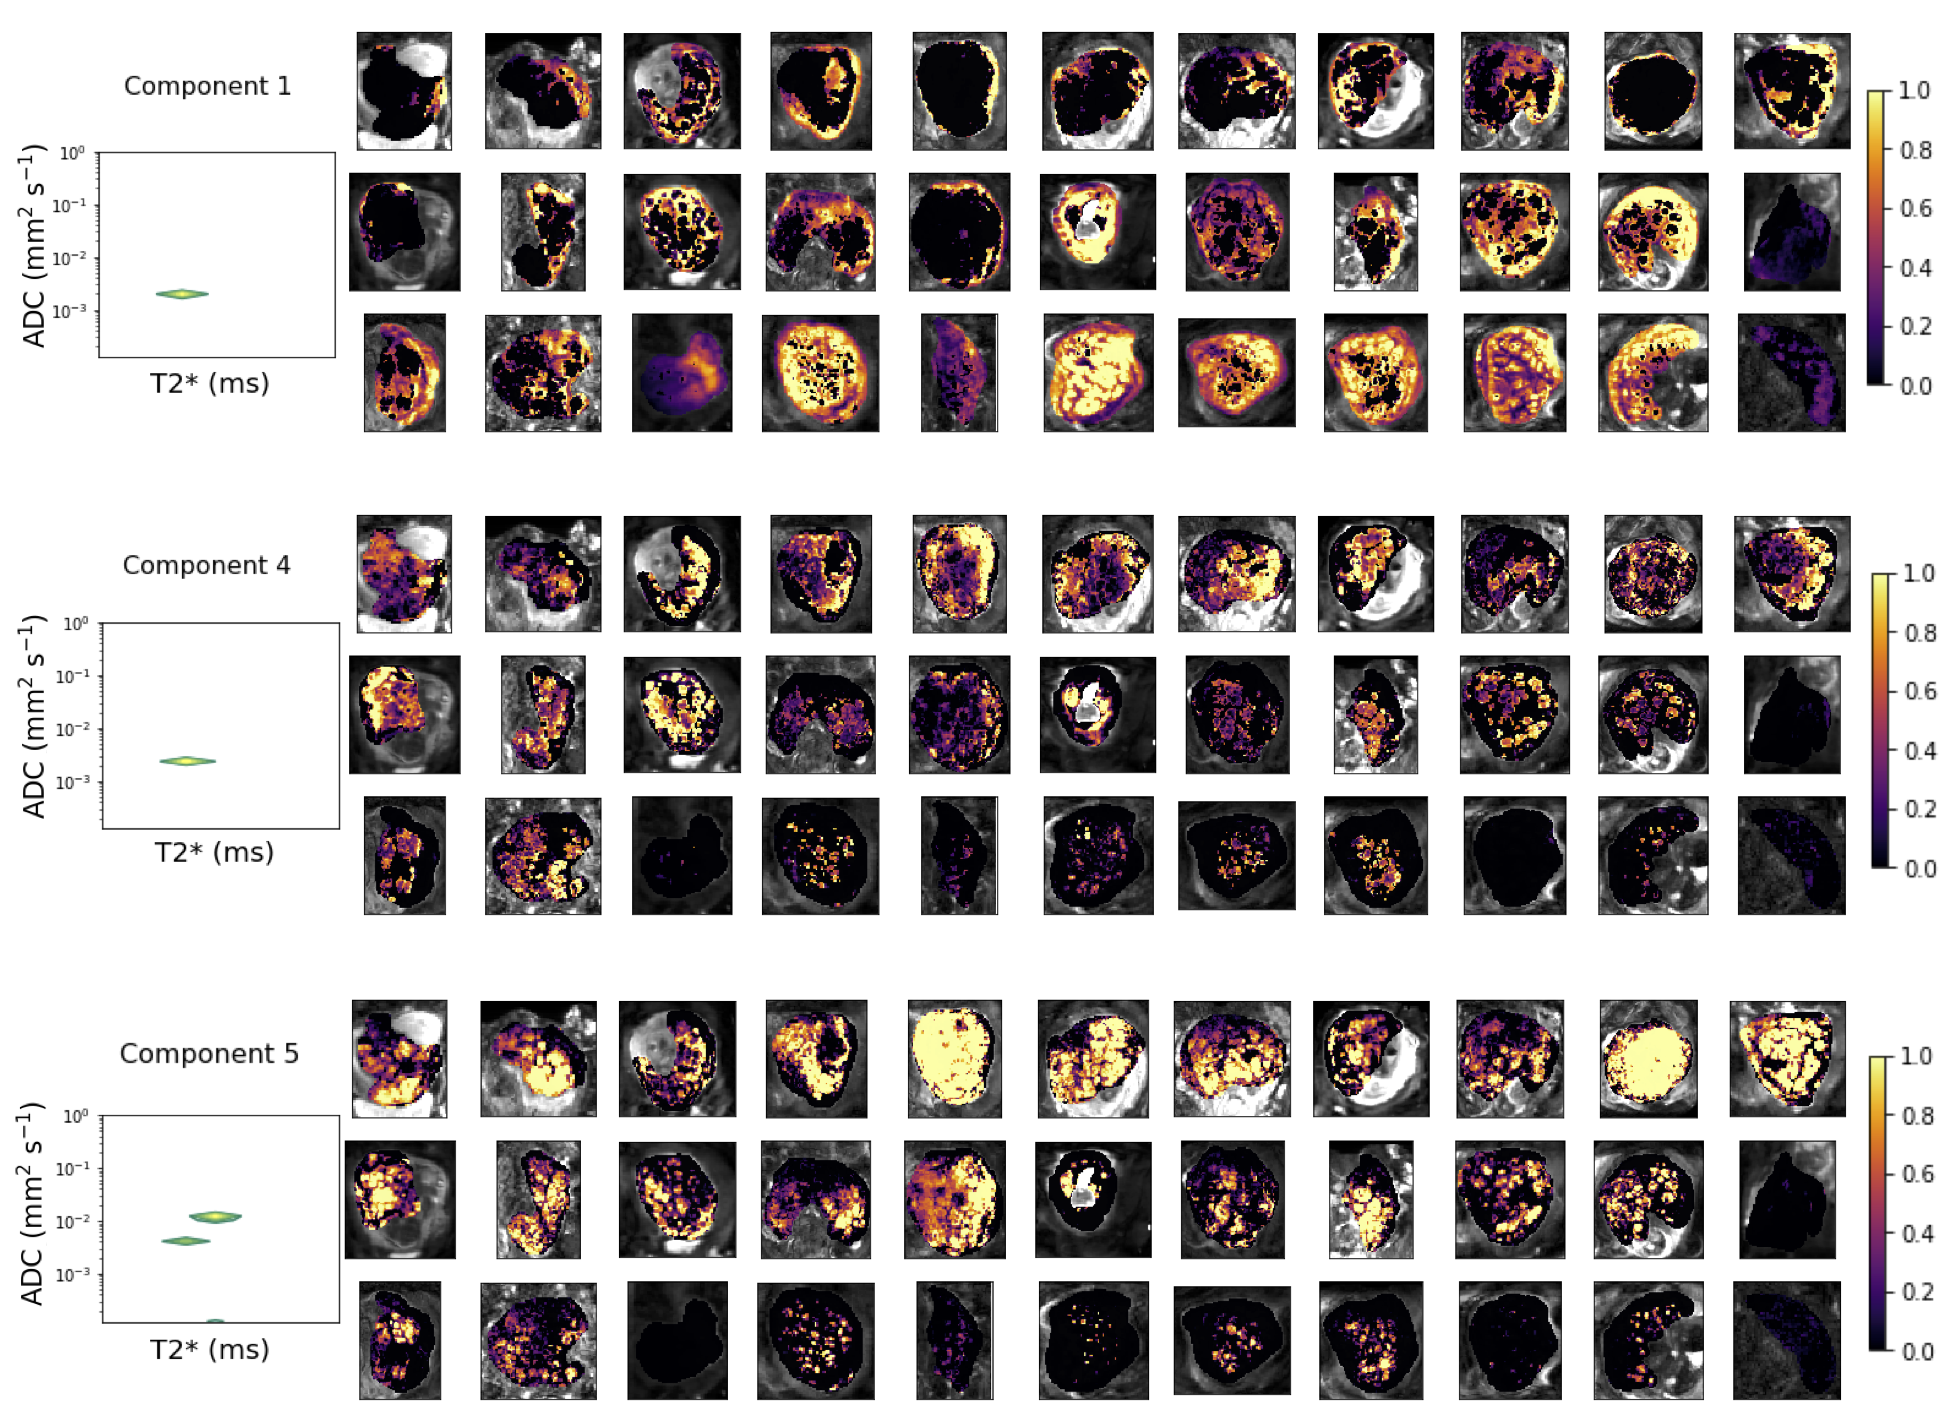
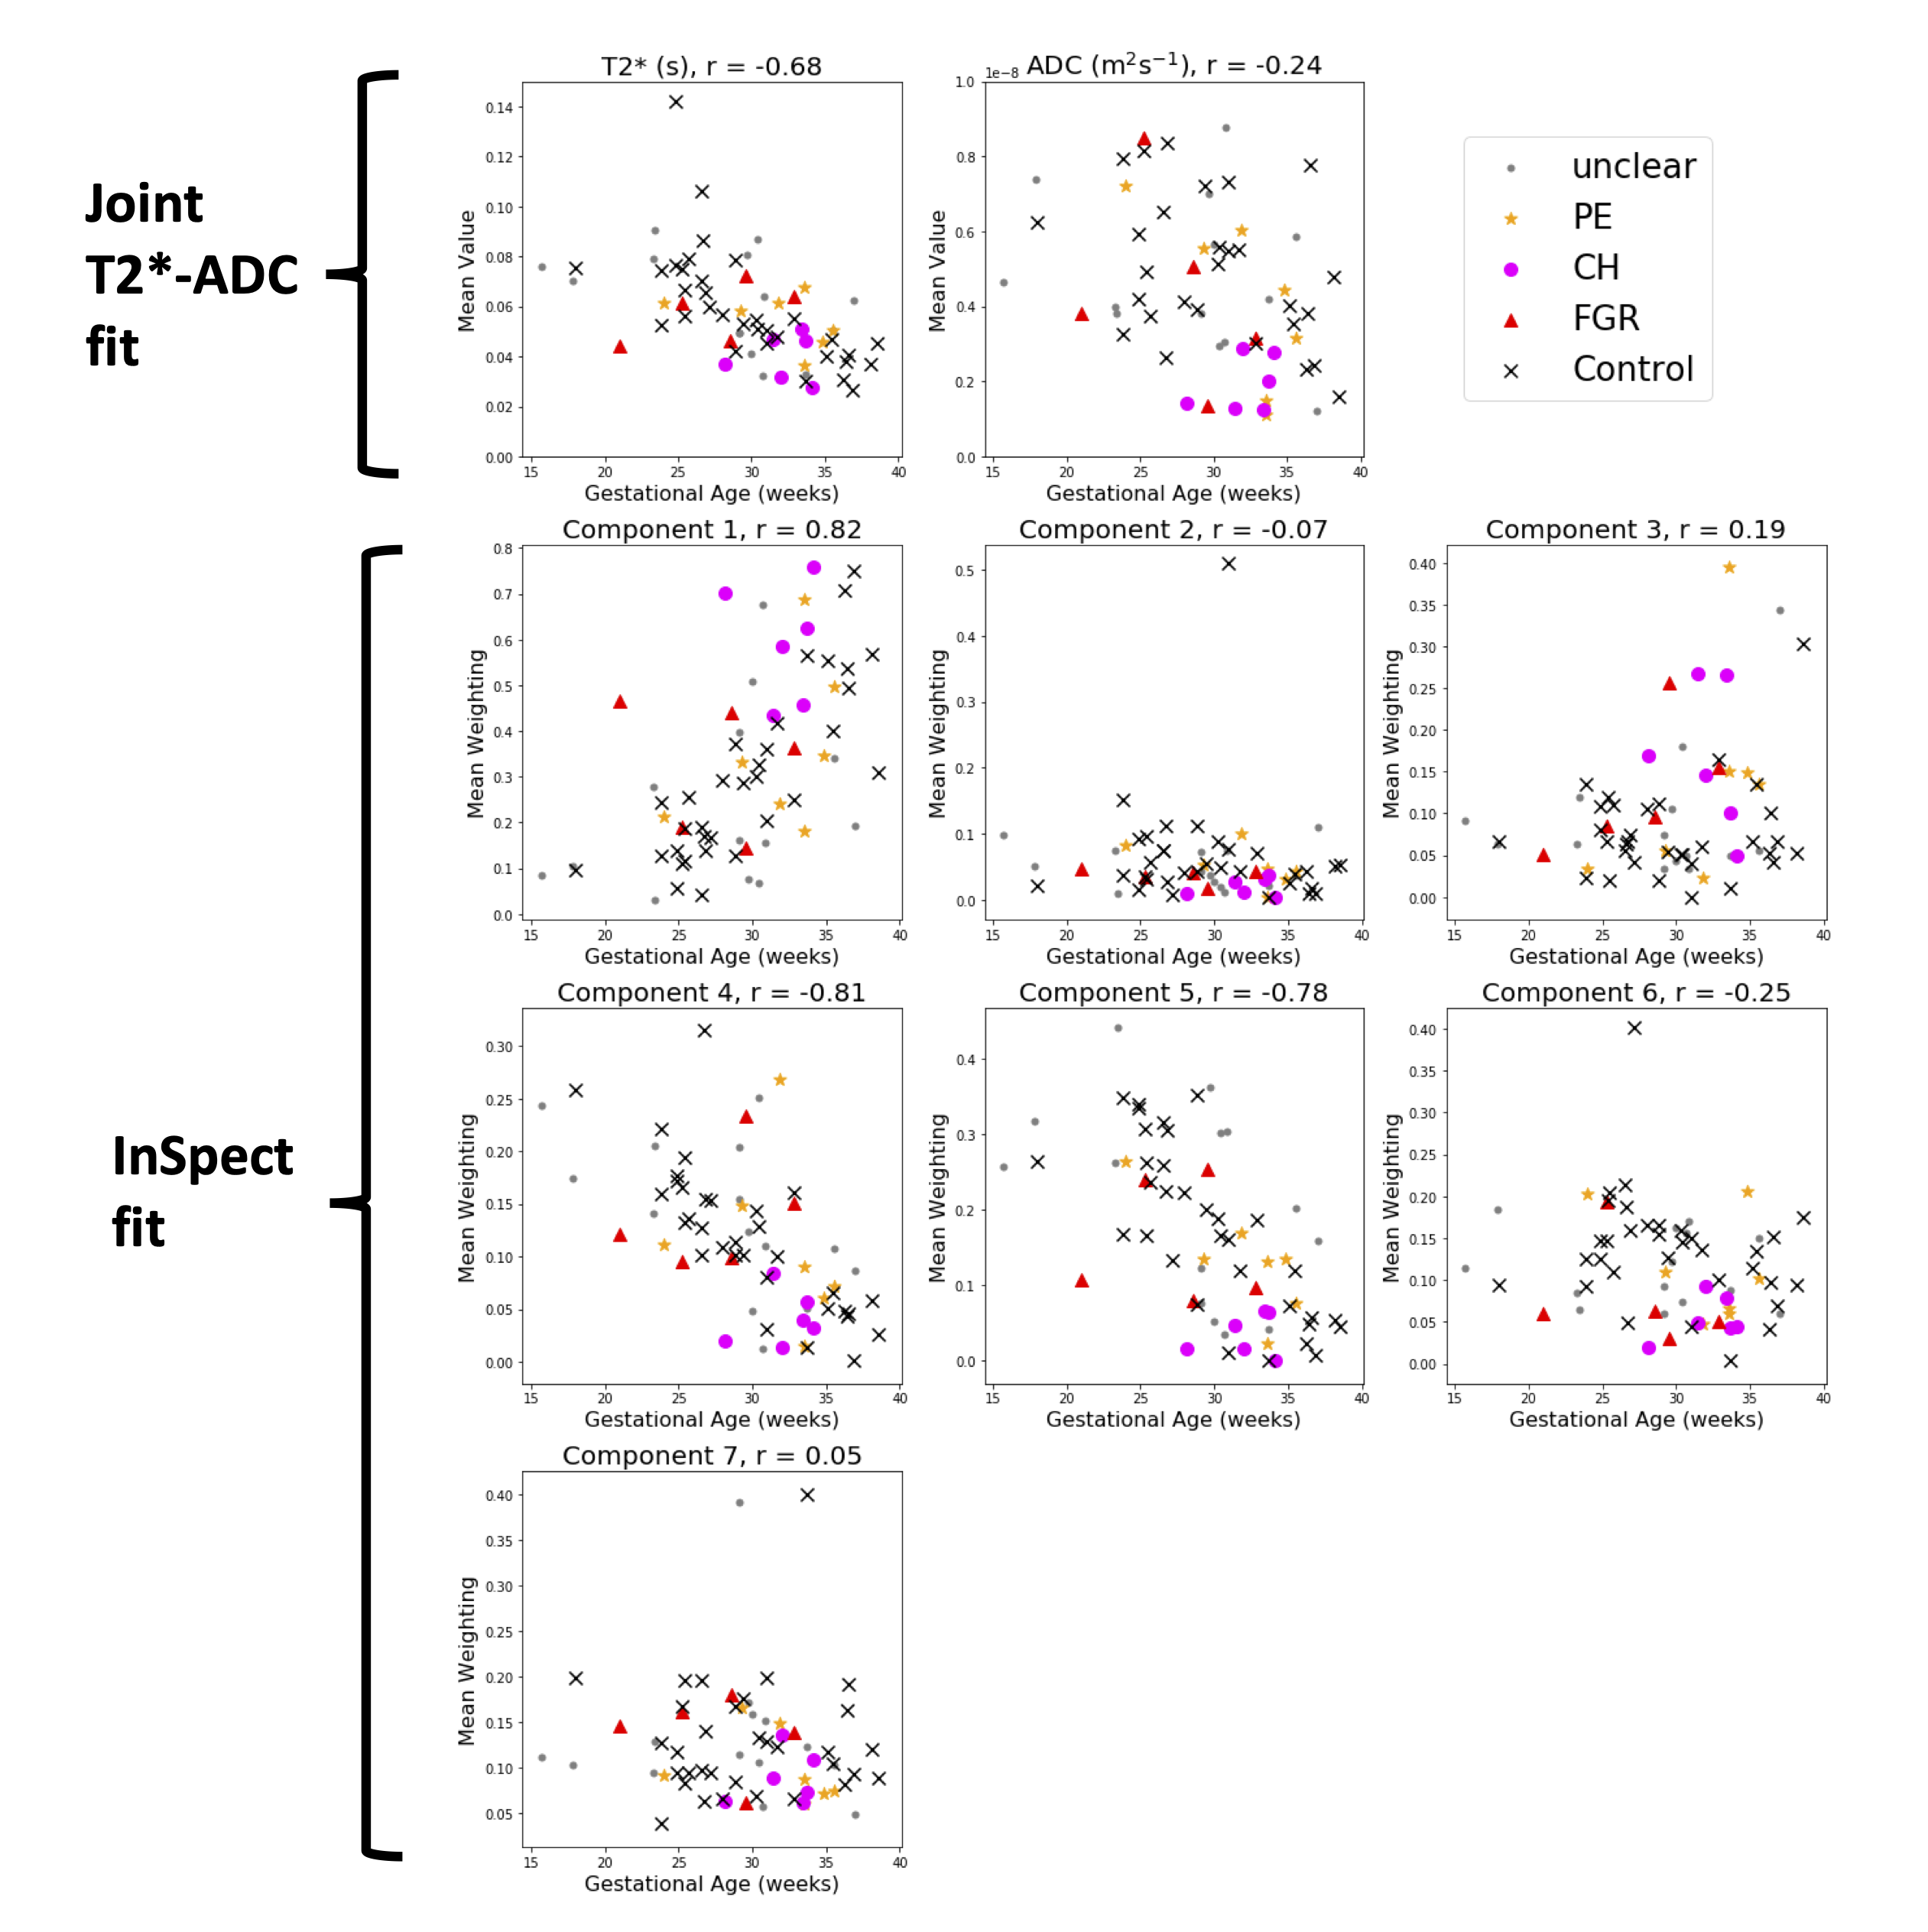
Figure 1 displays all derived maps and spectra for two control participants at different gestational ages. These representative examples demonstrate contrasting features, and visual assessment suggests that differences are clearer in ROI-averaged spectra and InSpect maps than T2* and ADC maps. Figure 2 displays the mean of the ROI-averaged spectra for each cohort, showing the coarse differences in spectra between cohorts. Figures 3 and 4 show the T2*-ADC and InSpect fit maps for all control participants respectively, and Figure 5 plots the mean T2*, ADC, and InSpect component fractions against gestational age. Many derived parameters demonstrate notable trends over gestation, showing their sensitivity to placental maturation. In agreement with previous literature, ADC and T2* both decrease over gestational age (Figures 3 and 5). Conversely, InSpect component 1 strongly rises over gestation (Figures 4 and 5).Discussion
In line with previous work[9], ROI-averaged T2*-diffusion spectra were different across cohorts (Figure 2), although we emphasise that the cohorts are not gestation matched. Future work will develop classifiers that account for gestational age with the aim of predicting the cohort from the mean T2*-ADC spectra.The observation that InSpect component 1 rises over gestation suggests that it reflects a complementary maturation process compared to T2* and ADC. The InSpect spectra (top row in both right-hand panels, Figure 1) and corresponding maps (Figure 4, top) show that component 1 has diffusivity just below free water (2 × 10⁻³ mm2s-1) and is prominent around placental lobules. The rise over gestation potentially reflects the rapid expansion of terminal villi from gestational age 20 weeks onwards[12]. InSpect components 1, 4, and 5 showed the highest Pearson correlation coefficient values with gestational age, suggesting that these capture placental maturation in control cases better than T2* and ADC alone. In line with previous literature[3-8], some parameters show potential sensitivity to pregnancy complications, e.g. CH participants have somewhat higher InSpect component 1 and lower ADC, although further studies with more participants are necessary to fully determine their utility as imaging biomarkers.
Conclusion
We derive a range of quantitative parameters from combined T2*-diffusion placental MRI and present their values across gestational age and in pregnancy complications. We show that the data-driven InSpect approach is more sensitive to placental gestational age and reflects complementary maturation processes compared to T2* and ADC. Future work will focus on how well individual parameters, or combinations thereof, discriminate each pregnancy complication, and develop classification techniques that utilise whole parameter maps and spectra – rather than means – to detect pregnancy complications.Acknowledgements
We thank all mothers, midwives, obstetricians, and radiographers who played a key role in obtaining the datasets. This work was supported by the NIH Human Placenta Project grant 1U01HD087202-01 (Placenta Imaging Project [PiP]); Wellcome Trust (201374/Z/16/Z); EPSRC (EP/M020533/1, EP/V034537/1); UKRI Future Leaders Fellowships (MR/T018119/1); the National Institute for Health Research (NIHR) Biomedical Research Centre at University College London Hospitals NHS Foundation Trust and University College London; NIHR (RP-2014-05-019); by core funding from the Wellcome/EPSRC Centre for Medical Engineering at Kings College London (WT 203148/Z/16/Z) and by the National Institute for Health Research (NIHR) Biomedical Research Centre based at Guy’s and St Thomas’ NHS Foundation Trust and Kings’ College London. The views expressed are those of the authors and not necessarily those of the NHS, the NIHR or the Department of Health.References
1. Andescavage N, Kapse K, Lu YC, Barnett SD, Jacobs M, Gimovsky AC, et al. Normative placental structure in pregnancy using quantitative Magnetic Resonance Imaging. Placenta. Elsevier Ltd; 2021;112: 172–179. doi:10.1016/j.placenta.2021.07.296
2. Hutter J, Slator PJ, Jackson L, Gomes ADS, Ho A, Story L, et al. Multi‐modal functional MRI to explore placental function over gestation. Magn Reson Med. John Wiley & Sons, Ltd; 2019;81: 1191–1204. doi:10.1002/mrm.27447
3. Ingram E, Morris D, Naish J, Myers J, Johnstone E. MR imaging measurements of altered placental oxygenation in pregnancies complicated by fetal growth restriction. Radiology. 2017;285: 953–960. doi:10.1148/radiol.2017162385
4. Sinding M, Peters DA, Frøkjaer JB, Christiansen OB, Petersen A, Uldbjerg N, et al. Placental magnetic resonance imaging T2* measurements in normal pregnancies and in those complicated by fetal growth restriction. Ultrasound Obstet Gynecol. John Wiley & Sons, Ltd; 2016;47: 748–754. doi:10.1002/uog.14917
5. Ho AEP, Hutter J, Jackson LH, Seed PT, McCabe L, Al-Adnani M, et al. T2∗ Placental Magnetic Resonance Imaging in Preterm Preeclampsia: An Observational Cohort Study. Hypertension. 2020;75: 1523–1531. doi:10.1161/HYPERTENSIONAHA.120.14701
6. Song F, Wu W, Qian Z, Zhang G, Cheng Y. Assessment of the Placenta in Intrauterine Growth Restriction by Diffusion-Weighted Imaging and Proton Magnetic Resonance Spectroscopy. Reprod Sci. 2017;24: 575–581. doi:10.1177/1933719116667219
7. Bonel HM, Stolz B, Diedrichsen L, Frei K, Saar B, Tutschek B, et al. Diffusion-weighted MR Imaging of the Placenta in Fetuses with Placental Insufficiency. Radiology. Radiological Society of North America, Inc.; 2010;257: 810–819. doi:10.1148/radiol.10092283
8. Görkem SB, Coşkun A, Eşlik M, Kütük MS, Öztürk A. Diffusion-weighted imaging of placenta in intrauterine growth restriction with worsening doppler US findings. Diagnostic Interv Radiol. 2019;25: 280–284. doi:10.5152/dir.2019.18358
9. Slator PJ, Hutter J, Palombo M, Jackson LH, Ho A, Panagiotaki E, et al. Combined Diffusion-Relaxometry MRI to Identify Dysfunction in the Human Placenta. Magn Reson Med. John Wiley & Sons, Ltd; 2019; 1–22. doi:10.1002/mrm.27733
10. Fick RHJ, Wassermann D, Deriche R. The Dmipy Toolbox: Diffusion MRI Multi-Compartment Modeling and Microstructure Recovery Made Easy. Front Neuroinform. 2019;13: 1–26. doi:10.3389/fninf.2019.00064
11. Slator PJ, Hutter J, Marinescu R V., Palombo M, Jackson LH, Ho A, et al. Data-Driven multi-Contrast spectral microstructure imaging with InSpect: INtegrated SPECTral component estimation and mapping. Med Image Anal. Elsevier B.V.; 2021;71: 102045. doi:10.1016/j.media.2021.102045
12. Jackson MR, Mayhew TM, Boyd PA. Quantitative description of the elaboration and maturation of villi from 10 weeks of gestation to term. Placenta. 1992;13: 357–370. doi:10.1016/0143-4004(92)90060-7
Figures