0726
Maternal Blood Volume Measurements of Human Placenta with Fetal Growth Restriction using Ferumoxytol-Enhanced MRI1Medical Physics, University of Wisconsin - Madison, Madison, WI, United States, 2Biomedical Engineering, University of Wisconsin - Madison, Madison, WI, United States, 3Obstetrics & Gynecology, University of South Florida, Tampa, FL, United States, 4Obstetrics & Gynecology, University of Wisconsin - Madison, Madison, WI, United States, 5Comparative Biosciences, University of Wisconsin - Madison, Madison, WI, United States, 6Wisconsin National Primate Research Center, University of Wisconsin - Madison, Madison, WI, United States, 7Radiology, University of Wisconsin - Madison, Madison, WI, United States
Synopsis
Fetal growth restriction (FGR) has been associated with insufficient development of utero-placental vasculature, which could be identified using maternal placental blood volume measurements. This preliminary study uses ferumoxytol-enhanced MRI to measure placental blood volume of three FGR subjects using variable flip angle T1-mapping. Mean values of maternal fractional, placental, and total blood volumes are reported, as well as changes in placental R1 values between two time points after contrast injection. We observe local placental heterogeneities, including regions with low factional blood volume in the subjects.
Introduction
Placenta-related fetal growth restriction (FGR) is associated with mal-perfusion of the placental tissue, which originates from insufficient development of utero-placental vasculature1. Measurements of maternal placental blood volume could potentially detect local ischemia and poorly developed placental vasculature, thus providing insight on placental health and fetal development. Recently, studies have demonstrated maternal placental blood volume measurements in pregnant mice and rhesus macaques using variable flip angle T1 mapping 2,3. However, to our knowledge, no such studies have been performed in humans, in part due to the lack of suitable contrast agents for pregnant subjects. Ferumoxytol is an iron-based nanoparticle formulation and is FDA-approved to treat anemia and used as such during pregnancy. Ferumoxytol is used in MRI studies as an off-label contrast agent and has been shown to have no detectable risk to the mother or fetus for non-human primates4 and good safety profiles when used for pulmonary angiograms in pregnant patients5. Here we report initial results on the use of ferumoxytol to measure maternal placental fractional blood volumes (mFBV), maternal placental blood volumes (mPBV), and total maternal body blood volume (mTBV) for three third trimester human subjects with FGR.Methods
In this IRB approved study and with FDA-IND in place, three human subjects (maternal age = 34, 35, 41y; weight = 95 kg, 73 kg, 91 kg; GA = 35w2d, 35w0d, 34w2d) diagnosed with fetal growth restriction were imaged after providing informed consent. 255 mg Ferumoxytol (corresponding to 2.7, 3.5, and 2.8 mg/kg respectively) was diluted in 50 ml saline for an intravenous infusion administered over 30 mins followed by subsequent resting period, all with maternal and fetal monitoring in the obstetrics triage unit. MRI data (scan 1) were collected 3-4 hours later. The MRI protocol was repeated (scan 2) 3-5 days later, at which ferumoxytol was assumed to have cleared the placenta based on preclinical data6.MRI scans were acquired on a wide-bore 1.5T MRI scanner (Optima MR 450w, GE Healthcare) with a 48-channel phased-array coil with subjects in supine position. T1 mapping was performed with a respiratory-gated center out, 3D radial, variable flip angle T1-weighted spoiled gradient echo sequence (TR = 4.0 ms, TE = 0.2 ms, imaging volume = 360x360x360 mm3, spatial resolution = 1.41x1.41x1.41 mm3, 4 flip angles = 2°, 6°, 10°, 15°, total scan time = 8 min).
R1 maps were generated for each scan session using pixel-wise complex fitting to SPGR signals through an inhouse toolbox in MATLAB (Mathworks, Natick, MA). Scan 2 was treated as a baseline scan after washout of the Ferumoxytol. Non-rigid registration (ANTs7) was performed between each of the four flip angle scans, as well as scan sessions 1 and 2. Placental segmentations were conducted manually on the heavily T1-weighted 15° flip angle post-contrast images using ITK-SNAP8. In addition, a circular ROI was drawn on a vascular region near the placenta to measure R1 values in blood.
ΔR1 maps were obtained by pixel-wise subtraction of the two R1 maps from scans 1 and 2. mFBV is calculated as the ratio between mean ΔR1 in placenta and mean ΔR1 in blood. mPBV is calculated by multiplying mFBV by the placental volume. Lastly, mTBV is calculated as ratio of Ferumoxytol (in mol) measured over placental tissue over concentration of ferumoxyol (in M) in blood. The relaxivity of ferumoxol used in the calculations is 8.6725s-1mM-1 9.
Results
Figure 1 shows T1-weighted anatomical images used for segmentation, and the R1 maps corresponding to the same slice position. Figure 2 shows 3 slices of contrast-enhanced T1-weighted images for each subject. Table 1 shows mean placental R1 and blood volume measurements for all subjects. Figure 1 shows eight slices in which the FBV map is overlaid on top of the T1-weighted anatomical images of subject #2. Regional heterogeneities of the FBV values can be observed within each slice; for example, the white arrows show regions with low FBV values, which could indicate local mal-perfusion in the placenta. Figure 4 shows histograms of all pixel-wise mFBVs and ΔR1 values in the placenta for each subject. Subject 3 has higher mFBV and higher ΔR1 than the other two subjects.Discussion and Conclusion
This pilot study demonstrates the feasibility of quantitative assessment of human maternal placental blood volumes from maternal contributions using ferumoxytol as a contrast agent. To our knowledge, this is the first study to report such measurements in human subjects. Local analysis of mFBV demonstrated a heterogeneous distribution that includes high blood volume zones (~100% mFBV), which could correspond to inflow vascular regions for placental functional units. Low mFBV zones were also identified to reflect potential pathology. Substantial fetal motion and Braxton-Hicks contractions were observed during some scans, necessitating the need of deformable registration not only between scans but also across different flip angles within the 8 min VFA scan. A limitation of the study is that the contrast infusion outside the bore prohibits the acquisition of a well co-registered pre-contrast baseline R1 map. Future studies of interest include comparisons with normal subjects, regional comparisons with pathology, and imaging across multiple gestation timepoints to assess sensitivity for early detection of placental perfusion abnormalities and related pregnancy complications such as FGR.Acknowledgements
We gratefully acknowledge GE Healthcare for research support of UW-Madison, and funding support from NIH U01-HD087216, NIH R01 HD103443, UW-Madison Dept. of Radiology R&D Fund, and UW-Madison Dept. of Obstetrics and Gynecology R&D Fund. Ferumoxytol for the study was donated by AMAG Corp., MA after NIH funds were awarded.References
[1] Burton GJ, Jauniaux E. Pathophysiology of placental-derived fetal growth restriction. Am J Obstet Gynecol. 2018 Feb;218(2S):S745-S761. doi: 10.1016/j.ajog.2017.11.577. PMID: 29422210.
[2] Badachhape, AA, Devkota, L, Stupin, IV, et al. Nanoparticle Contrast-enhanced T1-Mapping Enables Estimation of Placental Fractional Blood Volume in a Pregnant Mouse Model. Sci Rep 9, 18707 (2019). https://doi.org/10.1038/s41598-019-55019-8.
[3] Chen R, Nguyen S, Murphy ME, Anthony KM, Morgan TK, Corrado P, Fain SB, Magness RR, Shah D, Golos TG, Wieben O, Johnson KM. Longitudinal Placental Blood Volume Measurements on Zika-Infected Rhesus Macaques Using Variable Flip Angle T1 Mapping. In: Proc 29th Annual Meeting ISMRM.;2021
[4] Nguyen SM, Wiepz GJ, Schotzko M, Simmons HA, Mejia A, Ludwig KD, Zhu A, Brunner K, Hernando D, Reeder SB, Wieben O, Johnson K, Shah D, Golos TG. Impact of ferumoxytol magnetic resonance imaging on the rhesus macaque maternal-fetal interface†. Biol Reprod. 2020 Feb 14;102(2):434-444. doi: 10.1093/biolre/ioz181. PMID: 31511859; PMCID: PMC7016288.
[5] Starekova J., Nagle SK, Schiebler ML, Reeder SB, and Meduri VN. Ferumoxytol-Enhanced Pulmonary MRA in Pregnancy: Evaluation of Initial Safety and Image Quality. Proc. Intl. Soc. Mag. Reson. Med. 29 (2021)
[6] Zhu A, Reeder SB, Johnson KM, et al. Quantitative ferumoxytol-enhanced MRI in pregnancy: A feasibility study in the nonhuman primate. Magn Reson Imaging. 2020;65:100-108. doi:10.1016/j.mri.2019.10.006
[7] Brian BA, Nicholas JT, Gang S, et al. A Unified Image Registration Framework for ITK.Proceedings of the Fifth Workshop on Biomedical Image Registration 2012:266-275.
[8] Yushkevich PA, Piven J, Hazlett HC, et al. User-guided 3D active contour segmentation of anatomical structures: Significantly improved efficiency and reliability. Neuroimage. 2006;31(3):1116-1128.
[9] Knobloch G, Colgan T, Wiens CN, Wang X, Schubert T, Hernando D, Sharma SD, Reeder SB. Relaxivity of Ferumoxytol at 1.5 T and 3.0 T. Invest Radiol. 2018 May;53(5):257-263. doi: 10.1097/RLI.0000000000000434. PMID: 29215401; PMCID: PMC6143390.
Figures
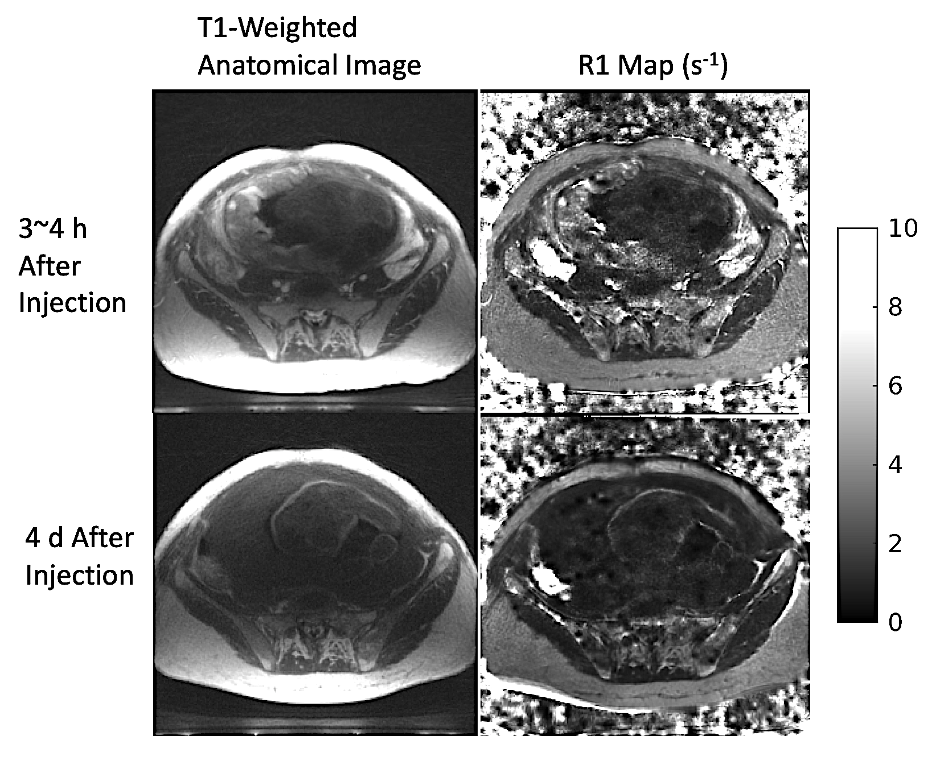
Figure 1. T1-weighted anatomical image (flip angle = 15°) used for segmentation and R1 map for corresponding slice position. Scan 1 (top row; obtained 3~4 h after contrast administration) and scan 2 (bottom row; obtained 4 d after contrast administration) are co-registered to mitigate effects of maternal & fetal motion, as well as subject positioning difference for the two scans. A significant enhancement in placental region is shown in both images of scan 1.
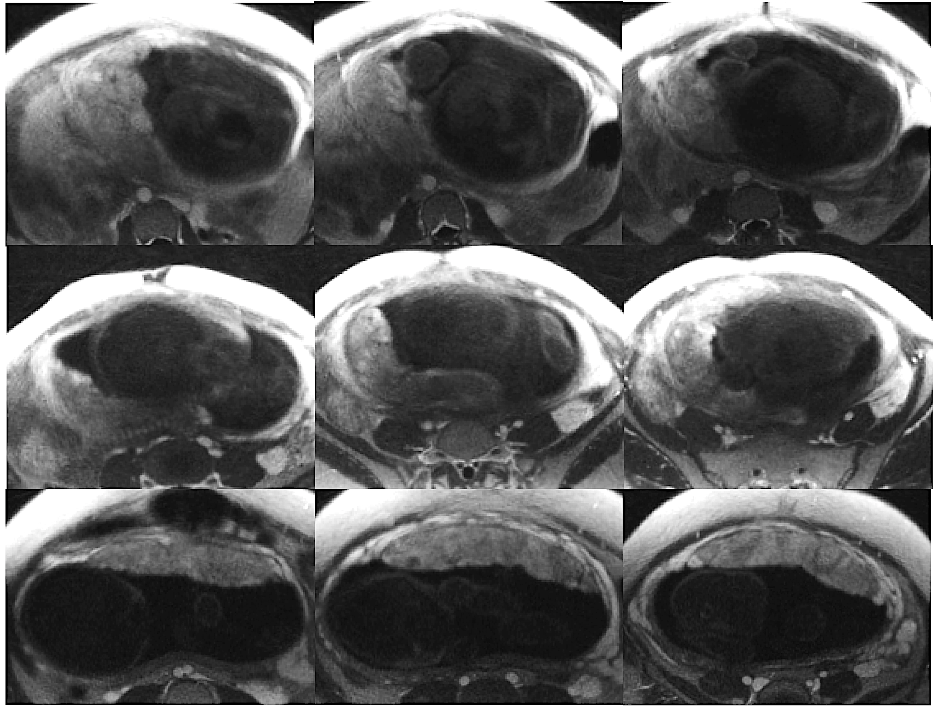
Figure 2. Three non-consecutive slices (left to right) of contrast-enhanced T1-weighted anatomical images (flip angle = 15°) for each subject (top to bottom) used for segmentation. Slice location selected differ for each subject.
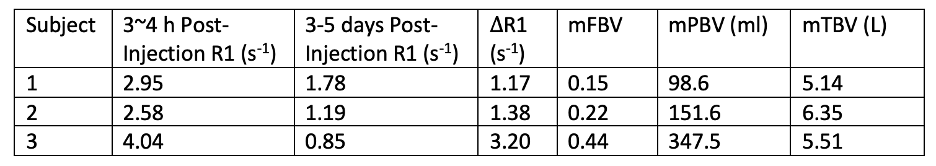
Table 1. Mean values for scans 1 and 2 and maternal blood volume measurements for all three subjects. Maternal fractional blood volume (mFBV) indicates the percent amount of placental volume occupied by maternal blood. Maternal placental blood volume (mPBV) is the total amount of maternal blood (in ml) in placenta.
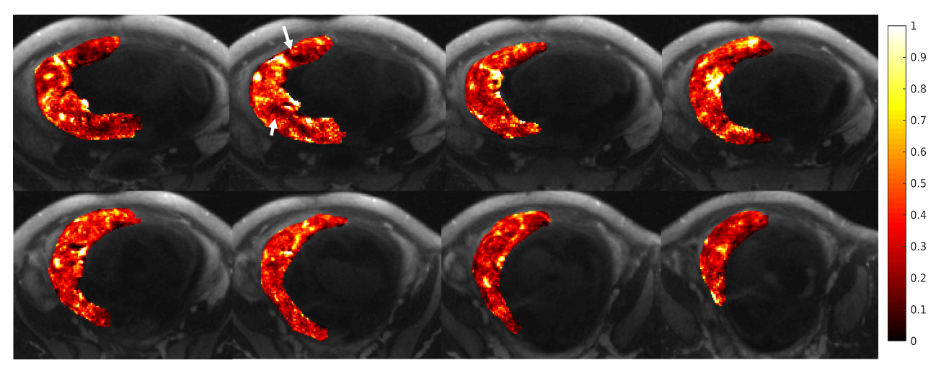
Figure 3. Eight slices (non-consecutive) showing maternal fractional blood volume (mFBV) distribution (heat map) overlaid on top of the T1-weighted anatomical images. mFBV ranges from 0 to 1, with 1 being 100% blood in certain placental regions. mFBV exhibits regional heterogeneity; white arrows indicated regions with low blood volume, which could indicate local placental pathology.
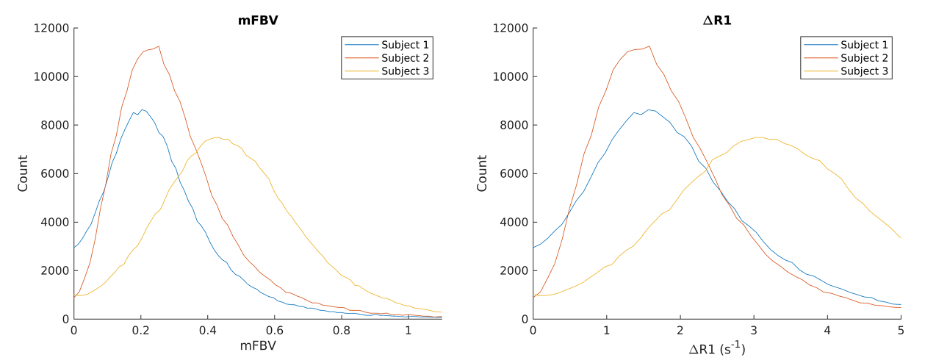
Figure 4. Maternal fractional blood volume (mFBV) and ΔR1 histograms for each subject. Note that the highest mFBV in Figure 2 is larger than 1 because FBV is calculated as each pixel of placental ΔR1 over mean ΔR1 of blood. ΔR1 is calculated as pixel-wise subtraction of the two R1 maps fitted using scan set 1 (3~4 h after contrast injection) and scan set 2 (3~5 d after contrast injection).