0725
Visualizing oxygen transport in real time in the murine placenta at 15.2T
Talia Harris1, Michal Neeman2, and Lucio Frydman3
1Department of Chemical Research Support, Weizmann Institute of Science, Rehovot, Israel, 23Department of Biological Regulation, Weizmann Institute of Science, Rehovot, Israel, 3Department of Chemical and Biological Physics, Weizmann Institute of Science, Rehovot, Israel
1Department of Chemical Research Support, Weizmann Institute of Science, Rehovot, Israel, 23Department of Biological Regulation, Weizmann Institute of Science, Rehovot, Israel, 3Department of Chemical and Biological Physics, Weizmann Institute of Science, Rehovot, Israel
Synopsis
We demonstrate that with the high signal to noise and sensitivity to oxygenation at 15.2 T we can visualize the transport of oxygen across the murine placenta with temporal resolution of 20s. Changes in the R2* of the placenta and embryo heart, observed upon switching from 100% O2 to 10% and switching back to 100% O2, exhibit different dynamic behavior than the maternal blood vessels, specifically a delayed response compared to the maternal blood vessels and a much slower response when switching from 10% O2 to 100% O2.
Introduction
The placenta is an essential organ responsible for transport of oxygen and nutrients to the growing embryo. MRI is a sensitive modality to investigate the transport of oxygen non-invasively as changes in the R2* of tissue and blood vessels correlates with the changes in the concentration of deoxyhemoglobin, with the effect increasing with the square of the field strength. Previous studies have characterized changes in R2* in maternal, fetal and placental tissues under different oxygen concentrations1, however the dynamics of these changes have not been characterized. In this study, we exploited the improved signal-to-noise and sensitivity to changes in deoxyhemoglobin available at 15.2T to characterize the changes in R2* upon switching from hyperoxia to hypoxia and returning to hyperoxia with temporal resolution of ~20s.Methods
Animal experiments were approved by the Weizmann Institute IACUC system. Healthy C57BL/6 J mice were mated with pregnancies timed at E0.5 on the morning following overnight pairing of males and females when a vaginal plug was observed. Animals were imaged in a Bruker Biospec 15.2-T MRI scanner equipped with an Avance IIIHD console, running under Paravision 6 with a 35 mm quadrature 1H volume coil (Bruker Biospin, Ettlingen, Germany). For imaging, mice were anesthetized with isoflurane (1–2%) mixed via a vaporizer with either 100% O2 (hyperoxia) or 10% O2/90% N2 (hypoxia). Respiration and temperature were monitored throughout the measurement (SA-II, Stony Brook, NY). The animals' body temperatures were kept constant at 31±2oC using a water-based heating system. For the dynamic measurements, 20 coronal slices were acquired without respiration triggering with a Gradient Recalled Echo (GRE) sequence with the following parameters: FA=10o, TE=1.6ms, TR=117.65ms, matrix 170x170, in-plane resolution 2 mm x 2 mm, slice thickness 0.4 mm, slice separation 0.4 mm. The total acquisition time for each set of slices was 20 s and the sequence was run continuously while the oxygen levels were being manipulated. ROIs were drawn manually using ImageJ/Fiji and images were analyzed using ImageJ/Fiji and custom written Matlab scripts.Results
Upon switching from 100% O2 to 10% O2 / 90% N2 we observed changes signal intensity in multiple tissues. Low flip angle excitations were used, to reduce the effect of changes in flow or T1, hence from the ratio of the signal intensity at each time point to the signal steady state signal observed under hyperoxia, ΔR2* could be calculated. Based on measurements performed on pregnant mice E14.5-E17.5 (n=5) several common features could be observed. For the maternal arteries and veins, the decrease in R2* when switching from 10% O2 to 100% O2 was much more rapid than the increase in R2* when switching from 100% O2 to 10% O2 (Figure 1). In order to evaluate the transport of oxygen by the placenta, we compared the response of the maternal blood vessels to that of the embryo heart (Figure 1). Comparing the time course of the maternal blood vessels to that of four embryo hearts for a single pregnant mouse (E15.5) several key features can be observed. When switching from 100% O2 to 10% O2 (1) the increase in R2* in the embryo heart is significantly delayed compared to the maternal blood vessels (Figure 1A) (2) after normalizing both the maternal blood vessels and embryo hearts to the steady state ΔR2* at 10% O2, the slope of the increase in R2* is similar. When switching from 10% O2 to 100% O2 (1) the decrease in R2* in the embryo hearts is significantly delayed compared to the maternal blood vessels (2) the rate of decrease of R2* of the embryo hearts is much slower than the maternal blood vessels, and is even slower than what was observed for the increase. In order to gain further insight, we constructed maps to evaluate the ΔR2* at different time points after switching from 10% O2 to 100% O2 (Figure 2). It can be seen that ΔR2* in the kidney rapidly returns to 0, while for the placentae and embryo tissues the process is slower. Furthermore, we can observe heterogeneity in the re-oxygenation process between the different placentae and embryos. Within a given placentae, we can also observe spatial variation in the recovery presumably reflecting the different placental layers. (Figure 2)Conclusions
We have demonstrated a novel method to visualize oxygen transport in the murine placenta in real time at 15.2T. We have shown that there is a clear temporal shift between the changes in R2* observed in maternal blood vessels as compared to the embryo heart, suggesting a role of the placenta in buffering fluctuations in maternal oxygenation. From the sharp contrast between the rapid re-oxygenation of the maternal blood vessels upon switching from hypoxia to hyperoxia as compared to the slower re-oxygenation of the placenta and the embryo it should be possible to develop a kinetic model for this process. We are interested in understanding how these kinetics vary throughout gestation as well as in different disease models. Finally, we would like to investigate how these processes vary in placentae that are exposed to hypoxic conditions during gestation- either due to high altitude or diseases that reduce oxygen saturation.Acknowledgements
No acknowledgement found.References
1. Avni, Reut, et al. "MR imaging–derived oxygen-hemoglobin dissociation curves and fetal-placental oxygen-hemoglobin affinities." Radiology 280.1 (2016): 68-77.Figures
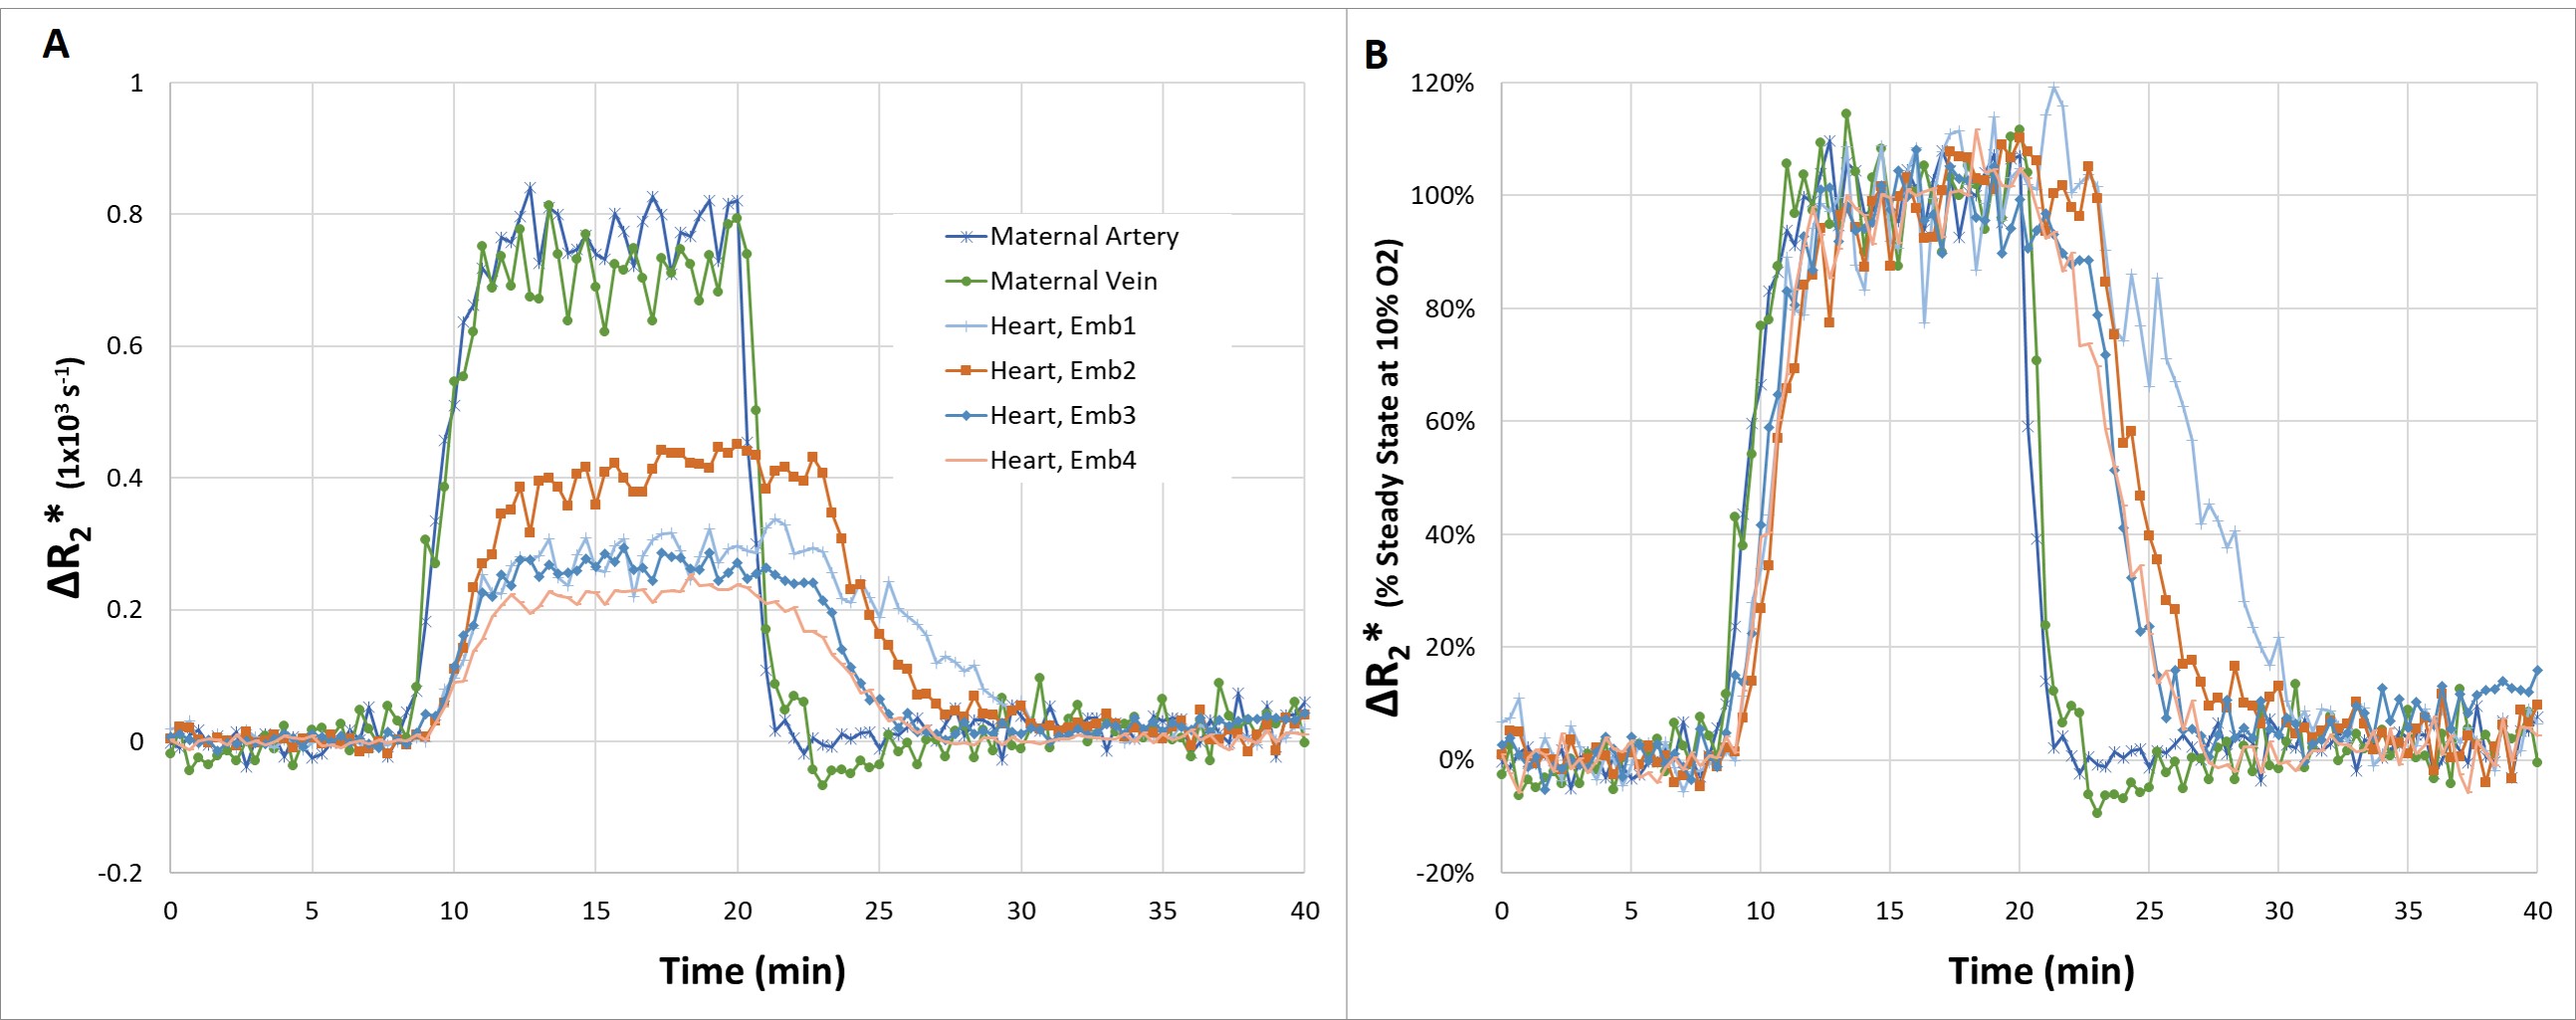
(A) Change in R2* compared to 100% O2 for different tissues in a pregnant mouse (E15.5). ROIs were manually drawn and the change in R2* was calculated from the ratio of the intensity at each time point to the steady state intensity at 100% O2 (B) Change in R2* at each time point normalized by the change in R2* at the steady state intensity at 10% O2

ΔR2* maps calculated for 10% O2 (steady state) and at various time points after switching to 100% O2 breathing gas. ΔR2* was calculated by comparison to the signal intensity at 100% O2 at steady state. The ΔR2* maps were masked so that only pixels exhibiting a more than 30% reduction in signal at 10% O2 compared to 100% O2 were mapped.
DOI: https://doi.org/10.58530/2022/0725