0724
Evaluation of Her-2 gene expression in endometrial carcinoma by APTw and mDIXON-Quant1Department of Radiology, the First Affiliated Hospital of Dalian Medical University, Dalian,China, China, 2Department of Radiology, the First Affiliated Hospital of Dalian Medical University, Dalian, China, 3Philips Healthcare, Beijing, China, Beijing, China
Synopsis
Overexpression in malignant tumors such as ovarian cancer, endometrial carcinoma (EC), etc., can cause abnormal cell proliferation and lead to malignant transformation and is related to tumor angiogenesis and tumor metastasis. This study revealed that amide proton transfer weighted (APTw) and mDIXON-Quant would be useful to evaluate the expression of Her-2 gene in EC.
Introduction
The human epidermal growth factor receptor-2 (Her-2) gene is a proto-oncogene located on the long arm of chromosome 17. The Her-2 gene encodes a transmembrane tyrosine kinase receptor with a molecular weight of 185 kD[1], and promotes tumor cell proliferation by inducing overexpression of cyclin D1 and activating the downstream P13K/AKT pathway [2,3]. Overexpression of Her-2 in malignant tumors such as ovarian cancer, endometrial carcinoma (EC), can cause abnormal cell proliferation and lead to malignant transformation and is related to tumor angiogenesis and tumor metastasis. For Her-2 gene-positive EC patients, the use of targeted drug therapy (such as trastuzumab, lapatinib, etc.) is expected to improve progression-free survival. Therefore, EC Her- 2 Gene expression is of great significance. This study aimed to evaluate the value of multiple quantitative parameters of APTw and mDIXON-Quant technology in evaluating EC Her-2 gene expression, to provide a reasonable reference for the implementation of precise and individualized treatment of EC patients.Method
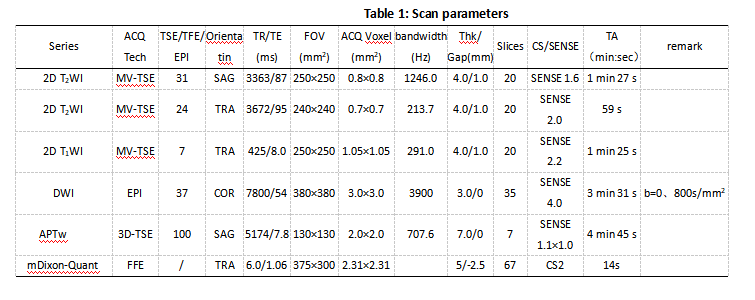
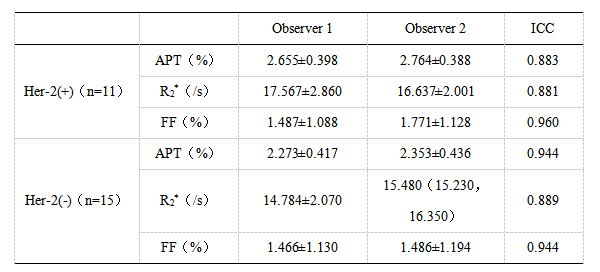
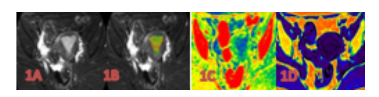
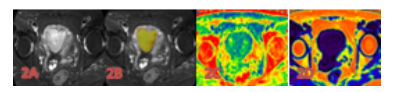
The data of 26 patients with EC confirmed by operation and pathology were retrospectively analyzed, including 11 cases in Her-2 positive group and 15 cases in Her-2 negative group. 3.0 T MR examination was performed before operation. The scanning sequence included APTw and mDIXON-Quant. After scanning, the APT map of APTw sequence and R2* map, fat fraction(FF)map of mDIXON-Quant sequence were obtained by post-processing. The values of APT, R2*, and FF of the two groups were measured by two observers respectively. Intra-class correlation coefficients(ICC)was used to test the consistency of the two observers' measurement results of the parameters of the two groups. The differences of each parameter value of the two groups were compared by using the independent sample t-test or Mann Whitney U test. ROC curve was used to evaluate the efficiency of the parameters with statistical difference evaluating the expression of Her-2 gene in EC. Area Under Curve (AUC), corresponding cut-off value, sensitivity and specificity were calculated.Results
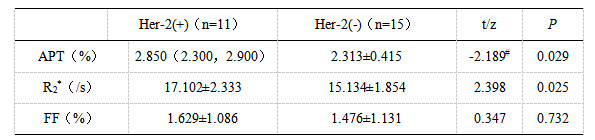
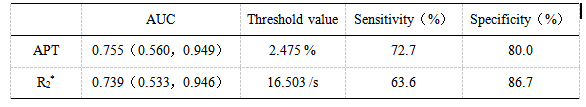
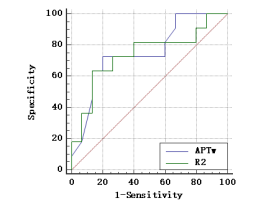
The data measured by two observers were consistent (ICC > 0.75). The values of APT, R2*and FF in the Her-2 positive group were 2.850(2.300, 2.900)%、17.102±2.333 s-1 and 1.629±1.086%, respectively. The above parameters were 2.313±0.415%、15.134±1.854 s-1 and 1.476±1.131% respectively in the Her-2 negative group. The APT, R2* values of Her-2 positive group were significantly higher than those of the Her-2 negative group(P<0.05). There was no significant difference in FF values between the two groups (P>0.05). The AUC of APT, R2* values in evaluating the expression of Her-2 gene in EC were 0.755 and 0.739, the cutoff value were 2.475 % and 16.503 s-1, the sensitivity were 72.7% and 63.6%, the specificity were 80.0% and 86.7%, respectively.Discussion and Conclusion
This study explored the feasibility of quantitative assessment of EC Her-2 gene expression using APTw imaging and mDIXON-Quant. APT value of Her-2 positive group elevated concerning protein and peptide overexpression, blood supply, and denser fibrotic network. The R2* value of Her-2 positive EC is greater than that of Her-2 negative. Because elevated deoxyhemoglobin level in Her-2 positive EC lead the R2* value increase. Previous researchers have reported that the R2* value can quantitatively evaluate the expression of EC proliferation antigen Ki-67 and the instability of microsatellites [6,7], suggesting that the R2* value has important potential value in evaluating EC immunohistochemical indicators before surgery. However, there was no difference in the FF value between the two groups of cases, suggesting that the two groups of cases had similar fat content. In conclusion, the combination of APTw and mDIXON-Quant could provide the differential information of EC cell proliferation caused by the Her-2 gene.Acknowledgements
No.References
[1] Mahzouni P, Movahedipour M. An immunohistochemical study of HER2 expression in meningioma and its correlation with tumor grade. Pathol Res Pract, 2012, 208(4): 221-224.
[2] Chuang TC, Wu K, Lin YY, et al. Dual down-regulation of EGFR and ErbB2 by berberine contributes to suppression of migration and invasion of human ovarian cancer cells. Environ Toxicol, 2021, 36(5): 737-747.
[3] Fang W, Zhao S, Liang Y, et al. Mutation Variants and Co-Mutations as Genomic Modifiers of Response to Afatinib in HER2-Mutant Lung Adenocarcinoma. Oncologist, 2020, 25(3): e545-e554.
[4] Arslan M, Karadag D, Kalyoncu S. Conformational changes in a Vernier zone region: Implications for antibody dual specificity. Proteins, 2020, 88(11): 1447-1457.
[5] Li B, Sun H, Zhang S, et al. Amide proton transfer imaging to evaluate the grading of squamous cell carcinoma of the cervix: A comparative study using 18 F FDG PET. J Magn Reson Imaging, 2019, 50(1): 261-268.
[6] Tian Shifeng, Liu Ailian, Zhu Wen, et al. The correlation between multi-parameter quantitative measurement of enhanced T2* weighted angiography sequence and the expression of endometrial cancer proliferation antigen Ki-67. Chinese Journal of Medical Imaging, 2018, 26(11): 865-869.
[7] Tian Shifeng, Liu Ailian, Chen Lihua, et al. Prediction of microsatellite instability in endometrial cancer with multiple quantitative parameters of magnetic sensitivity sequence. Magnetic Resonance Imaging, 2020, 11(7): 493-496.
Figures