0722
Hippocampal Subfield Property Differences in Amnestic Mild Cognitive Impairment Measured with MR Elastography
Peyton L Delgorio1, Lucy V Hiscox2, Grace McIlvain1, Alexis A Merritt1, Alexa M Diano1, Mary K Kramer1, Kyra E Twohy1, James M Ellison3, Alyssa Lanzi1, Matthew L Cohen1, Christopher R Martens1, and Curtis L Johnson1
1University of Delaware, Newark, DE, United States, 2University of Bath, Bath, United Kingdom, 3ChristianaCare Health System, Newark, DE, United States
1University of Delaware, Newark, DE, United States, 2University of Bath, Bath, United Kingdom, 3ChristianaCare Health System, Newark, DE, United States
Synopsis
The aim of this study was to determine whether magnetic resonance elastography (MRE) could sensitively detect mechanical property alterations in the hippocampal subfields due to amnestic mild cognitive impairment (aMCI) - a prodromal stage of Alzheimer’s disease (AD). Results show that entorhinal cortex viscoelasticity was significantly lower in aMCI participants. Further, the entorhinal cortex did not display significant volume differences due to aMCI, which demonstrates how MRE may yield more information about the health of a region known to harbor AD pathology. These results suggest that hippocampal subfield MRE measures show potential for use as an imaging biomarker of disease.
Introduction
Alzheimer’s disease (AD) is a debilitating neurological condition characterized by memory impairment and cognitive decline due to the progressive accumulation of amyloid plaques and tau protein misfolding, leading to the buildup of neurofibrillary tangles1. The hippocampus (HC) is a site that harbors AD pathology and is affected during the prodromal stages of the disease during which time a diagnosis of amnestic mild cognitive impairment (aMCI) may be given2,3. Prior volumetric studies in aMCI participants have revealed differential volume loss in the hippocampal subfields (HCsf), subregions of the HC, suggesting they may be affected first in the disease4,5. However, gross volumetric measures only minimally reflect tissue microstructural changes in aMCI. Magnetic resonance elastography (MRE) is a sensitive noninvasive neuroimaging technique that can quantify brain tissue viscoelasticity. MRE measures have been shown to be related to the composition and organization of the underling tissue microstructure6 and are affected by both aging and neurodegeneration7,8. The goal of this study was to demonstrate the utility of MRE to detect differences in HCsf viscoelasticity between those with aMCI and in healthy older adults using a reliable, HCsf-specific MRE protocol9.Methods
Seventeen older adults with a diagnosis of aMCI (mean age = 72.3 ± 9.3y, M/F = 5/12) and 51 healthy older adults (OA; mean age = 69.1 ± 5.5y, M/F = 16/35) completed the study. Each participant underwent an MRI session on a Siemens 3T Prisma, which included a 0.9 mm T1-weighted MPRAGE, a 0.4x0.4x2.0 mm3 T2-weighted turbo spin echo (TSE) scan aligned to the hippocampus, and a high-resolution MRE scan using a 3D multiband, multishot spiral MRE sequence with 1.25 mm resolution10. A commercial Resoundant pneumatic actuator was used to generate 50 Hz vibrations. HCsf regions were segmented from the TSE scan using Automated Segmentation of Hippocampal Subfields (ASHS)11 into four regions: dentate gyrus-CA3 (DG-CA3), CA1-CA2, subiculum (SUB), and entorhinal cortex (ERC). All segmentations were then transformed into MRE space using FLIRT in FSL and thresholded to create binary masks12. A nonlinear inversion (NLI) algorithm was used to generate shear stiffness (μ) property maps13 with individual HCsf regions included as spatial priors14. See our recent work for complete protocol details9.Both MRE viscoelastic and volumetric differences between aMCI and OA in the HCsf and whole HC were assessed. To account for subject-specific global differences, both μ and volume measures were normalized to global brain μ and volume, respectively15. We used one-way analysis of covariance (ANCOVA) models, adjusted for age and sex, to examine differences in tissue stiffness between OA and aMCI participants. Separate models were run for HCsf μ and volume as well as whole HC μ and volume measures. Due to high correlations observed between the subfields, separate ANCOVA models were run for each HCsf. For each model, residuals were inspected to determine outliers (1.5x interquartile range) and were removed accordingly. All statistical analyses were performed in SPSS v.17.
Results
Significant group differences were observed in normalized whole HC μ [F(1,64)=6.51, p=0.013, d=0.76], with HC μ being 8.8% lower in aMCI (Figure 1). The HCsf results showed only normalized ERC μ was significantly softer in aMCI with stiffness being 14.3% lower than OA [F(1,62)=13.6, p<0.001, d=1.07]. Normalized CA1-CA2 μ was also 6.5% lower and trended towards significance [F(1,64)=3.62, p=0.062, d=0.62] (Figure 2).There were no significant differences in normalized whole HC volume between groups [F(1,64)=3.32, p=0.073, d=0.62]. Only normalized DG-CA3 volume was significantly smaller in aMCI [F(1,64)=6.58, p=0.013, d=0.85], while the ERC did not display significant volume differences (p>0.05) (Figure 3). Overall, the ERC is significantly softer in aMCI but does not exhibit significant atrophy, as summarized in Figure 4.
Discussion and Conclusion
aMCI participants possessed significantly lower ERC viscoelasticity, an HC subregion that is affected early in AD. These results are consistent with previous studies that have documented lower stiffness in AD across the entire brain16, in the whole HC17, and in specific regions across the temporal and parietal cortices8. Since the ERC is a known site for tauopathy18, we suggest that lower tissue stiffness may reflect tau accumulation in this region. Since aMCI participants are in the early stages of the AD continuum, it is likely that tauopathy has not yet caused a breakdown of the structural composition of tissue19,20, which may explain the lack of differences between groups in ERC volumes. While volume measures signify localized HCsf atrophy, as seen in DG-CA3, which aligns with prior work21, stiffness measures obtained from MRE may provide more information about how AD pathology differentially affects the HCsf tissue microstructure. Additionally, MRE sensitivity is demonstrated when considering the whole HC, which showed significant group differences in stiffness but not in volume. The differential effects observed in stiffness and volumes on the HCsf also suggest alternate pathological mechanisms may be causing tissue degradation, demonstrating the potential for MRE to monitor disease progression. Overall, MRE can be used to assess brain tissue health in participants with aMCI and provide sensitive measures of tissue integrity in regions most affected by the disease. Future work will involve investigating whether MRE measures of the HCsf are useful in predicting conversion from aMCI to AD, identifying potential clinical trial participants, and evaluating response to intervention.Acknowledgements
This project was supported by the National Institutes of Health (R01-AG058853 and K01-AG054731).References
- McKhann G, Drachman D, Folstein M, Katzman R. Clinical diagnosis of Alzheimer’s disease: Report of the NINCDS‐ADRDA Work Group* under the auspices of Department of Health and Human Services Task Force on Alzheimer’s Disease. Neurology. 1984;34(7):939. doi:10.1212/WNL.34.7.939
- Mueller SG, Weiner MW. Selective effect of age, Apo e4, and Alzheimer’s disease on hippocampal subfields. Hippocampus. 2009;19(6):558-564.
- Gauthier S, Reisberg B, Zaudig M, et al. Mild cognitive impairment. Lancet. 2006;367(9518):1262-1270. doi:10.1016/S0140-6736(06)68542-5
- Mueller SG, Schuff N, Yaffe K, Madison C, Miller B, Weiner MW. Hippocampal atrophy patterns in mild cognitive impairment and alzheimer’s disease. Hum Brain Mapp. 2010;31(9):1339-1347. doi:10.1002/hbm.20934
- Du AT, Schuff N, Amend D, et al. Magnetic resonance imaging of the entorhinal cortex and hippocampus in mild cognitive impairment and Alzheimer’s disease. J Neurol Neurosurg Psychiatry. 2001;71(4):441-447. doi:10.1136/jnnp.71.4.441
- Guo J, Bertalan G, Meierhofer D, et al. Brain maturation is associated with increasing tissue stiffness and decreasing tissue fluidity. Acta Biomater. 2019;99:433-442. doi:10.1016/j.actbio.2019.08.036
- Hiscox L V., Johnson CL, McGarry MDJ, et al. High-resolution magnetic resonance elastography reveals differences in subcortical gray matter viscoelasticity between young and healthy older adults. Neurobiol Aging. 2018;65:158-167. doi:10.1016/j.neurobiolaging.2018.01.010
- Hiscox L V, Johnson CL, McGarry MDJ, et al. Mechanical property alterations across the cerebral cortex due to Alzheimer’s disease. Brain Commun. 2020;2(1):fcz049.
- Delgorio PL, Hiscox L V., Daugherty AM, et al. Effect of Aging on the viscoelastic Properties of Hippocampal Subfields Assessed with High-Resolution MR Elastography. Cereb cortex. Published online 2021. doi:10.1093/cercor/bhaa388
- Johnson CL, Holtrop JL, Anderson AT, Sutton BP. Brain MR elastography with multiband excitation and nonlinear motion-induced phase error correction. In: Proceedings of the 24th Annual Meeting of the International Society for Magnetic Resonance in Medicine. ; 2016:1951.
- Yushkevich PA, Pluta JB, Wang H, et al. Automated volumetry and regional thickness analysis of hippocampal subfields and medial temporal cortical structures in mild cognitive impairment. Hum Brain Mapp. 2015;36(1):258-287. doi:10.1002/hbm.22627
- Jenkinson M, Beckmann CF, Behrens TEJ, Woolrich MW, Smith SM. Fsl. Neuroimage. 2012;62(2):782-790.
- McGarry MDJ, Van Houten EEW, Johnson CL, et al. Multiresolution MR elastography using nonlinear inversion. Med Phys. 2012;39(10):6388-6396. doi:10.1118/1.4754649
- McGarry M, Johnson CL, Sutton BP, et al. Including spatial information in nonlinear inversion MR elastography using soft prior regularization. IEEE Trans Med Imaging. 2013;32(10):1901-1909.
- Murphy MC, John Huston III KJG, Manduca A, et al. Preoperative assessment of meningioma stiffness by magnetic resonance elastography. J Neurosurg. 2013;118(3):643. doi:10.3171/2012.9.JNS12519.
- Murphy MC, Huston III J, Jack Jr CR, et al. Decreased brain stiffness in Alzheimer’s disease determined by magnetic resonance elastography. J Magn Reson imaging. 2011;34(3):494-498.
- Gerischer LM, Fehlner A, Köbe T, et al. Combining viscoelasticity, diffusivity and volume of the hippocampus for the diagnosis of Alzheimer’s disease based on magnetic resonance imaging. NeuroImage Clin. 2018;18(December 2017):485-493. doi:10.1016/j.nicl.2017.12.023
- Maass A, Lockhart SN, Harrison TM, et al. Entorhinal tau pathology, episodic memory decline, and neurodegeneration in aging. J Neurosci. 2018;38(3):530-543. doi:10.1523/JNEUROSCI.2028-17.2017
- Pennanen C, Kivipelto M, Tuomainen S, et al. Hippocampus and entorhinal cortex in mild cognitive impairment and early AD. Neurobiol Aging. 2004;25(3):303-310. doi:10.1016/S0197-4580(03)00084-8
- Carlson ML, Toueg TN, Khalighi MM, et al. Hippocampal subfield imaging and fractional anisotropy show parallel changes in Alzheimer’s disease tau progression using simultaneous tau‐PET/MRI at 3T. Alzheimer’s Dement Diagnosis, Assess Dis Monit. 2021;13(1):1-10. doi:10.1002/dad2.12218
- Zeng Q, Li K, Luo X, et al. Distinct Atrophy Pattern of Hippocampal Subfields in Patients with Progressive and Stable Mild Cognitive Impairment: A Longitudinal MRI Study. J Alzheimer’s Dis. 2020;(Preprint):1-11
Figures
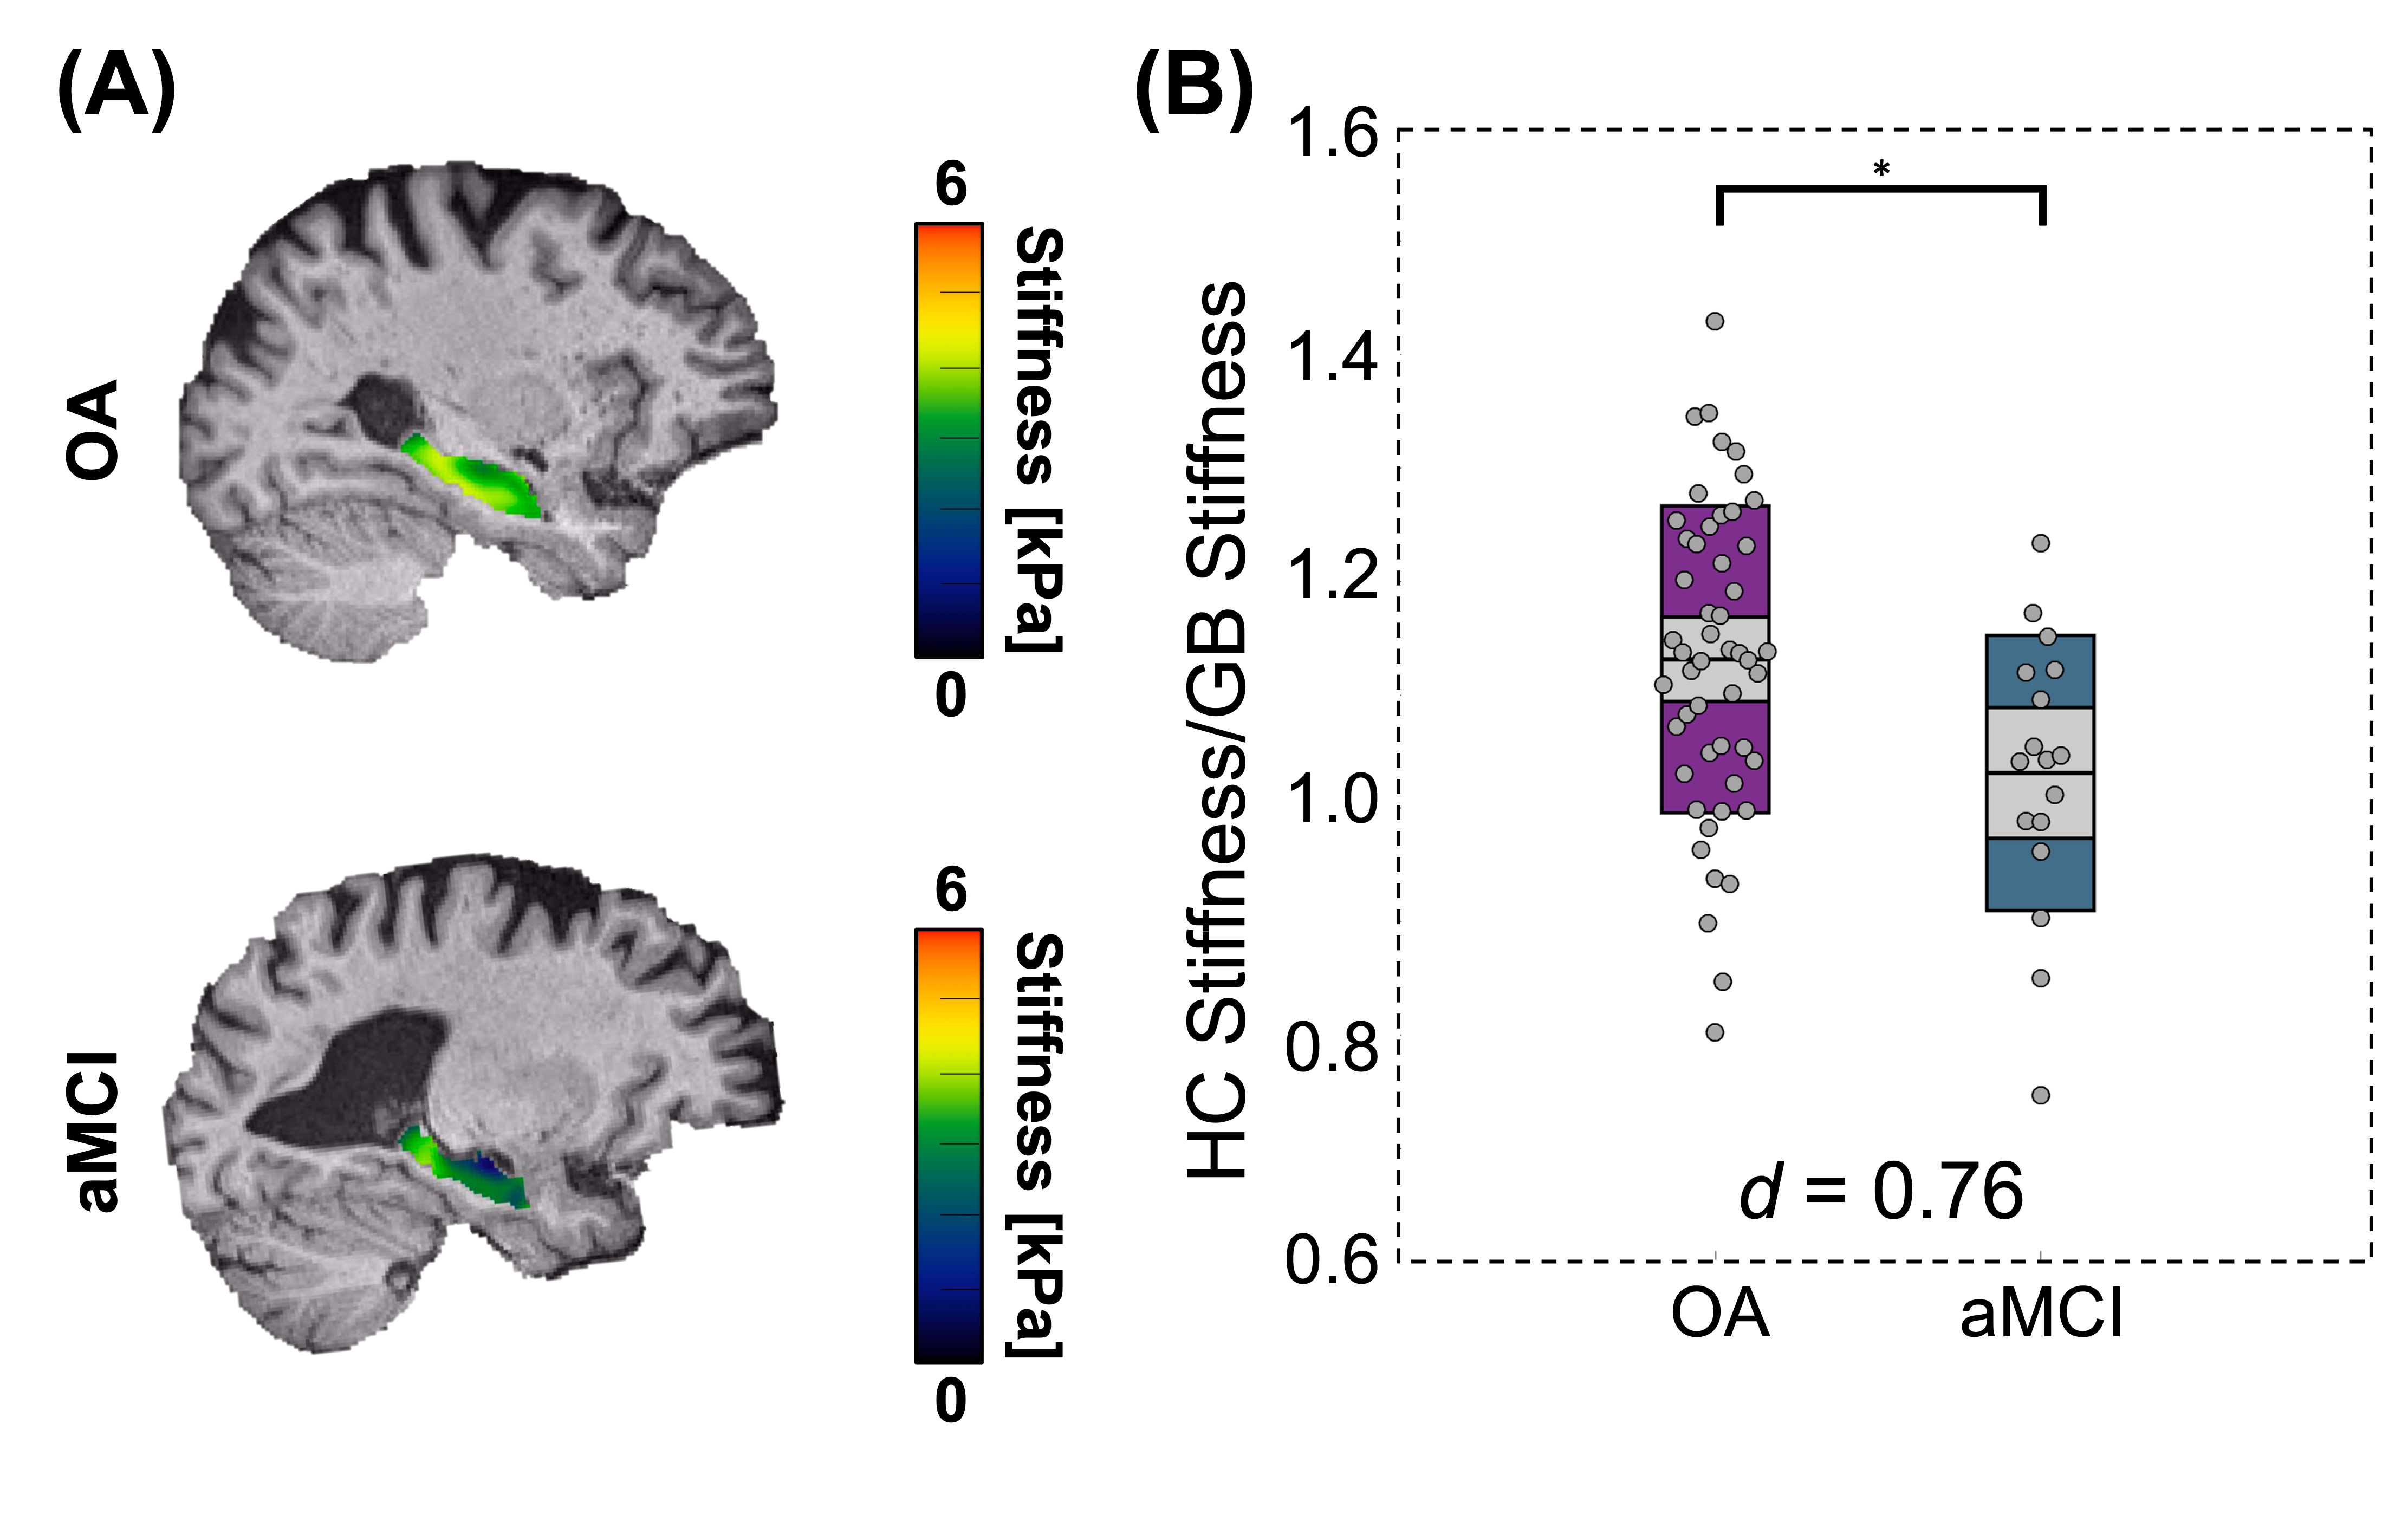
Figure 1: MRE HC normalized μ differences between OA and aMCI older adults. (A) HC μ property maps for an OA participant (77y) and an aMCI participant (74y). (B) HC normalized μ results, showing significant HC property differences between the OA and aMCI participant groups (p = 0.013). Cohen’s d effect size for the model is displayed on the plot and indicates a medium size effect.
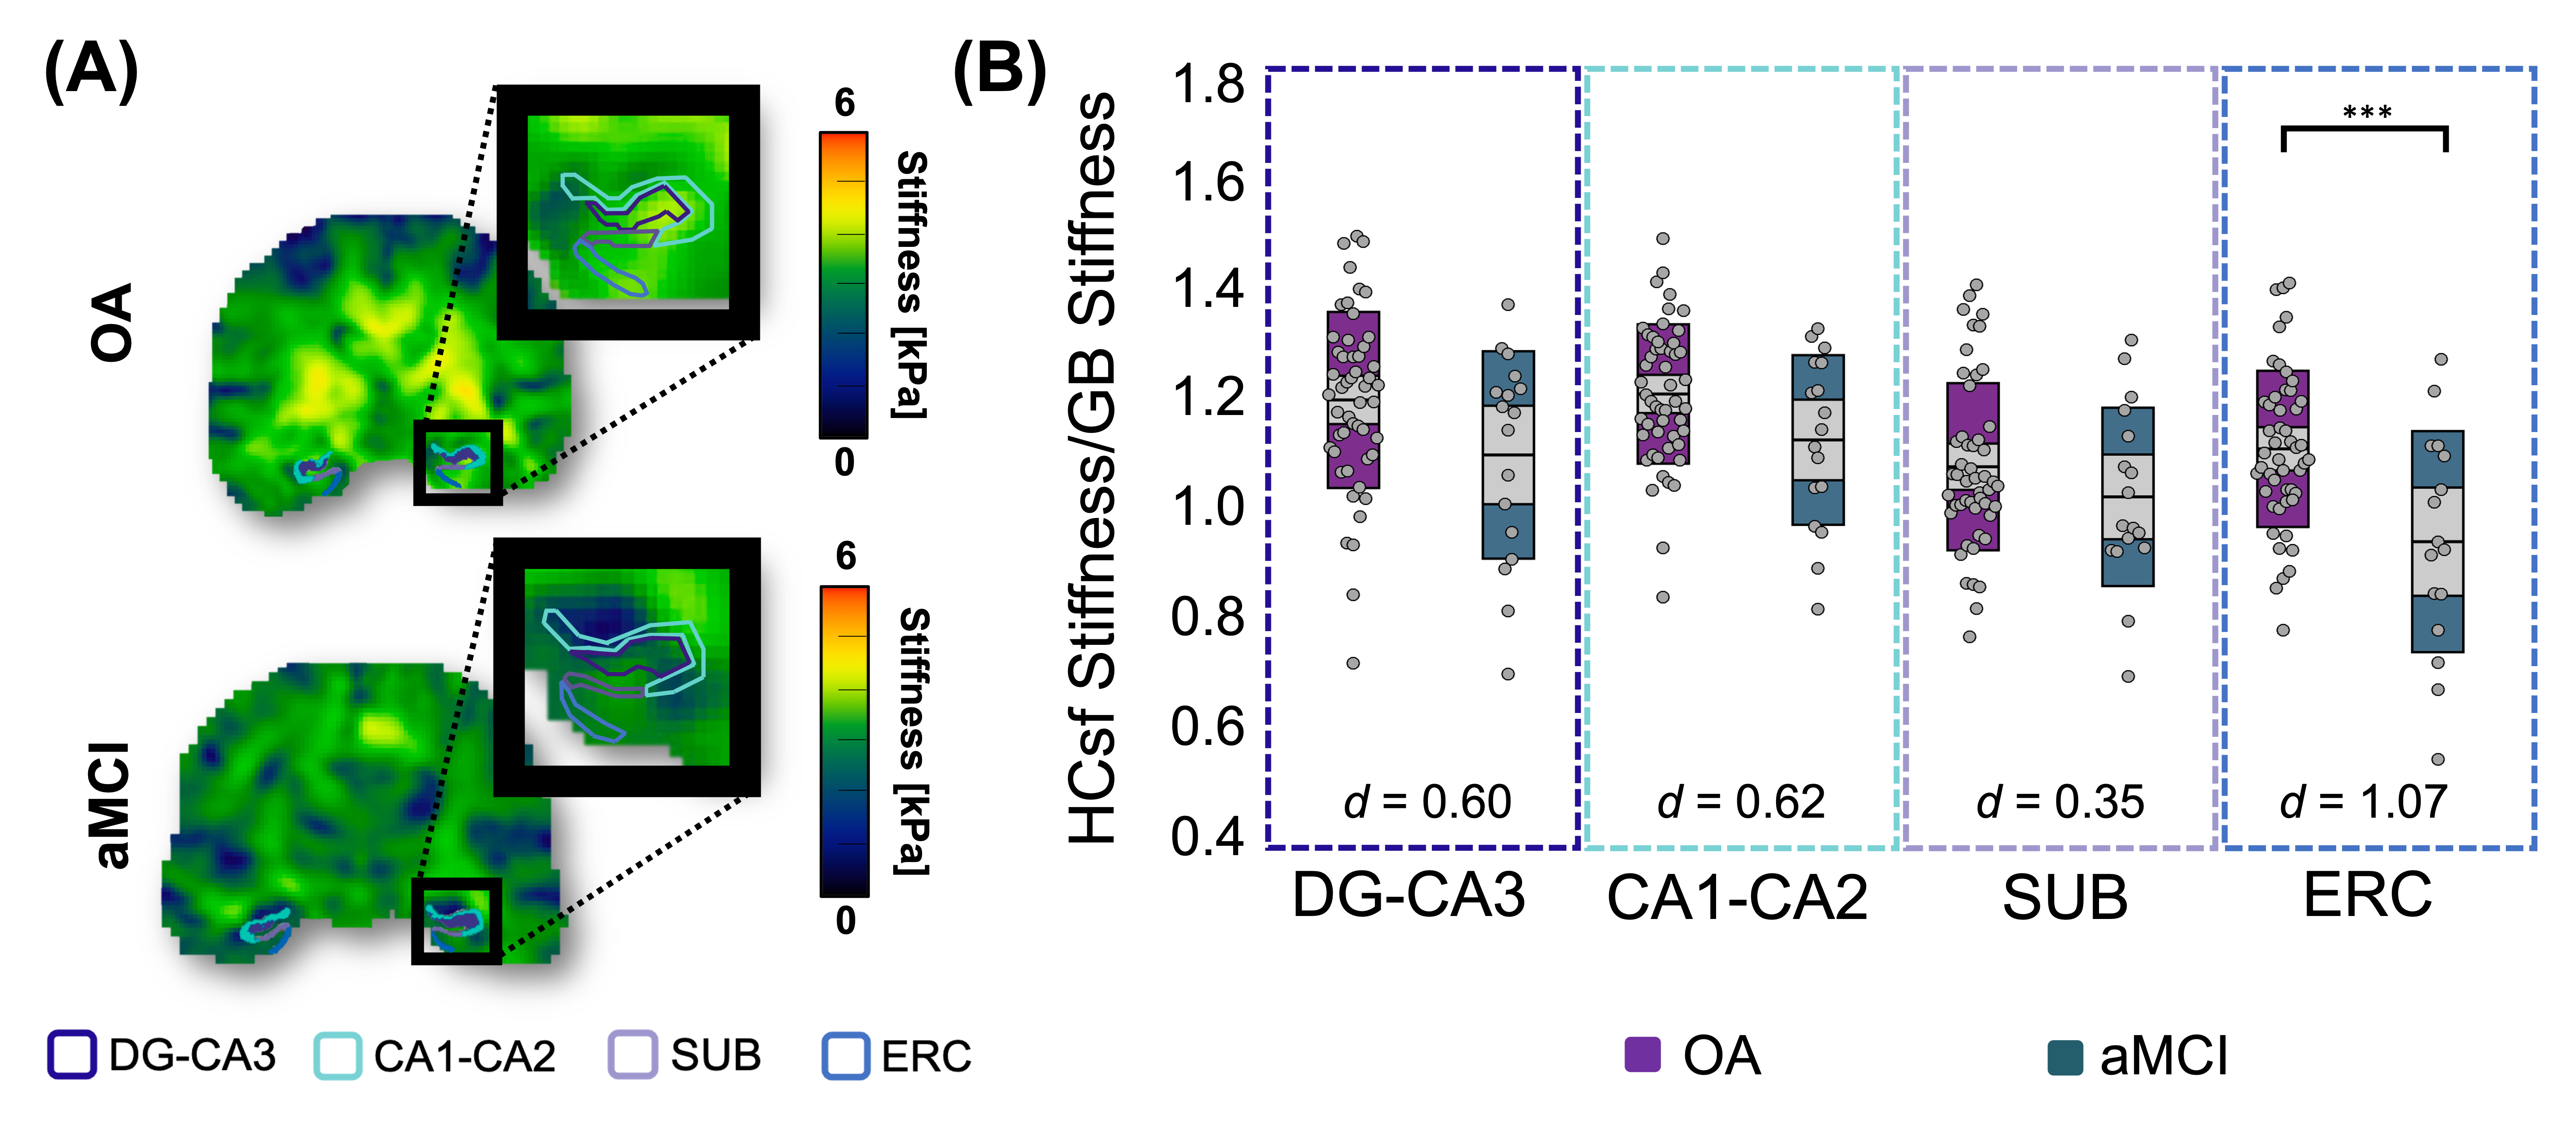
Figure 2: HCsf μ differences between the OA and aMCI participant groups. (A) HCsf μ property map differences for an OA (77y) and aMCI (74y) participant. HCsf regions of interest were: Dentate Gyrus-Cornu Ammonis 3 (DG-CA3), Cornu Ammonis 1-2 (CA1-CA2), Subiculum (SUB), and Entorhinal Cortex (ERC). (B) Normalized HCsf μ plots showing significant ERC differences between the OA and aMCI groups (p < 0.001). Each HCsf Cohen’s d effect size is displayed on the plot. The ERC displayed a large effect size, while the other HCsf regions displayed medium effect sizes.
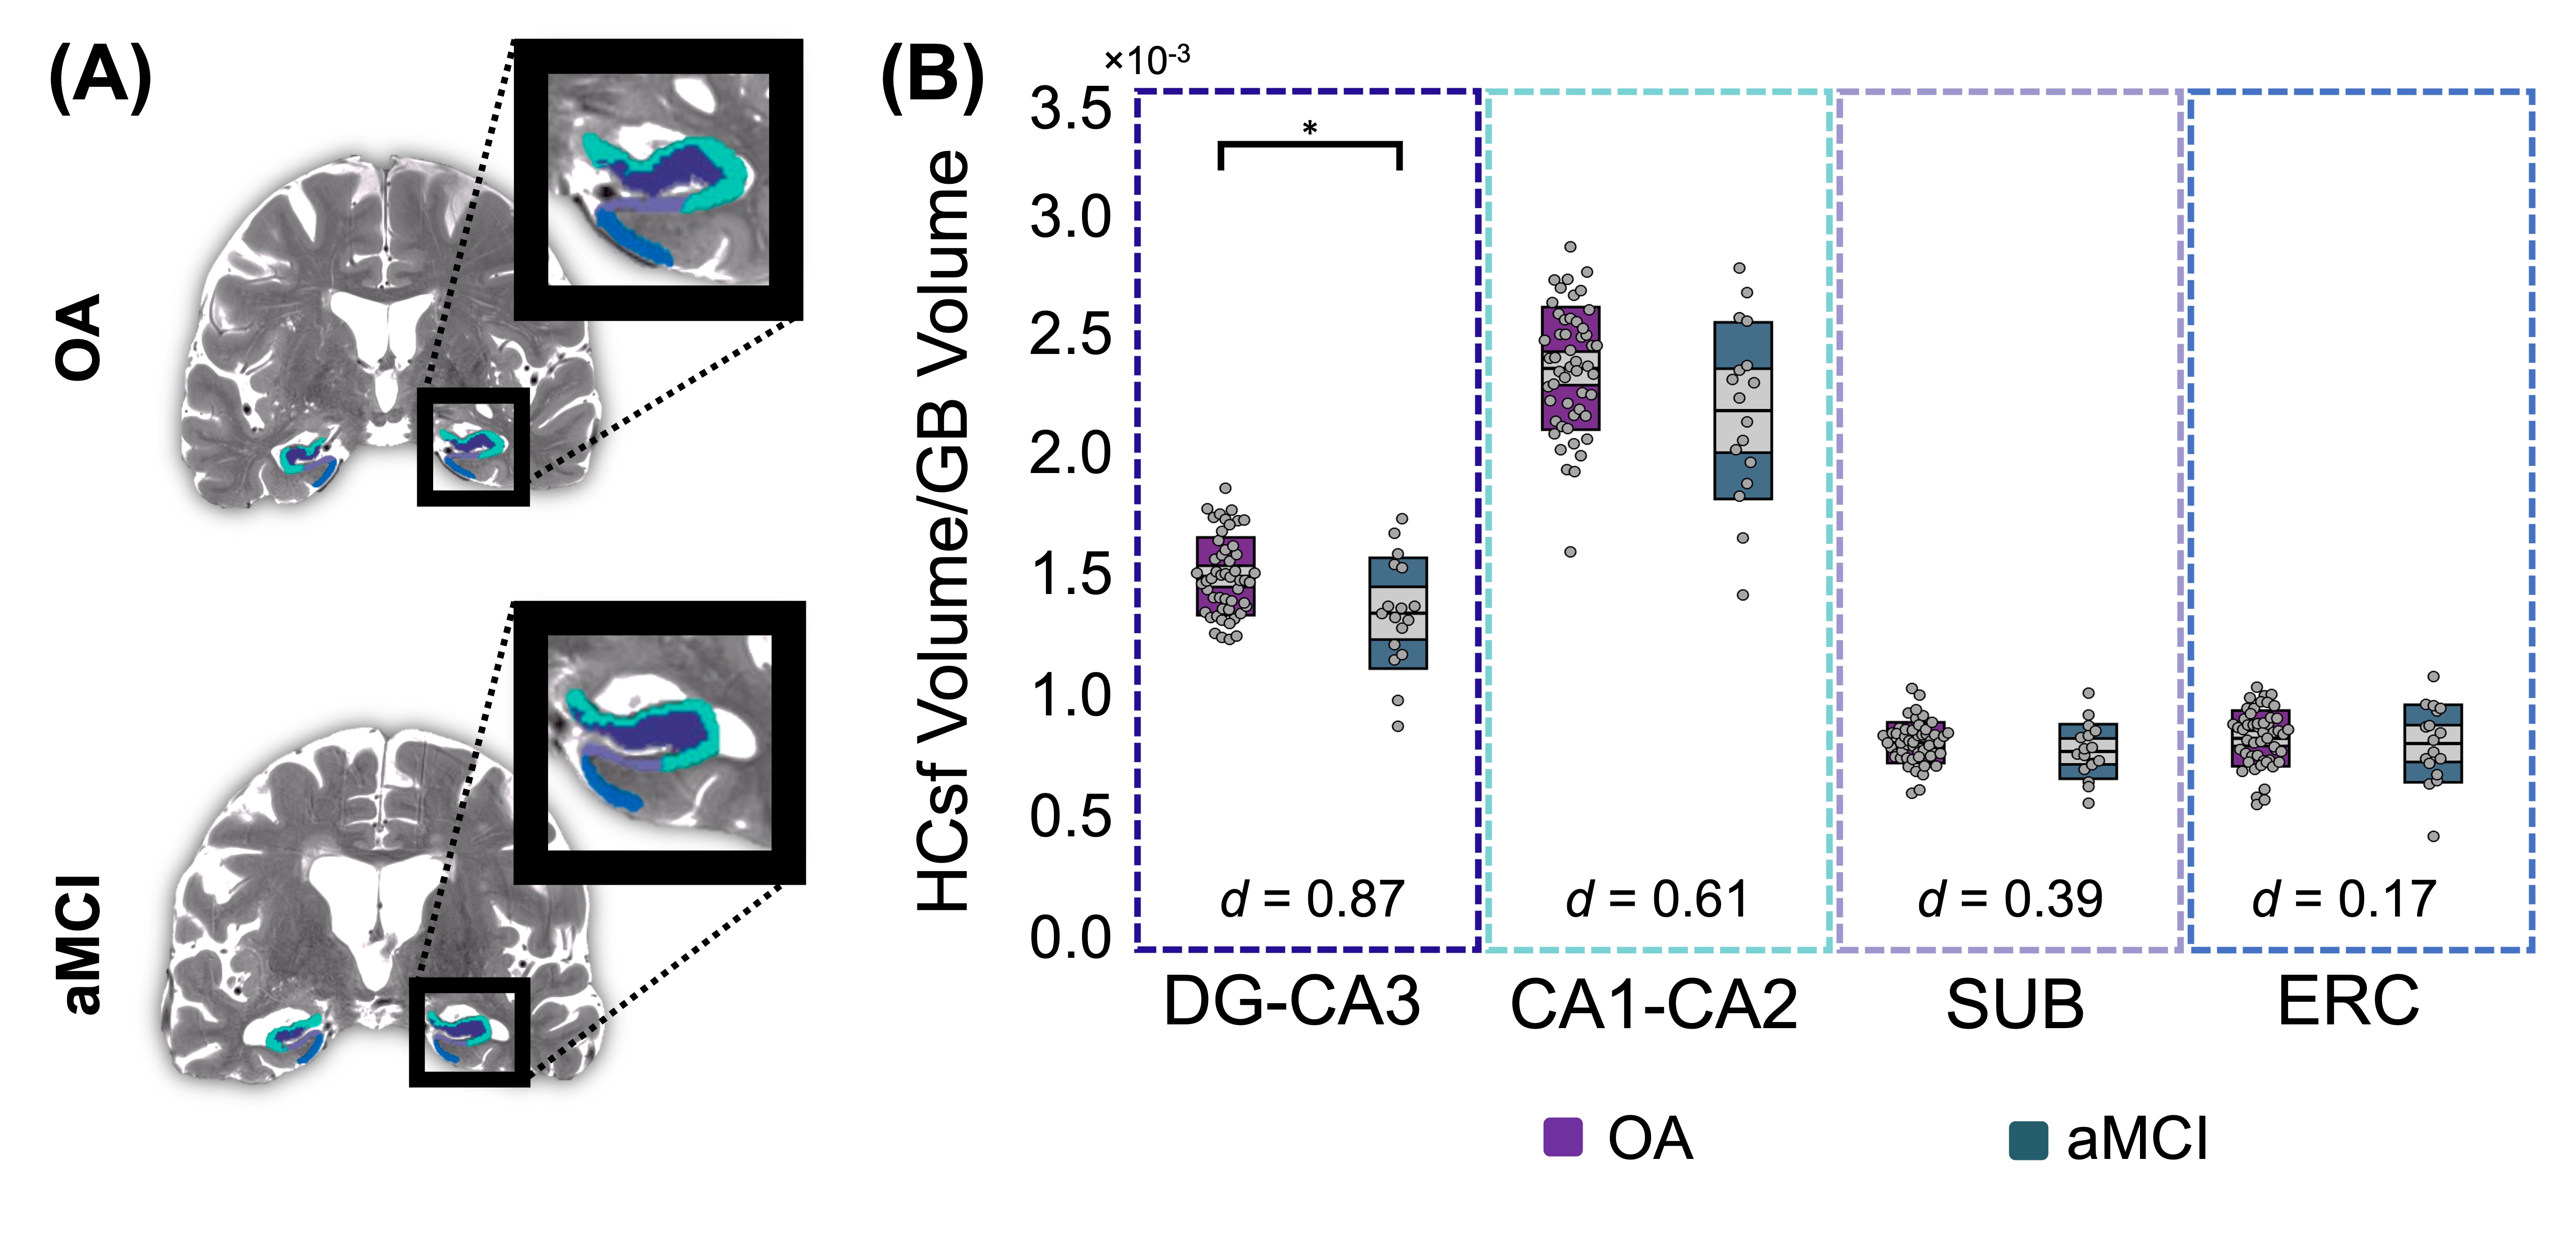
Figure 3: HCsf volume differences between the OA and aMCI participant groups. (A) HCsf volume map differences for an OA (77y) and aMCI (74y) participant. (B) Normalized HCsf volume results showed significant DG-CA3 differences between the OA and aMCI groups (p = 0.013). Cohen’s d effect sizes for each HCsf are indicated on the plot. DG-CA3 displayed a large effect size, CA1-CA2 and SUB displayed medium effect sizes, and ERC displayed a small effect size.
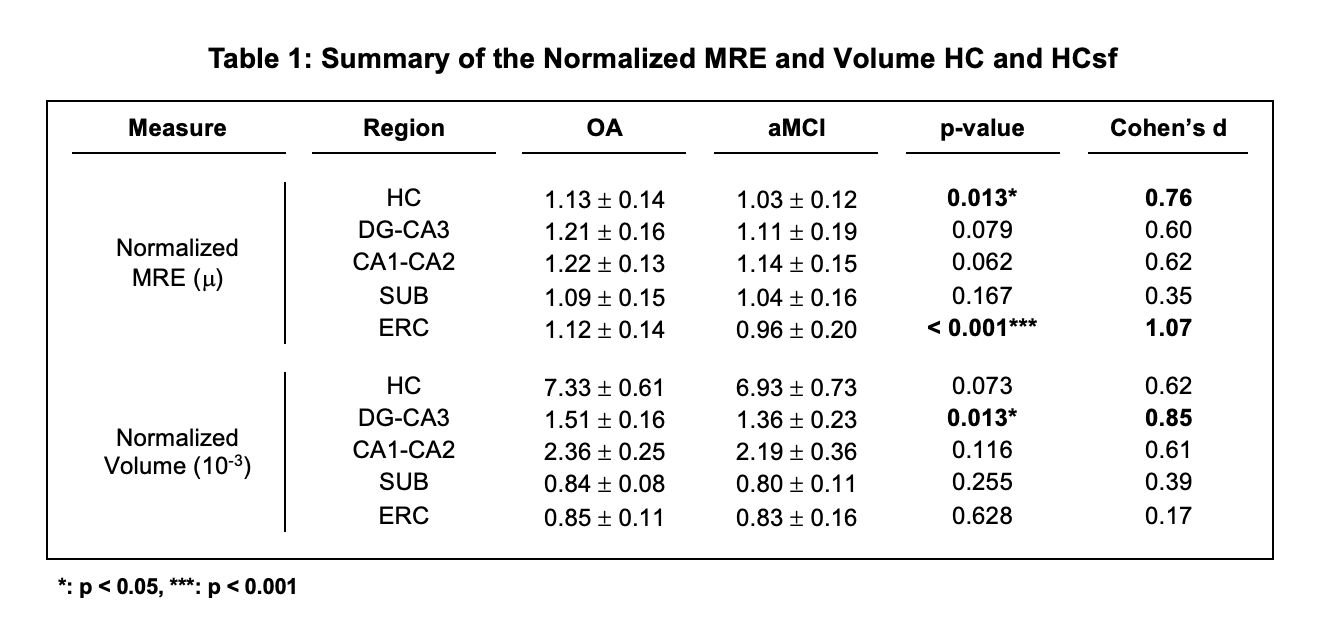
Figure 4: Table of the normalized HC and HCsf property differences between the OA and aMCI participant groups. Values displayed in the OA and aMCI adult columns are the mean ± standard deviation of the normalized MRE and volume values for each participant group. P-values are results from the individual ANCOVA models, adjusted for age and sex. The last column contains Cohen’s d effect sizes for each measure.
DOI: https://doi.org/10.58530/2022/0722