0721
Multimodal MRI-derived phenotypes in preclinical Alzheimer’s Disease: results from the EPAD cohort1Dept. of Radiology and Nuclear Medicine, Amsterdam University Medical Centre, Vrije Universiteit, Amsterdam Neuroscience, Amsterdam, The Netherlands, Amsterdam, Netherlands, 2MRC unit for Lifelong Health and Ageing at UCL, London, UK, London, United Kingdom, 3Dementia Research Centre, Department of Neurodegenerative Disease, UCL Queen Square Institute of Neurology, London, UK, London, United Kingdom, 4Centre for Medical Image Computing, University College London, London, UK, London, United Kingdom, 5School of Biomedical Engineering & Imaging Sciences, King’s College London, UK, London, United Kingdom, 6CIRD Centre d’Imagerie Rive Droite, Geneva, Switzerland, Geneva, Switzerland, 7Department of Surgical Sciences, Radiology, Uppsala University, Uppsala, Sweden, Uppsala, Sweden, 8Barcelonaβeta Brain Research Center (BBRC), Pasqual Maragall Foundation, Barcelona, Spain, Barcelona, Spain, 9CIBER Fragilidad y Envejecimiento Saludable (CIBERFES), Madrid, Spain, Madrid, Spain, 10IMIM (Hospital del Mar Medical Research Institute), Barcelona Spain, Barcelona, Spain, 11Universitat Pompeu Fabra, Barcelona, Spain, Barcelona, Spain, 12CIBER Bioingeniería, Biomateriales y Nanomedicina (CIBER-BBN), Madrid, Spain, Madrid, Spain, 13Neuroradiological Academic Unit, UCL Queen Square Institute of Neurology London, UK, London, United Kingdom, 14Nuclear Magnetic Resonance Research Unit, Queen Square Multiple Sclerosis Centre, University College London Institute of Neurology, London, United Kingdom, London, United Kingdom, 15Department of Medical Physics and Biomedical Engineering, Centre for Medical Image Computing, University College London, London, United Kingdom, London, United Kingdom, 16e-Health Centre, Open University of Catalonia, Barcelona, Spain, Barcelona, United Kingdom, 17Helmholtz‐Zentrum Dresden‐Rossendorf, Institute of Radiopharmaceutical Cancer Research, Dresden, Germany, Dresden, Germany, 18IXICO, London, UK, London, United Kingdom, 19Takeda Pharmaceuticals Ltd., Cambridge, MA, USA, Cambridge, ME, United States, 20Université de Normandie, Unicaen, Inserm, U1237, PhIND "Physiopathology and Imaging of Neurological Disorders", institut Blood-and-Brain @ Caen-Normandie, Cyceron, 14000 Caen, France, Caen, France, 21Department of Nuclear Medicine, Toulouse CHU, Purpan University Hospital, Toulouse, France, Toulouse, France, 22Toulouse NeuroImaging Center, University of Toulouse, INSERM, UPS, Toulouse, France, Toulouse, France, 23Centre for Clinical Brain Sciences, The University of Edinburgh, Edinburgh, UK, Edinburgh, Scotland, 24Laboratory Alzheimer’s Neuroimaging & Epidemiology, IRCCS Istituto Centro San Giovanni di Dio Fatebenefratelli, Brescia, Italy, Brescia, Italy, 25University Hospitals and University of Geneva, Geneva, Switzerland, Geneva, Switzerland, 26Centre for Dementia Prevention, The University of Edinburgh, Scotland, UK, Edinburgh, Scotland, 27UK Dementia Research Institute at Edinburgh, University of Edinburgh, UK, Edinburgh, Scotland, 28Department of Medicine, Imperial College London, London, UK, London, United Kingdom, 29Institute of Neurology and Healthcare Engineering, University College London, London, UK, London, United Kingdom, 30Ghent Institute for Functional and Metabolic Imaging (GIfMI), Ghent University, Ghent, Belgium, Ghent, Belgium
Synopsis
Image-derived phenotypes (IDPs) from multimodal MRI sequences constitute an important resource that allows the characterization of brain alterations in the early stages of Alzheimer diseases and other neurodegenerative conditions. Here, we showed the computation of multimodal IDPs from the European Prevention of Alzheimer Dementia (EPAD) cohort and assessed their relationship with non-imaging markers of neurodegeneration. We demonstrated the clinical relevance of IDPs to uncover early brain alteration in AD by showing expected association with non-imaging data.
Introduction
Alzheimer’s Disease is the most common cause of dementia, characterized by early amyloid accumulation in the brain, followed by phosphorylated tau deposition and neuronal loss 1. Neuroimaging studies have observed subtle brain changes in AD years before the onset of cognitive impairment 2. For this reason, the acquisition and analysis of large magnetic resonance imaging (MRI) datasets is becoming increasingly important for the characterization of brain phenotype as early biomarkers for secondary prevention in neurodegenerative diseases.Recent efforts in the neuroimaging community have been made to create large multimodal and multicenter cohort studies. Image-derived phenotypes (IDPs) are summary features that can be derived from multimodal MRI sequences 3.
In this work, we describe the methodological implementations for the computation of multimodal image-derived phenotypes (IDPs) and investigate their relationship with clinical non-imaging markers of neurodegeneration in the European Prevention of Alzheimer Dementia (EPAD) neuroimaging dataset 4.
Methods
The EPAD v1500.0 release is the baseline data release from the first 1500 participants consented in the EPAD Longitudinal Cohort Study (LCS) study. The imaging protocol is composed of core and advanced sequences. The core image acquisitions are conducted at all sites, providing structural information. The advanced MRI protocol is performed in a subset of EPAD sites with sufficient expertise and equipment, and investigates brain function and structure in greater detail 5.Core sequence IDPs include 3D T1 FreeSurfer 6 regional volumes and cortical thickness, and 3D FLAIR global white matter hyperintensity (WMH) load as segmented by BaMoS 7.A group-level independent component analysis (ICA) was performed with FSL MELODIC on the functional MRI (fMRI) dataset to extract mean functional connectivity for each resting-state network 8. FSL tract-based spatial statistics (TBSS) pipeline was used on Diffusion Tensor Imaging (DTI) derived fractional anisotropy (FA) images to compute 48 regional features according to the JHU ICBM-DTI-81 atlas 9,10.Mean cerebral blood flow (CBF) was computed from Arterial Spin Labeling (ASL) scans by ExploreASL 11.To evaluate the biological relevance of IDPs, we assessed their relationship with clinical non-imaging markers of neurodegeneration.
Results
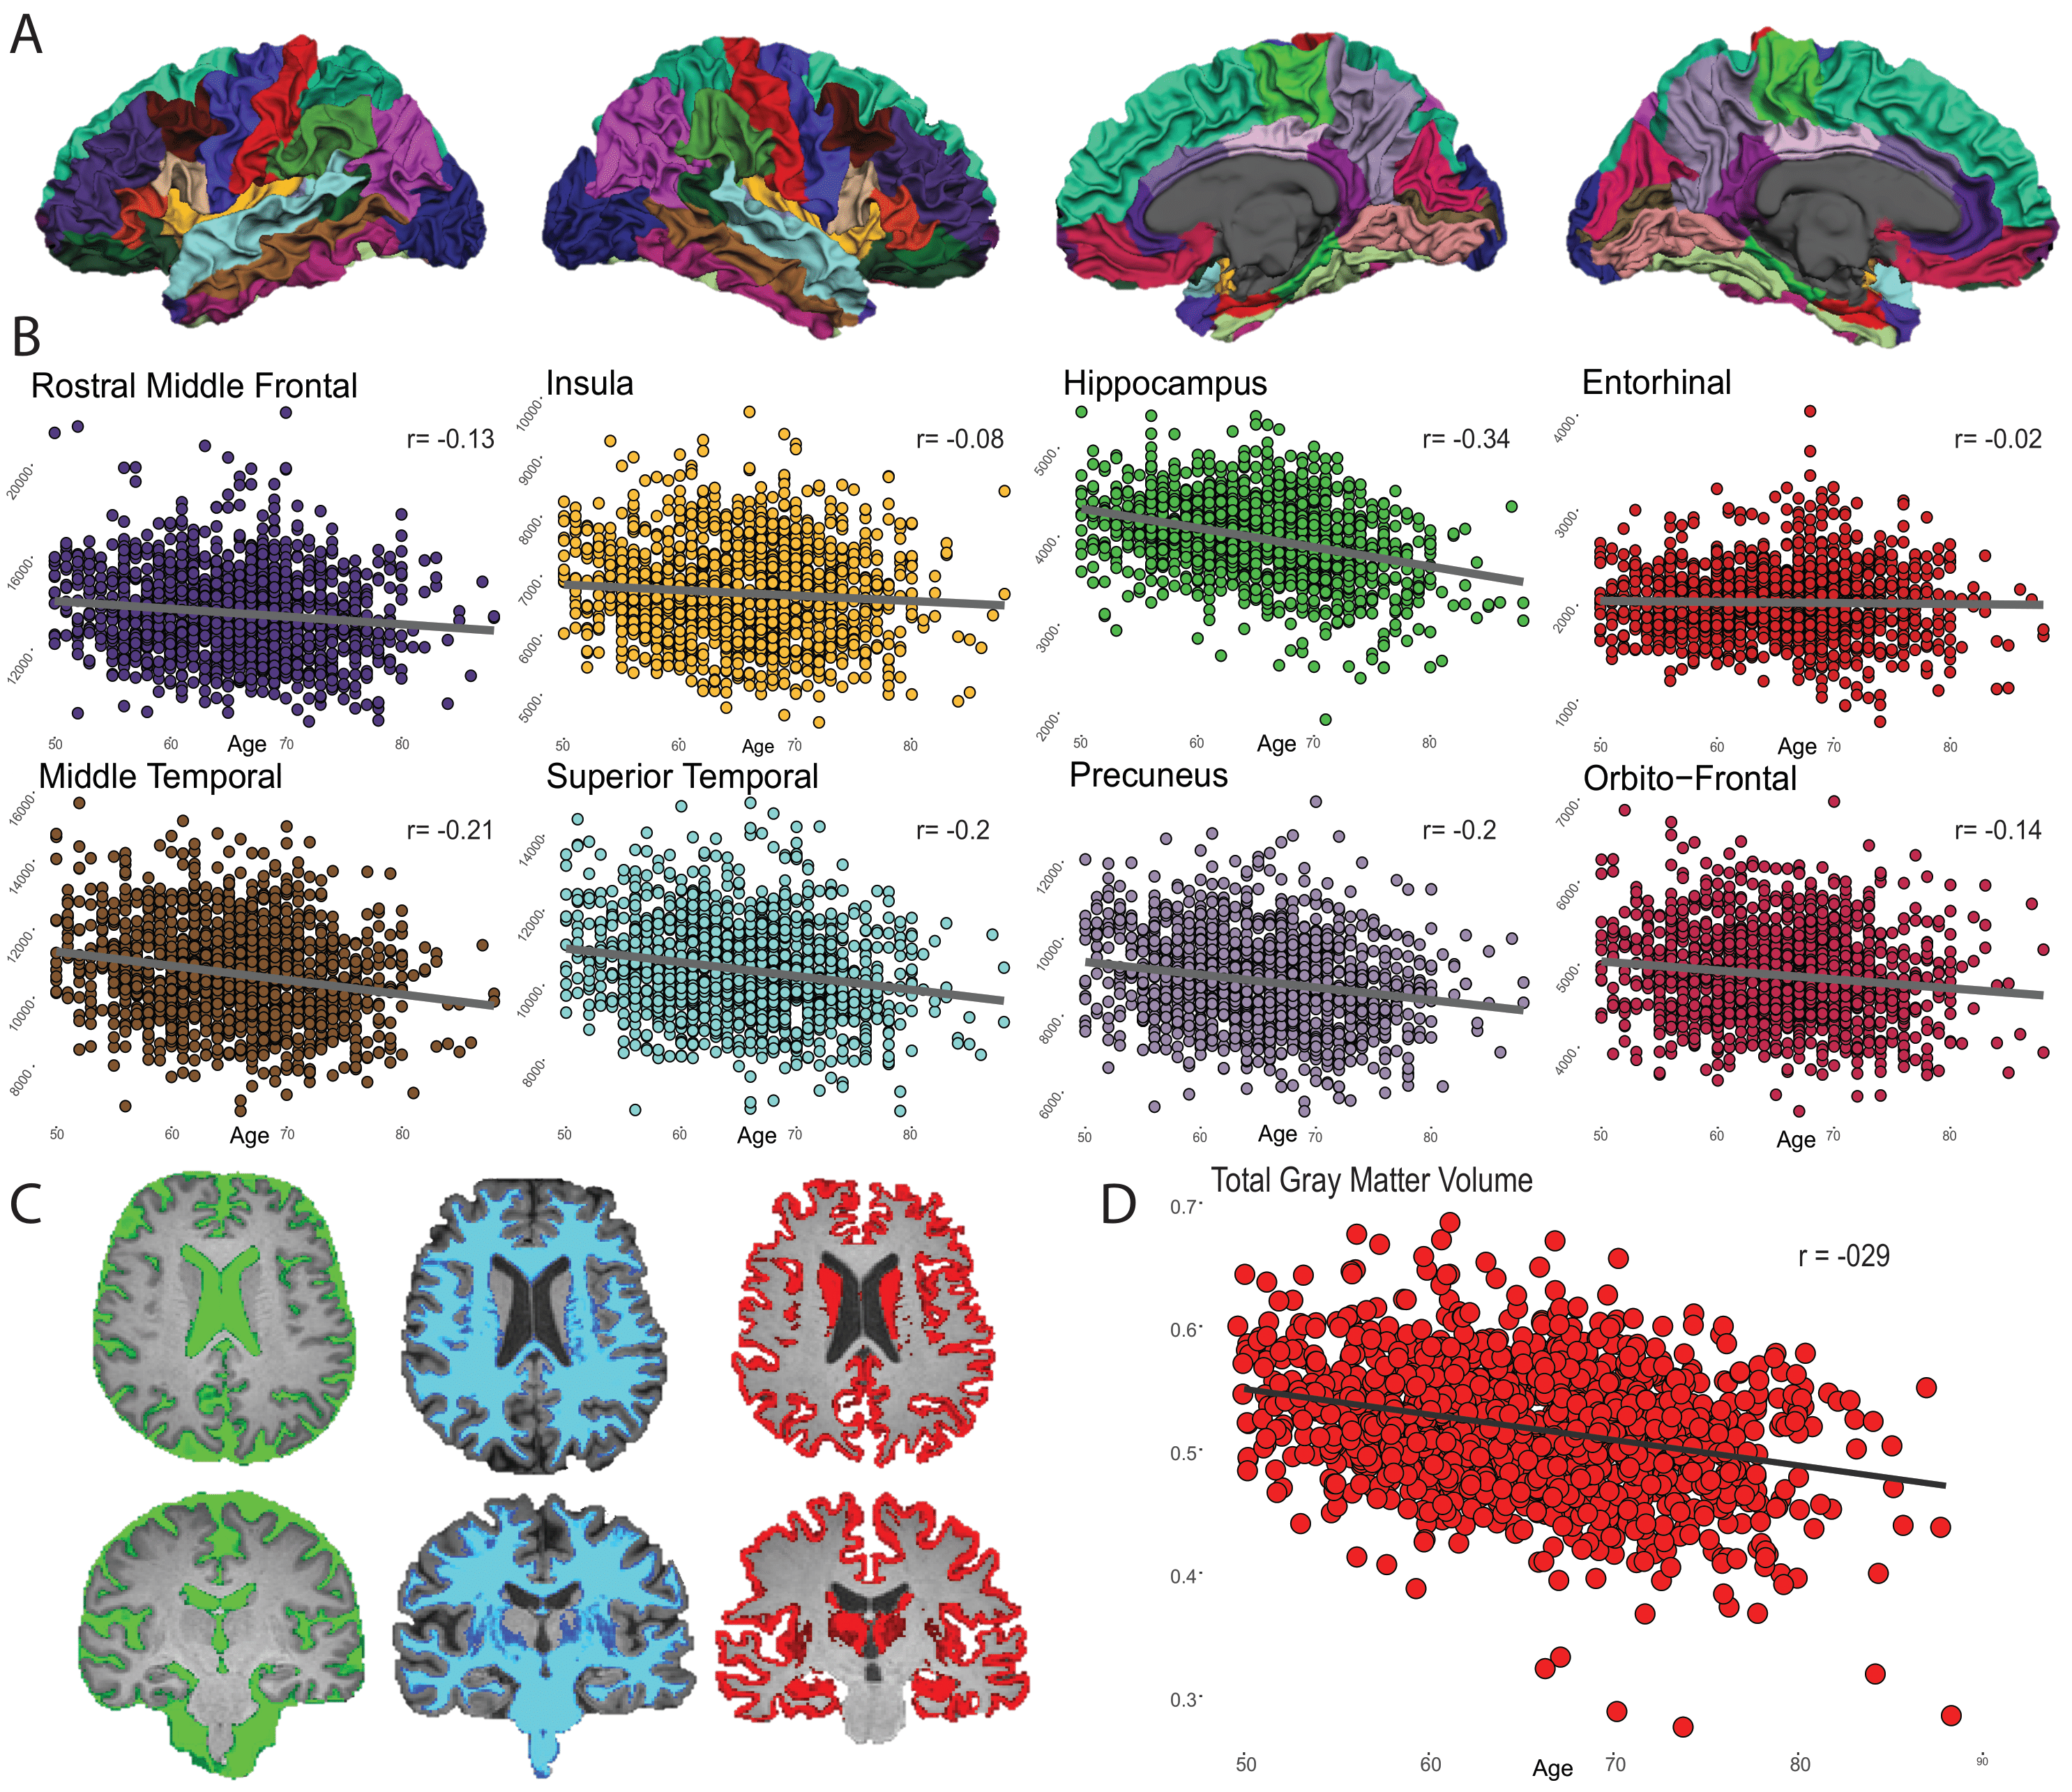
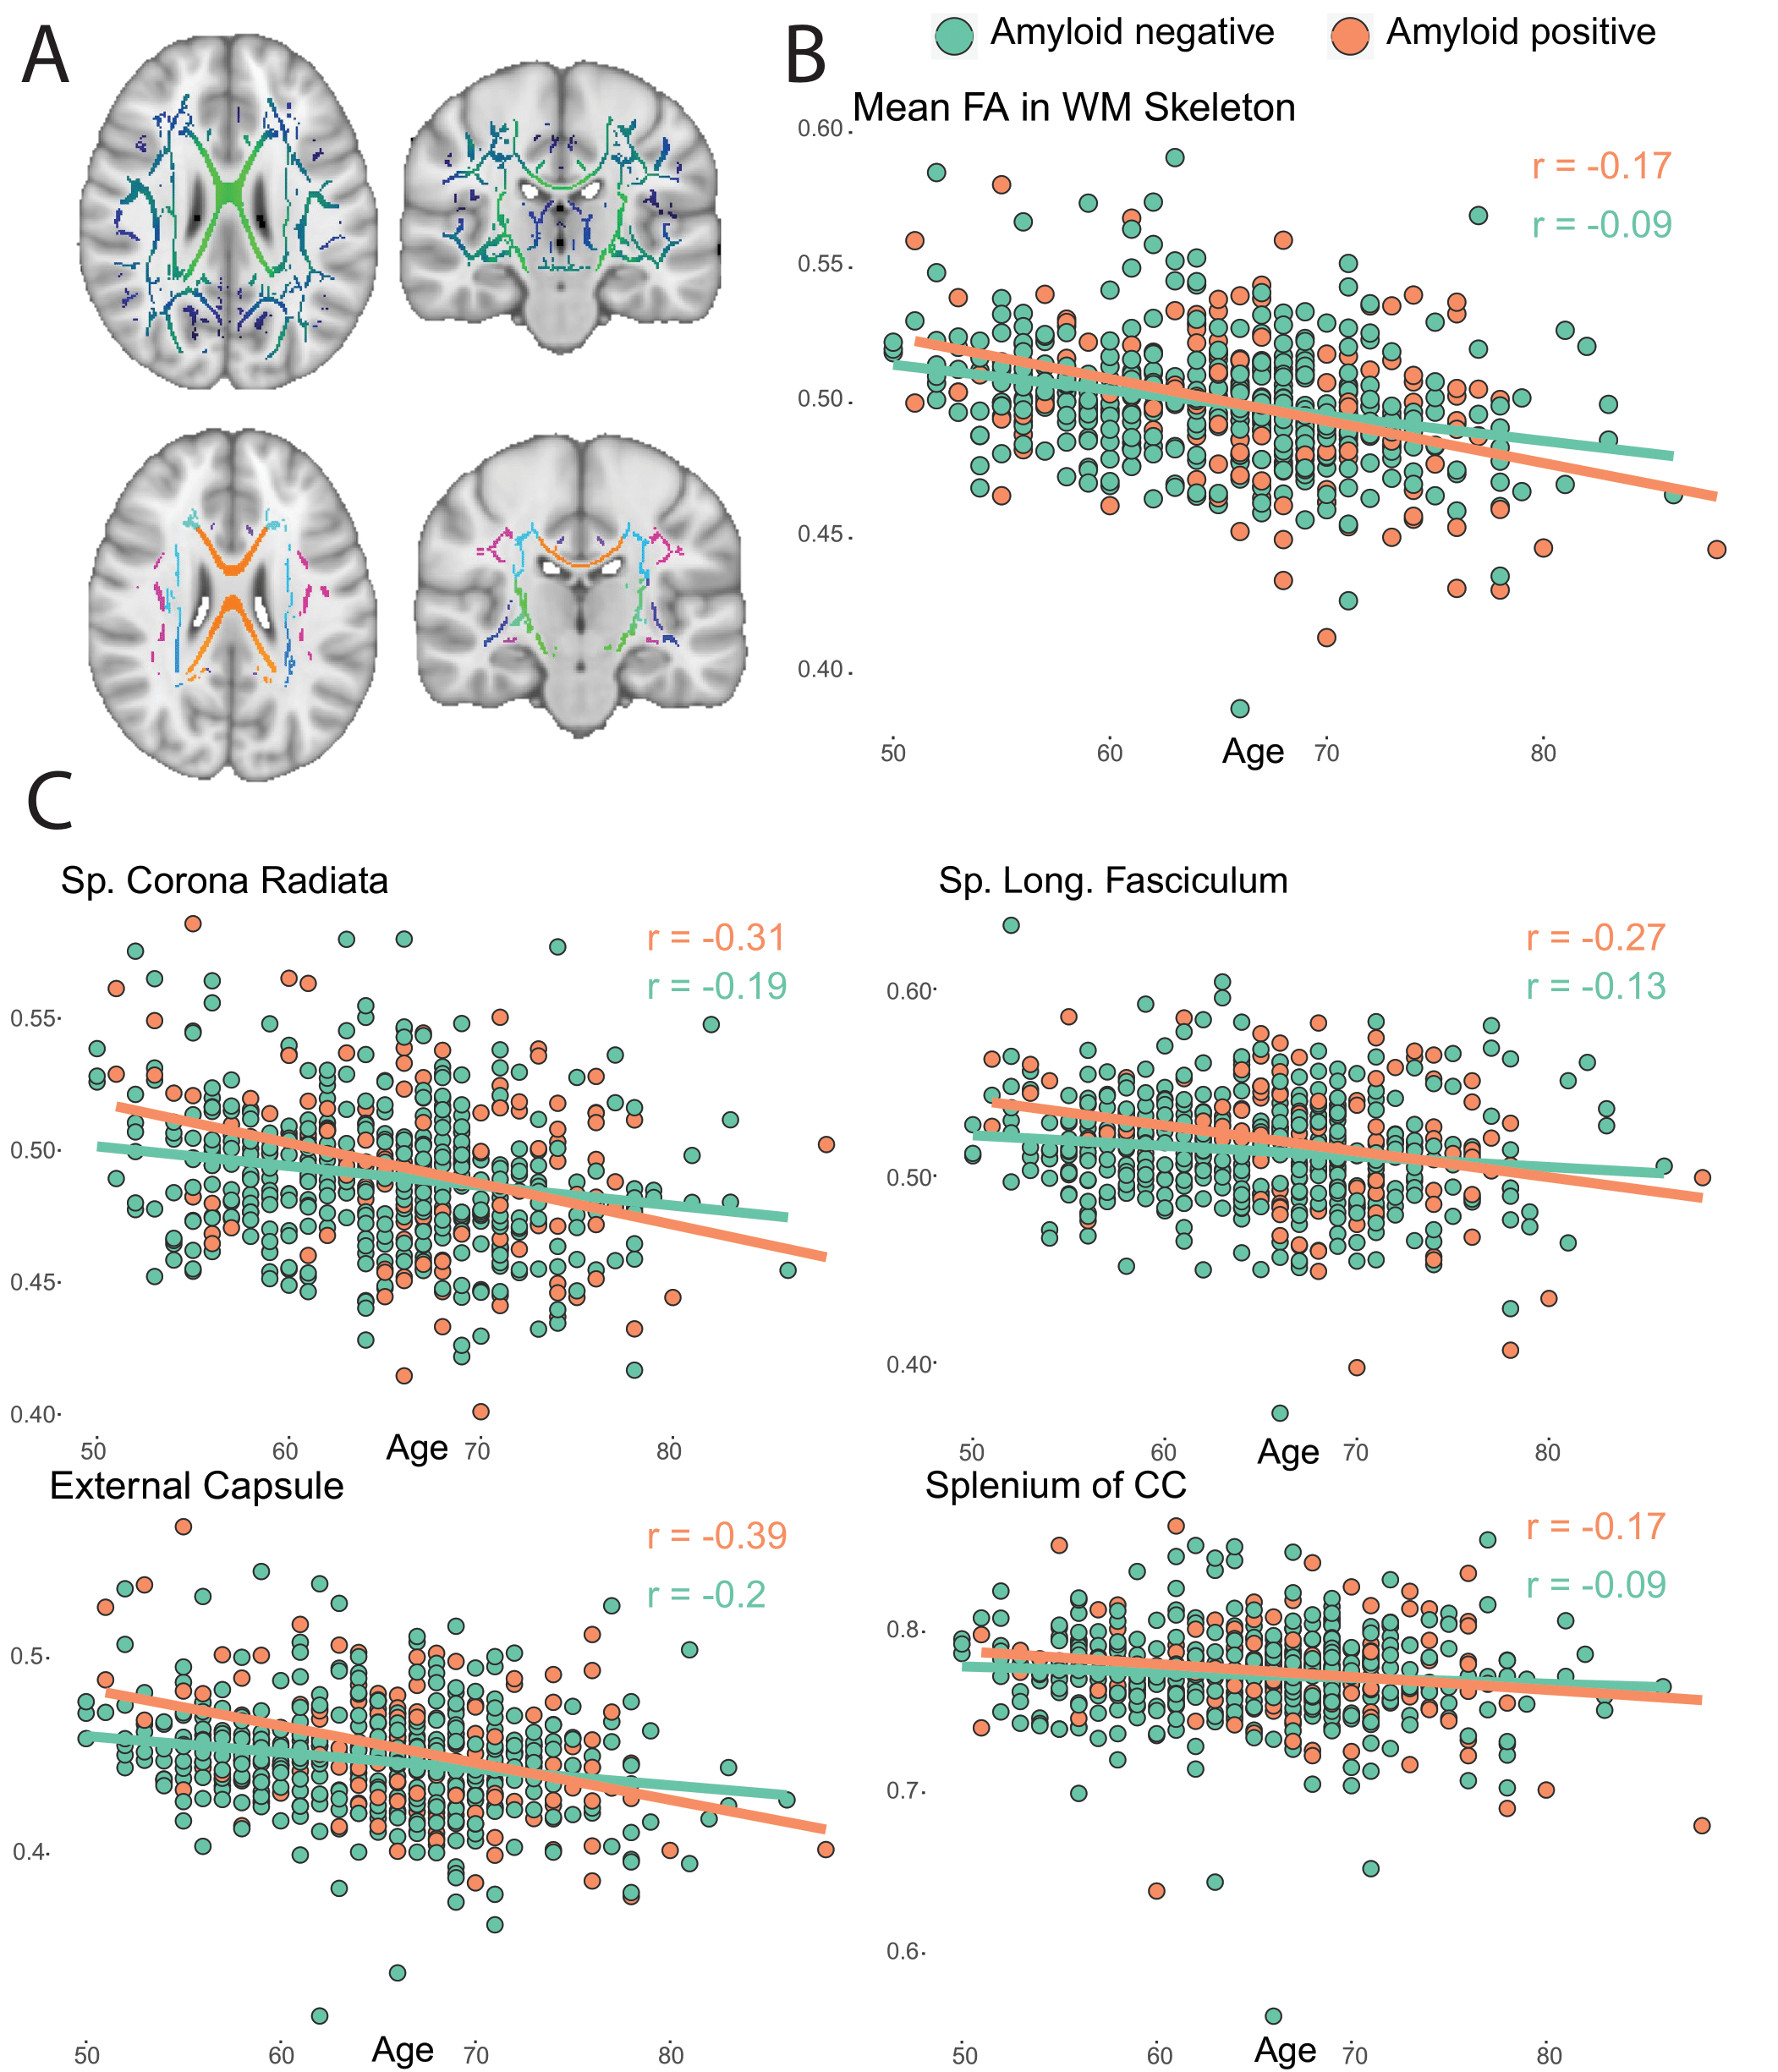
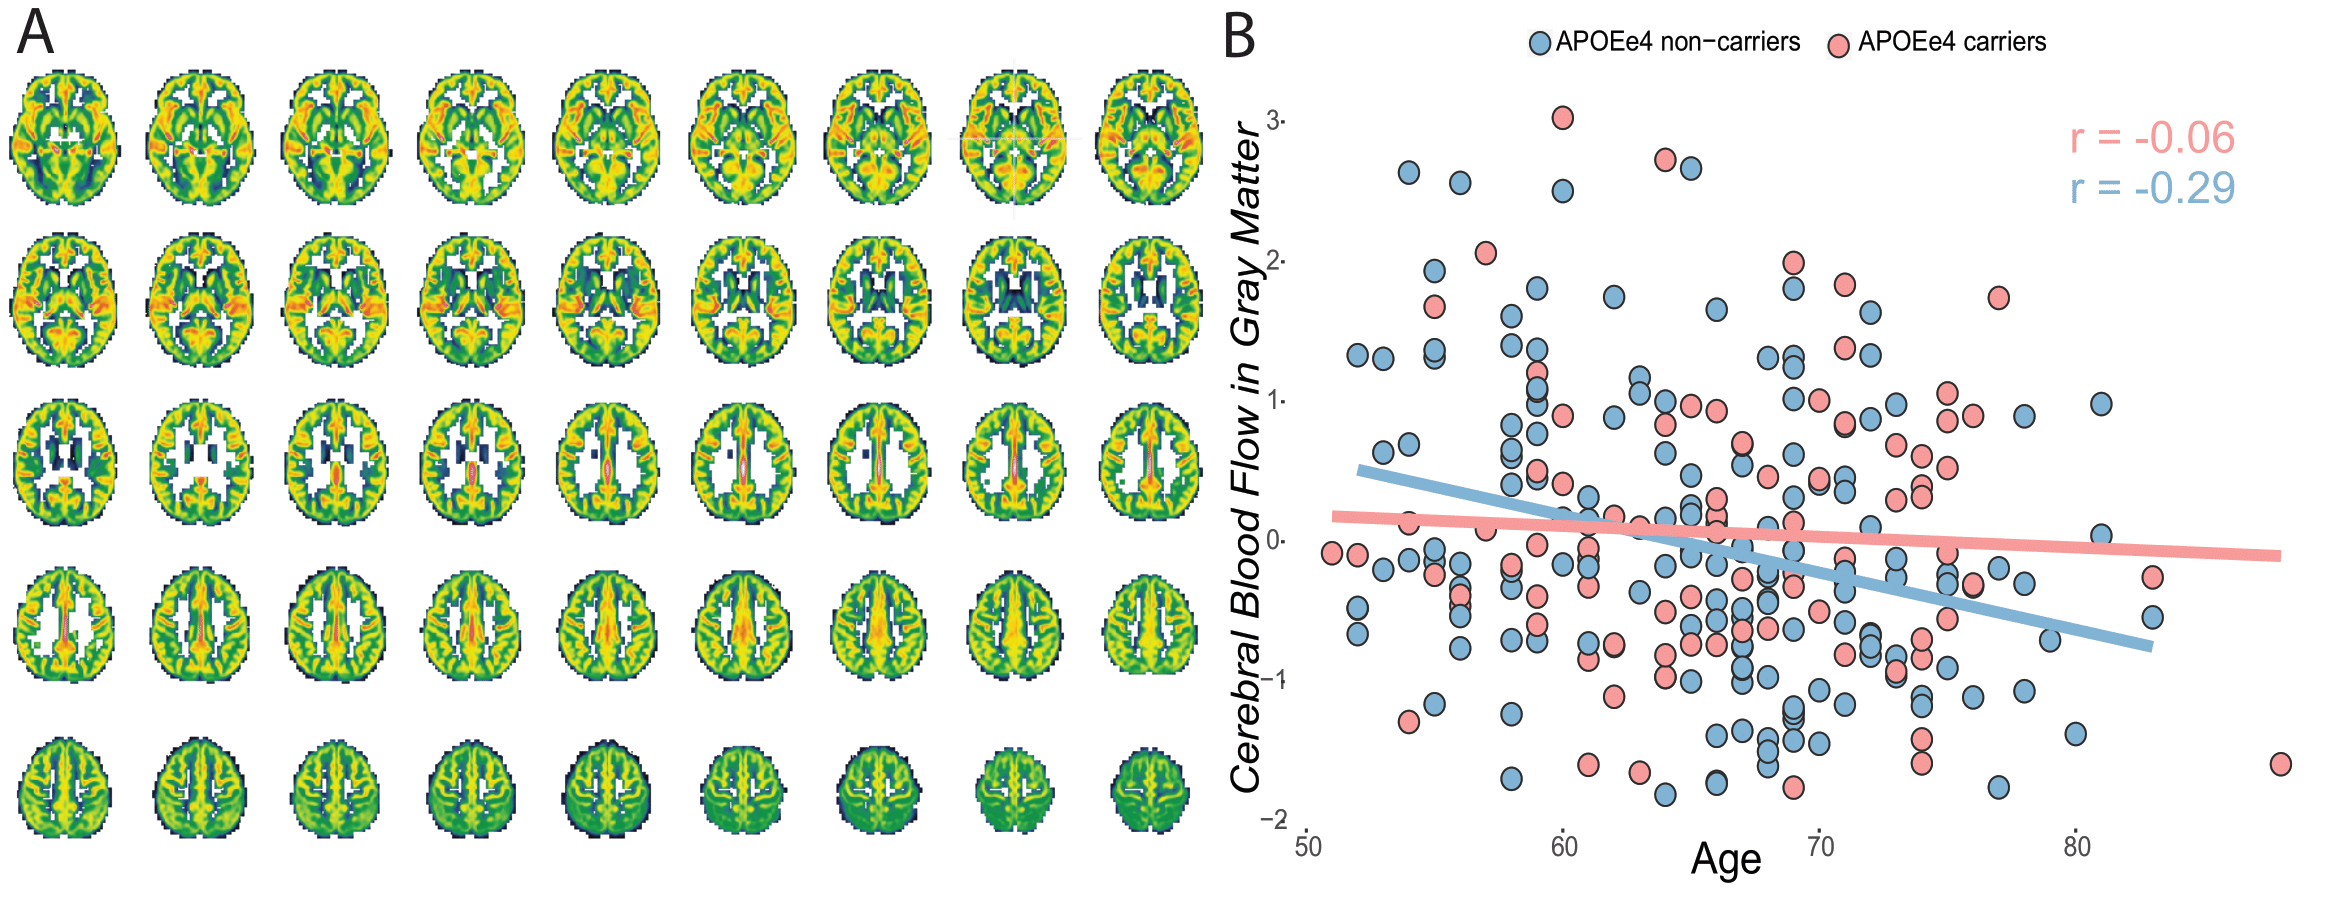
Of the 1500 screened participants, 142 did not fulfill eligibility criteria and were therefore excluded from the release 5. The resulting dataset included 1358 core sequences, 756 SWI, 842 fMRI, 831 DTI, and 237 ASL scans.A total of 358 core and 119 advanced IDPs were derived. GM volume was inversely correlated with age, with stronger effects in medio-temporal areas (Figure 1). Regional WMH volumetrics showed mostly frontal and parietal WM lesions that were associated with aging (Figure 2). Heterogeneous changes in within-network functional connectivity were observed with older age, with mild differences between CDR 0 and 0.5 contrasts, mostly related to the default-mode and frontoparietal networks (Figure 3). Age was also inversely associated with skeletonised FA values. Stronger reductions appeared in amyloid positive participants (Figure 4). Mean CBF maps across participants showed considerable regional variability across the brain with high perfusion in the cingulate and precuneus GM and lower perfusion in basal ganglia (Figure 5A). While APOE-e4 non-carriers participants showed a reduction of CBF with advancing age (Figure 5B), APOE-e4 allele carriers had no relationship between CBF and age.
Discussion
We show the clinical relevance of IDPs to uncover early brain alteration in neurodegenerative diseases, using data from the EPAD neuroimaging dataset. The observed relationships with non-imaging phenotypes confirm their biological relevance and are in agreement with previous studies. The presented IDP framework may constitute a valuable resource for researchers using EPAD data, promoting accessibility of MRI phenotypes and being easily adaptable for other studies and cohorts.Acknowledgements
No acknowledgement found.References
1. Ballard, C. et al. Alzheimer’s disease. The Lancet vol. 377 1019–1031 (2011).
6. Fischl, B. FreeSurfer. Neuroimage 62, 774–781 (2012).
12. Ingala, S. et al. Application of the ATN classification scheme in a population without dementia: Findings from the EPAD cohort. Alzheimer’s & Dementia (2021) doi:10.1002/alz.12292.
Figures