0717
Frontal and Temporal Cortical Myelination Associations with Cognition Revealed by a Novel T1w/T2w-based Marker in Subjective Cognitive Decline1Department of Radiology, New York University Grossman School of Medicine, New York, NY, United States, 2Center for Cognitive Neurology, Department of Neurology, New York University Grossman School of Medicine, New York, NY, United States, 3Neuroscience Institute, New York University Grossman School of Medicine, New York, NY, United States, 4Department of Neuroscience and Physiology, New York University Grossman School of Medicine, New York, NY, United States, 5Department of Psychiatry, New York University Grossman School of Medicine, New York, NY, United States, 6Department of Pathology, New York University Grossman School of Medicine, New York, NY, United States
Synopsis
Identifying early changes associated with Alzheimer’s Disease (AD) and separating pathological from normal brain aging is a key step in AD treatment development. It has been proposed that a neuropathological retrogenesis heralded by cortical demyelination underlies the behavioral retrogenesis characterizing AD. As one of the earliest behavioral manifestations of AD, subjective cognitive decline (SCD) is a major research target, however, few studies have discovered reliable neural correlates at this stage. Here, using a novel cortical profile approach, we examined the cortical gradient of T1w/T2w, a putative myelin marker, in SCD and healthy control participants and its association with cognition.
Purpose
Identifying early changes associated with Alzheimer’s Disease (AD) may help recognize persons at risk and inform treatments focused on preserving brain function. Among candidate mechanisms, a neuropathological retrogenesis heralded by cortical demyelination was proposed to underlie the behavioral retrogenesis characteristic of AD1. Here we aimed to test the cortical demyelination hypothesis by examining the cortical gradient of T1w/T2w, a putative marker of myelin content2, and its relationship with cognitive function in one of the first recognizable behavioral stages of AD, subjective cognitive decline (SCD)3. SCD is characterized by subtle deficits not detectable by neuropsychological tests4. Few studies to date have discovered reliable neural correlates at this stage.Methods
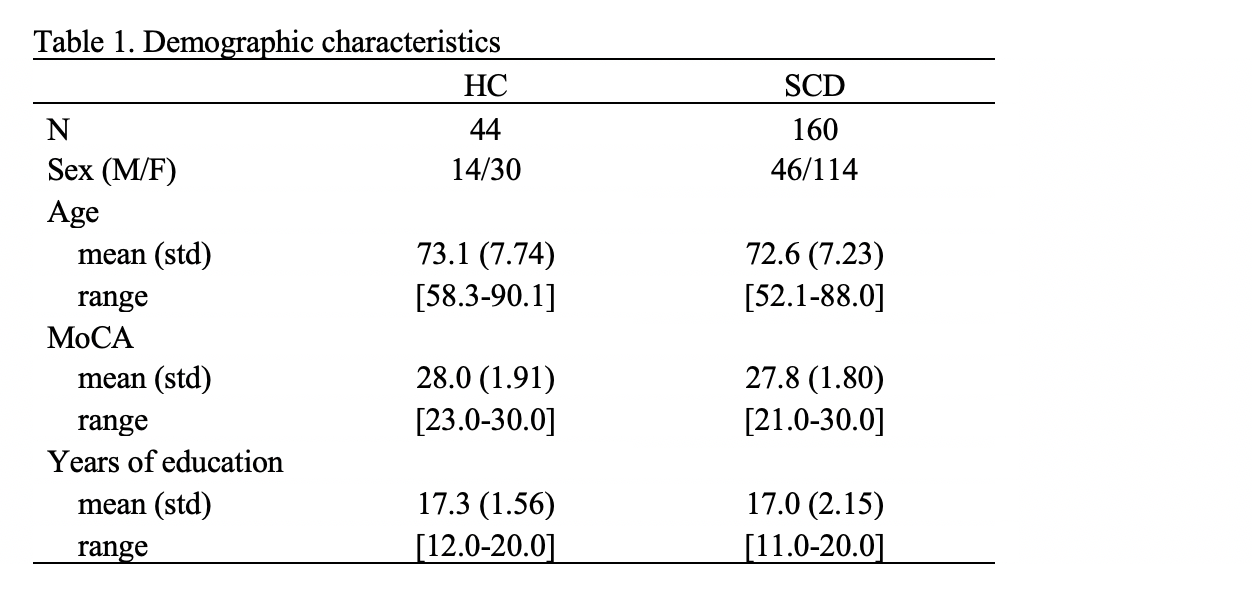
Data examined here is part of a longitudinal study conducted by the NYU Langone Alzheimer’s Disease Research Center. Here, we focused on MR images (3T Siemens Magnetome Prisma) acquired between 2014 and 2019, which included high-resolution T1w MPRAGE (TR=2100ms, TE=5ms, TI=900ms, FA=9º, 1mm isotropic voxels) and T2w-PD (TR=6000ms, TE=10/104ms, FA=180º, 0.9×0.9×4mm voxels) acquisitions acquired under a constant protocol. Diagnostic and cognitive assessments included Global Deterioration Scale (GDS) rating5 for AD stage classification and the Montreal Cognitive Assessment (MoCA)6 for cognitive function evaluation.Participants with GDS=1 (healthy controls, HC), and GDS=2 (SCD) were examined. Upon recruitment, those with lesional brain MRI abnormalities (e.g., tumor, neocortical infarction, etc.) or on psychoactive medications were excluded. We further removed from current analysis participants with less than 10 years of education or MoCA score less than 16 (6 participants removed), leaving 44 HC and 160 SCD participants in this study.
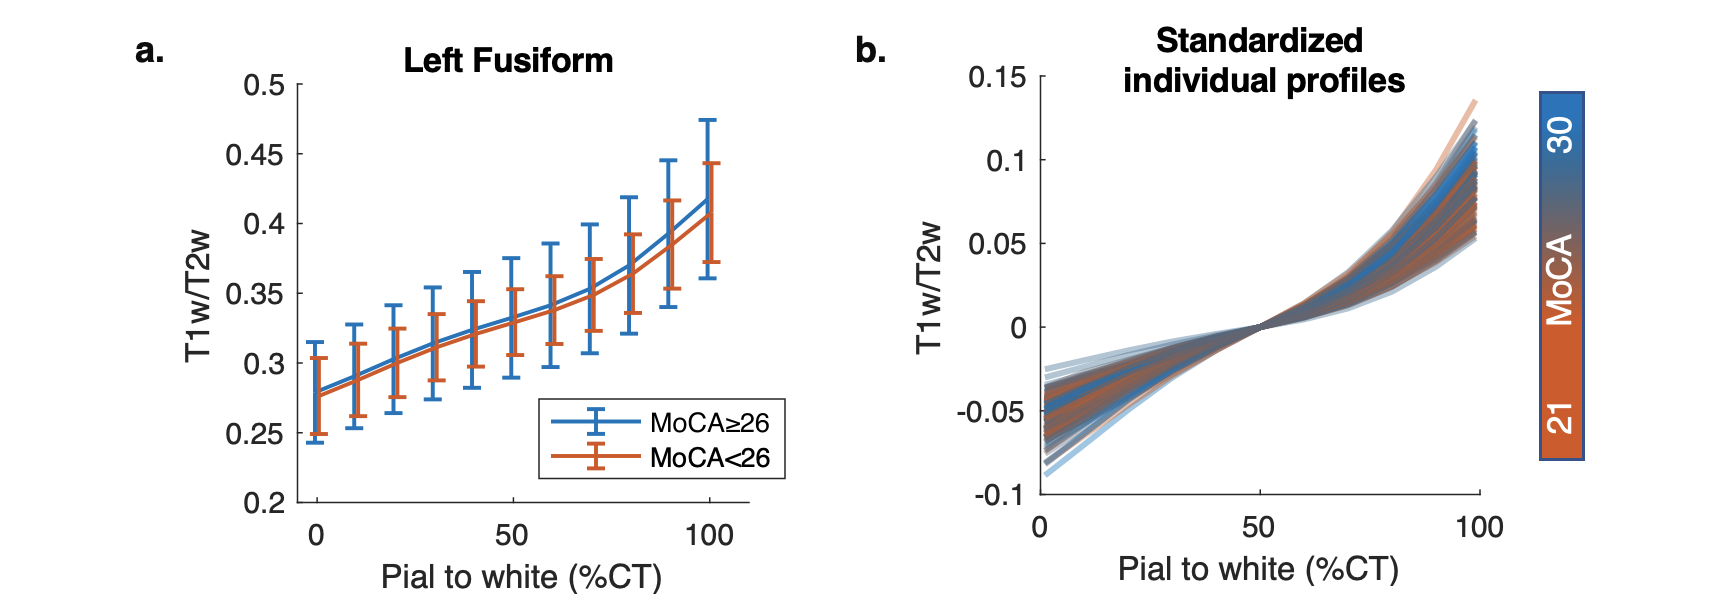
The key imaging processing steps (Figure 1a) included generating super resolution T2w images, calculating T1w/T2w maps, parcellating the cortex, and tabulating volume and cortical thickness (CT) data of each region of interest (ROI). FreeSurfer, FSL, SPM8, and Matlab were used. To characterize the gradient of the T1w/T2w values across the cortical ribbon for each ROI, we expanded 11 surfaces in between the pial and white matter surfaces, at 1%, 99%, and 9 CT depths evenly spaced between 10% - 90% using FreeSurfer mri_vol2surf (Figure 1b). The T1w/T2w values were then interpolated along these surfaces, with the mean values extracted for each region using FreeSurfer mri_segstats. Finally, we quantified the T1w/T2w gradient profile across expanded surfaces in each ROI by calculating a nonlinearity index (NLI) as the root mean squared deviation of the profile curve from a linear fitting line (Figure 1b).
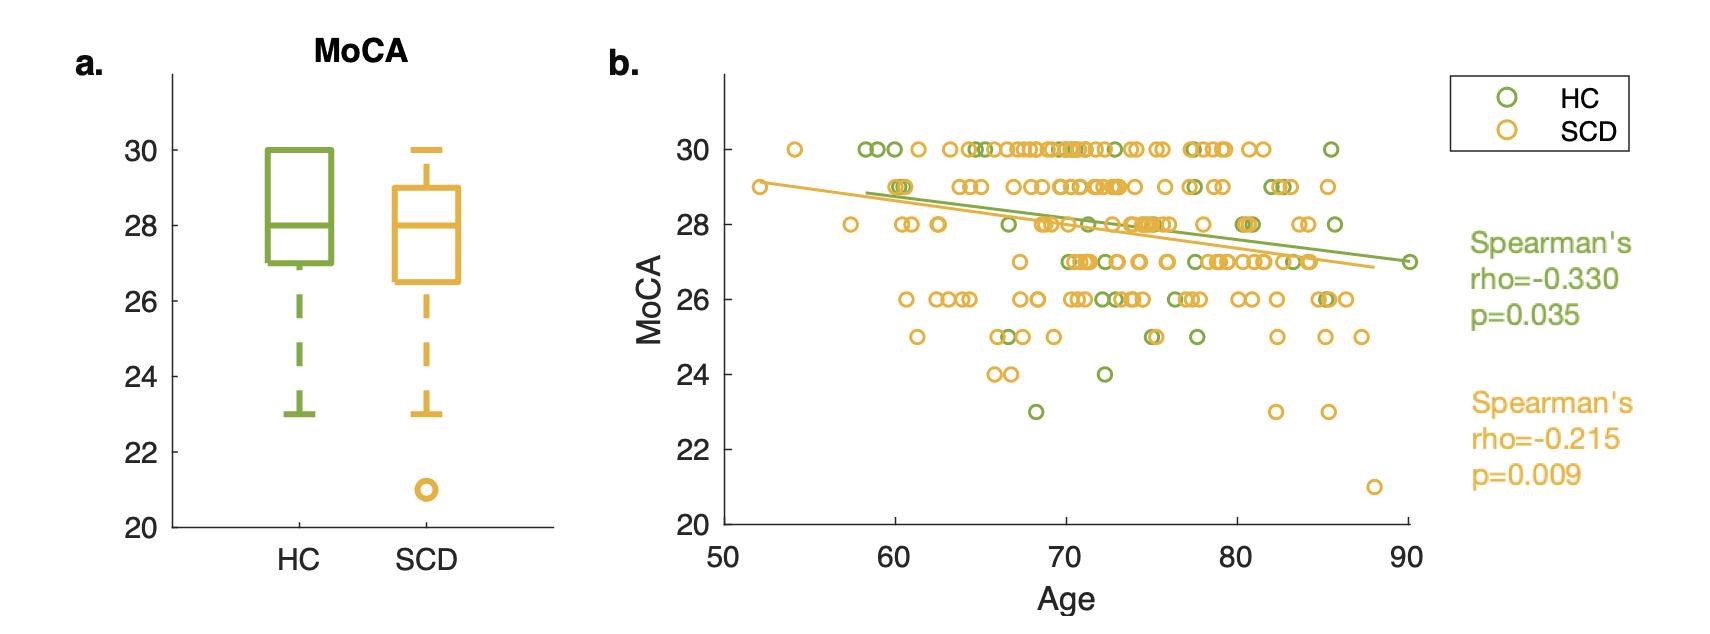
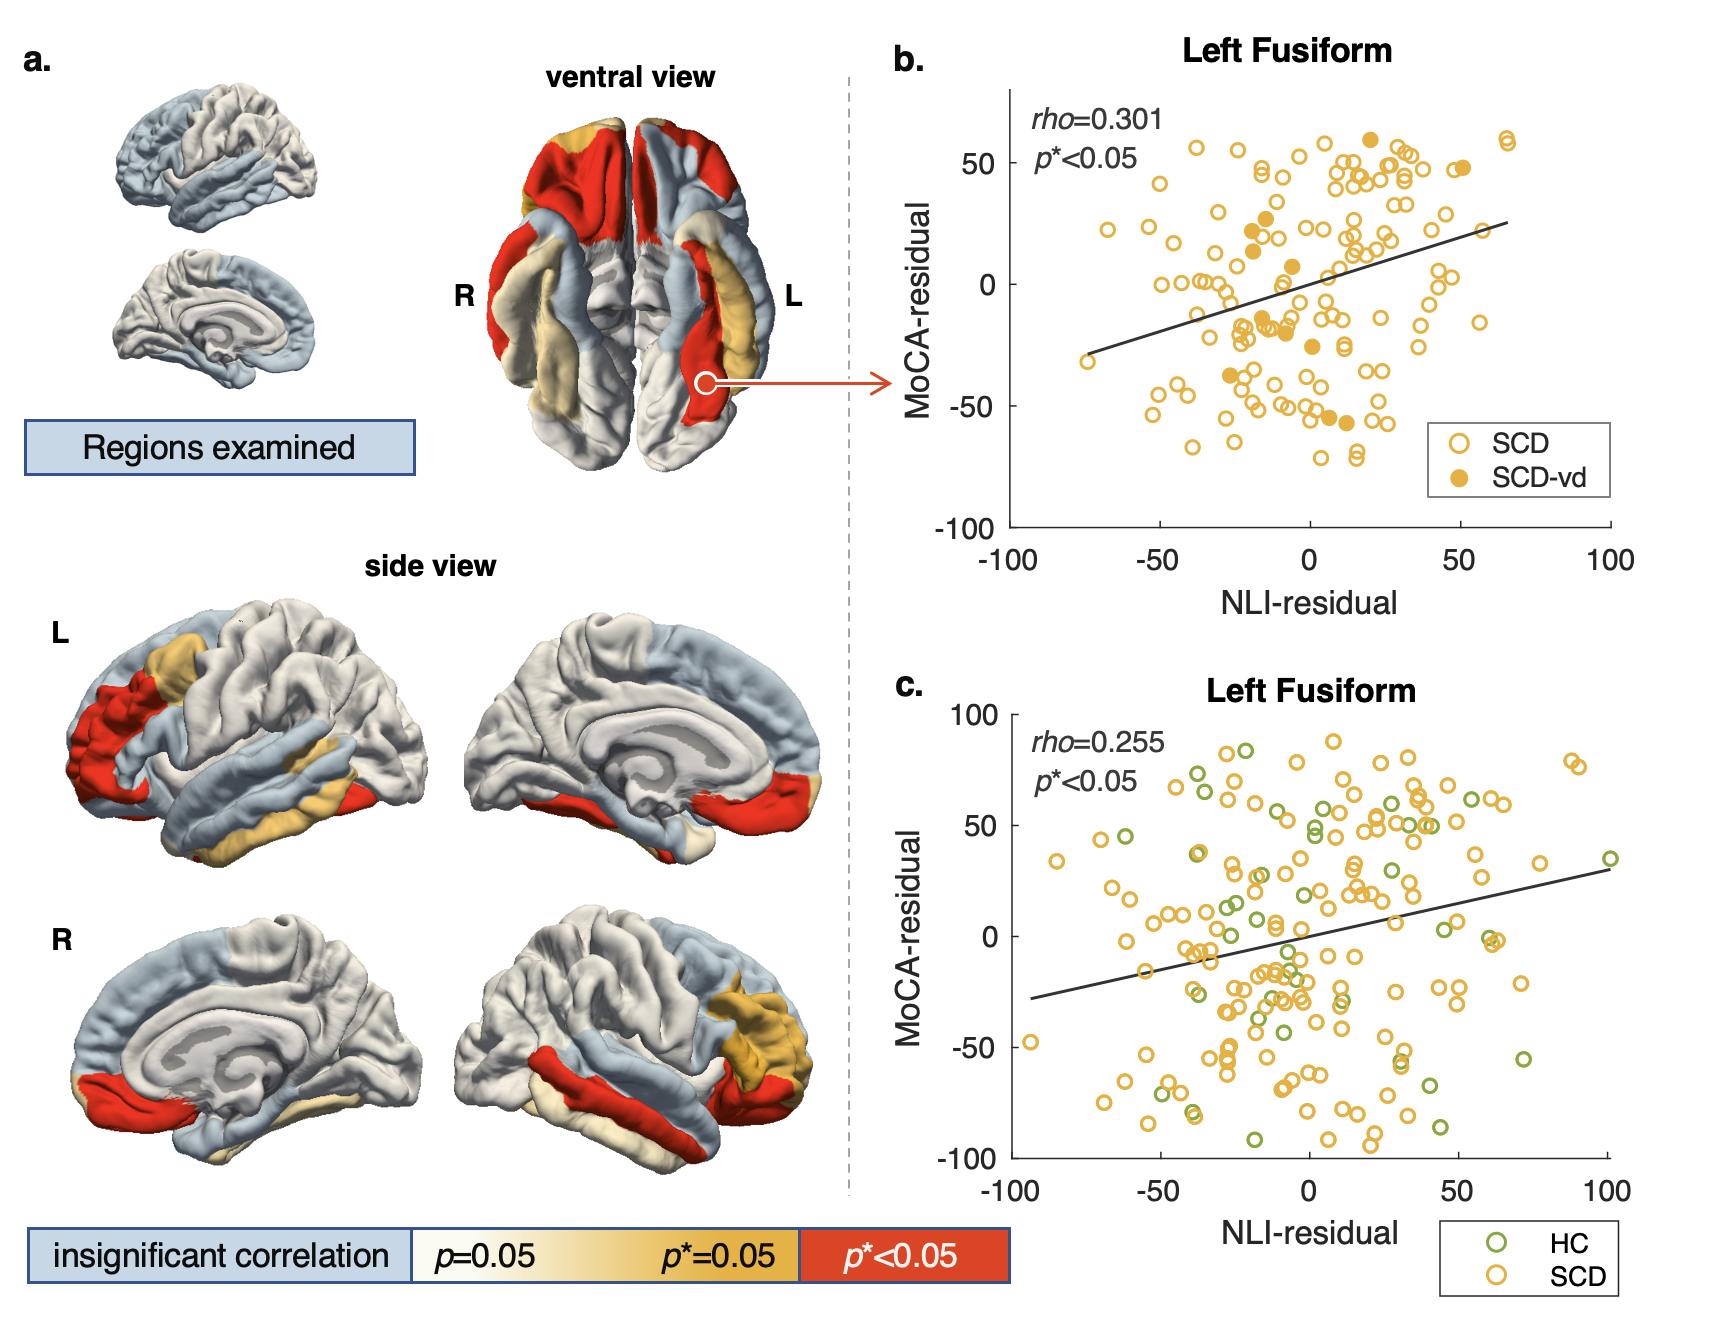
Associations between MoCA and MRI metrics were examined using Spearman’s correlation since the MoCA score distribution was skewed (Figure 2a). Analyses focused on frontal and temporal lobe regions (Figure 3a, light blue colored regions) because 1) they are frequently implicated in studies examining cognitive impairment in aging7, and 2) they have comparable T1w/T2w profiles that are curvier and therefore have higher NLI as compared with the parietal and occipital regions8,9. Correlation analyses of the MoCA score with NLI, CT, and volume, were conducted across 36 frontal and temporal subregions delineated by the Desikan-Killiany atlas. After correcting for multiple comparisons (Benjamini-Hochberg10), results were considered significant at corrected p (p*) less than 0.05.
Results
Age, education, and MoCA scores (Table 1, Figure 2a) were not significantly different between the HC and SCD groups. In addition, MoCA was found to inversely related to participants age in both groups, combined (Spearman's rho=0.23, p<0.05) or separated (Figure 2b).Within the SCD group, the cortical profile NLI was associated with the MoCA score controlling for age, education, and local CT. Shown in Figure 3a, the relationship was observed across frontal and temporal regions and remained significant after Benjamini-Hochberg correction in multiple ROIs including bilateral pars orbitalis and medial orbitofrontal, left fusiform and rostral middle frontal, and right middle temporal and lateral orbitofrontal regions (Figure 3b). Adding a binary covariate indicating whether the participant had vascular brain injury did not affect these findings (Figure 3b). The variation of NLI with MoCA appeared to be driven by changes in the shape of T1w/T2w cortical profiles in deep cortical layers (Figure 4).
No significant association between MoCA and NLI was found within the HC group, however, across the HC and SCD groups, similar relationships as in SCD were observed, although weakened. Specifically, significant correlations were found only in the left fusiform (Figure 3c), right medial and lateral orbitofrontal, and rostral middle frontal regions.
No significant correlation with the MoCA score was found for CT or cortical ROI volume in the examined areas for either HC or SCD or two groups combined.
Discussion
The current study revealed novel MRI correlates in the frontal and temporal cortices of the MoCA score in SCD participants. We showed that MoCA variations are associated with changes in the shape of T1w/T2w cortical profiles in several frontal and temporal regions. These changes may reflect structural and/or metabolic abnormalities in cortical gray matter potentially involving alterations in myelin and/or iron content. Similar associations with MoCA were not found for regional cortical thickness or volume, highlighting the added value of current cortical profile marker. Our findings suggest that neurostructural changes may take place in the cerebral cortex of SCD patients who are yet to be distinguished as memory impaired using objective memory tests such as MoCA.Acknowledgements
We thank all the participants who contributed their time and effort in the study, and the NYU Langone Alzheimer’s Disease Research Center for curating and providing the dataset and funding this research.References
1. Reisberg, B., et al., Retrogenesis: clinical, physiologic, and pathologic mechanisms in brain aging, Alzheimer's and other dementing processes. Eur Arch Psychiatry Clin Neurosci, 1999. 249 Suppl 3: p. 28-36.
2. Glasser, M.F. and D.C. Van Essen, Mapping human cortical areas in vivo based on myelin content as revealed by T1- and T2-weighted MRI. J Neurosci, 2011. 31(32): p. 11597-616.
3. Jessen, F., et al., A conceptual framework for research on subjective cognitive decline in preclinical Alzheimer's disease. Alzheimers Dement, 2014. 10(6): p. 844-52.
4. Blom, K., et al., Subjective cognitive decline, brain imaging biomarkers, and cognitive functioning in patients with a history of vascular disease: the SMART-Medea study. Neurobiology of Aging, 2019. 84: p. 33-40.
5. Reisberg, B., et al., The Global Deterioration Scale for assessment of primary degenerative dementia. Am J Psychiatry, 1982. 139(9): p. 1136-9.
6. Nasreddine, Z.S., et al., The Montreal Cognitive Assessment, MoCA: a brief screening tool for mild cognitive impairment. J Am Geriatr Soc, 2005. 53(4): p. 695-9.
7. Bartzokis, G., Age-related myelin breakdown: a developmental model of cognitive decline and Alzheimer’s disease. Neurobiology of Aging, 2004. 25(1): p. 5-18.
8. Sui, Y.V. and M. Lazar. Age-related alterations in cortical myelin profile using the Human Connectome Project Aging dataset. in Proc of ISMRM. 2021.
9. Nieuwenhuys, R., The myeloarchitectonic studies on the human cerebral cortex of the Vogt-Vogt school, and their significance for the interpretation of functional neuroimaging data. Brain Struct Funct, 2013. 218(2): p. 303-52.
10. Benjamini, Y. and Y. Hochberg, Controlling the false discovery rate: a practical and powerful approach to multiple testing. Journal of the Royal statistical society: series B (Methodological), 1995. 57(1): p. 289-300.
11. Coupe, P., et al., An optimized blockwise nonlocal means denoising filter for 3-D magnetic resonance images. IEEE Trans Med Imaging, 2008. 27(4): p. 425-41.
12. Manjon, J.V., et al., MRI superresolution using self-similarity and image priors. Int J Biomed Imaging, 2010. 2010: p. 425891.
Figures