0715
Unravelling the serotonergic contribution to citalopram-induced changes in functional connectivity1Department of Radiology and Nuclear Medicine, Amsterdam University Medical Center, University of Amsterdam, Amsterdam, Netherlands, 2Department of Neuroimaging, Institute of Psychiatry, King's College London, London, United Kingdom
Synopsis
While citalopram pharmacology has been extensively investigated and defined, the molecular mechanisms underlying brain functional response to this antidepressant are less well characterised. Therefore, we explored the functional response of the healthy brain to an acute citalopram challenge by enriching resting-state fMRI with molecular templates of serotonin neurotransmitters. We found that a high oral dose of citalopram induces significant alterations in 5-HT1A-enriched functional connectivity, and that serotonin transporter occupancy is linked with the interindividual functional response to citalopram in the SERT-related network. These findings set a new basis for a mechanistic understanding of the functional effects of citalopram in depression.
Introduction
Selective serotonin reuptake inhibitors (SSRIs), such as citalopram, are used for the treatment of depression and anxiety disorders. Many human studies using nuclear medicine techniques have extensively shown that citalopram’s primary mechanism of action involves blocking the serotonin transporter (5-HTT)1. Despite not having any significant affinity for other serotonergic receptors, some studies have shown that the 5-HT1A receptor also plays an important role in its antidepressant effect2.While citalopram pharmacology has been extensively investigated, its effects on brain function are less well understood. Pharmacological MRI has allowed us to capture both primary and downstream effects of citalopram, but as such it provides limited insight into the underlying molecular targets involved in the brain’s functional response to this drug6. Therefore, in this study, we enrich our resting state fMRI analysis with molecular information about the distribution density of serotonin receptors in the brain using REACT6 to investigate the involvement of 5-HTT and 5-HT1A receptors in the functional connectivity changes induced by citalopram.
Methods
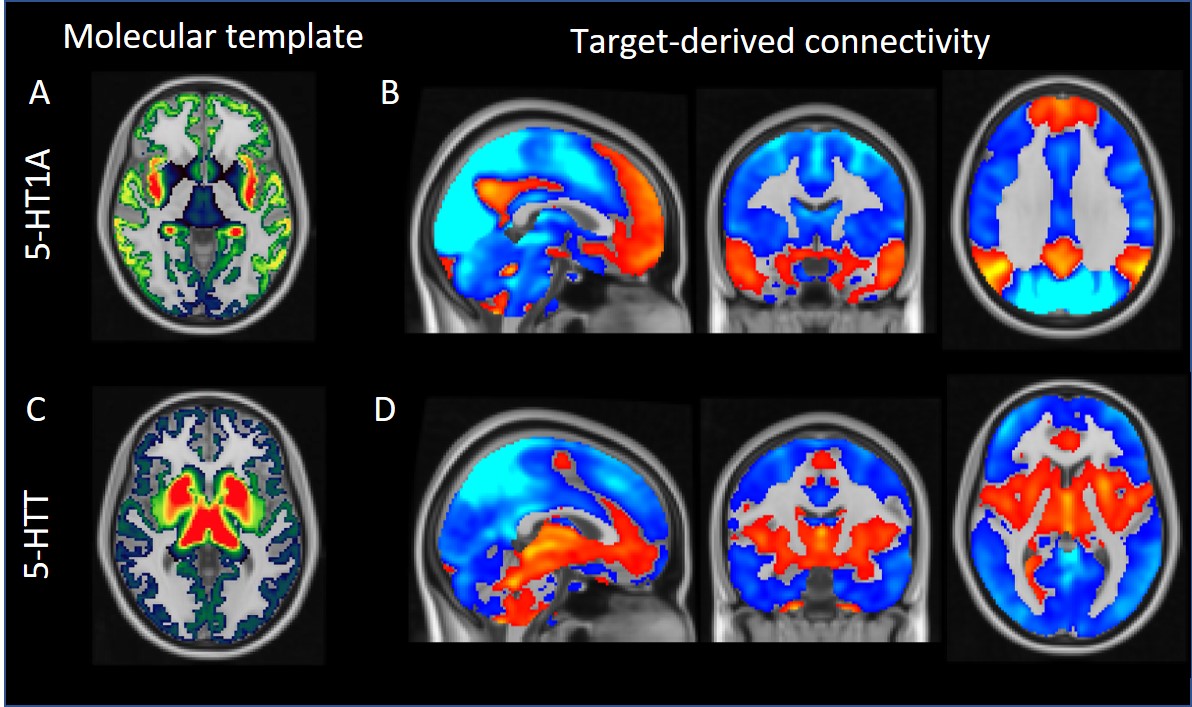
Forty-five healthy female volunteers (mean age=21.6y) participated in a double-dose study4,5 and received pre-treatment with placebo (N = 15), low (4 mg; ‘low group’; N = 15) or clinically standard (16 mg; ‘high group’; N = 15) oral dose of citalopram, in order to respectively occupy 0%, ~40% and ~80% of 5-HTT5. Subsequently, they underwent a SPECT scan with [123I]FP-CIT. After the SPECT scan, subjects underwent a rs-fMRI scan, acquired using a 3.0T Ingenia (Philips) equipped with a 32-channel receive-only head-coil. Rs-fMRI data were acquired for approximately 9 minutes using a T2*-weighted gradient-echo EPI sequence using the following parameters: TR/TE=2150/27ms; FOV=240x240x131mm, voxel size=3x3x3 mm; gap=0.3mm; flip angle=76.2°; dynamics=240. Rs-fMRI data were preprocessed using fMRIPrep 20.0.6 (RRID:SCR_016216, RRID:SCR_002502) with ICA-AROMA to detect and remove motion-related artifacts. Subsequently, WM and CSF signals were regressed out and a high-pass temporal filter applied (cut-off=0.005Hz). Then, the high-resolution in vivo atlas of 5-HT1A and 5-HTT7 was used to enrich the rs-fMRI analysis with the distribution density of these proteins in the healthy brain. The functional circuits associated with both serotonin targets were estimated for each subject using the react-fmri package. The subject-specific target-enriched spatial maps were compared between groups (placebo vs low group, placebo vs high group, low group vs high group) using permutation tests in Randomise (1000 permutations, pFWE < 0.05 corrected with threshold-free cluster enhancement). In addition, we assessed whether the dose-response relationship was linear or U-shaped. Since citalopram predominantly binds to the SERT in the thalamus, linear relationships of the target-enriched FC maps with thalamic [123I]FP-CIT binding potential (reflecting 5-HTT availability) were also assessed using Randomise to link pharmacokinetics and pharmacodynamics and evaluate dose-concentration-response relationships.Results
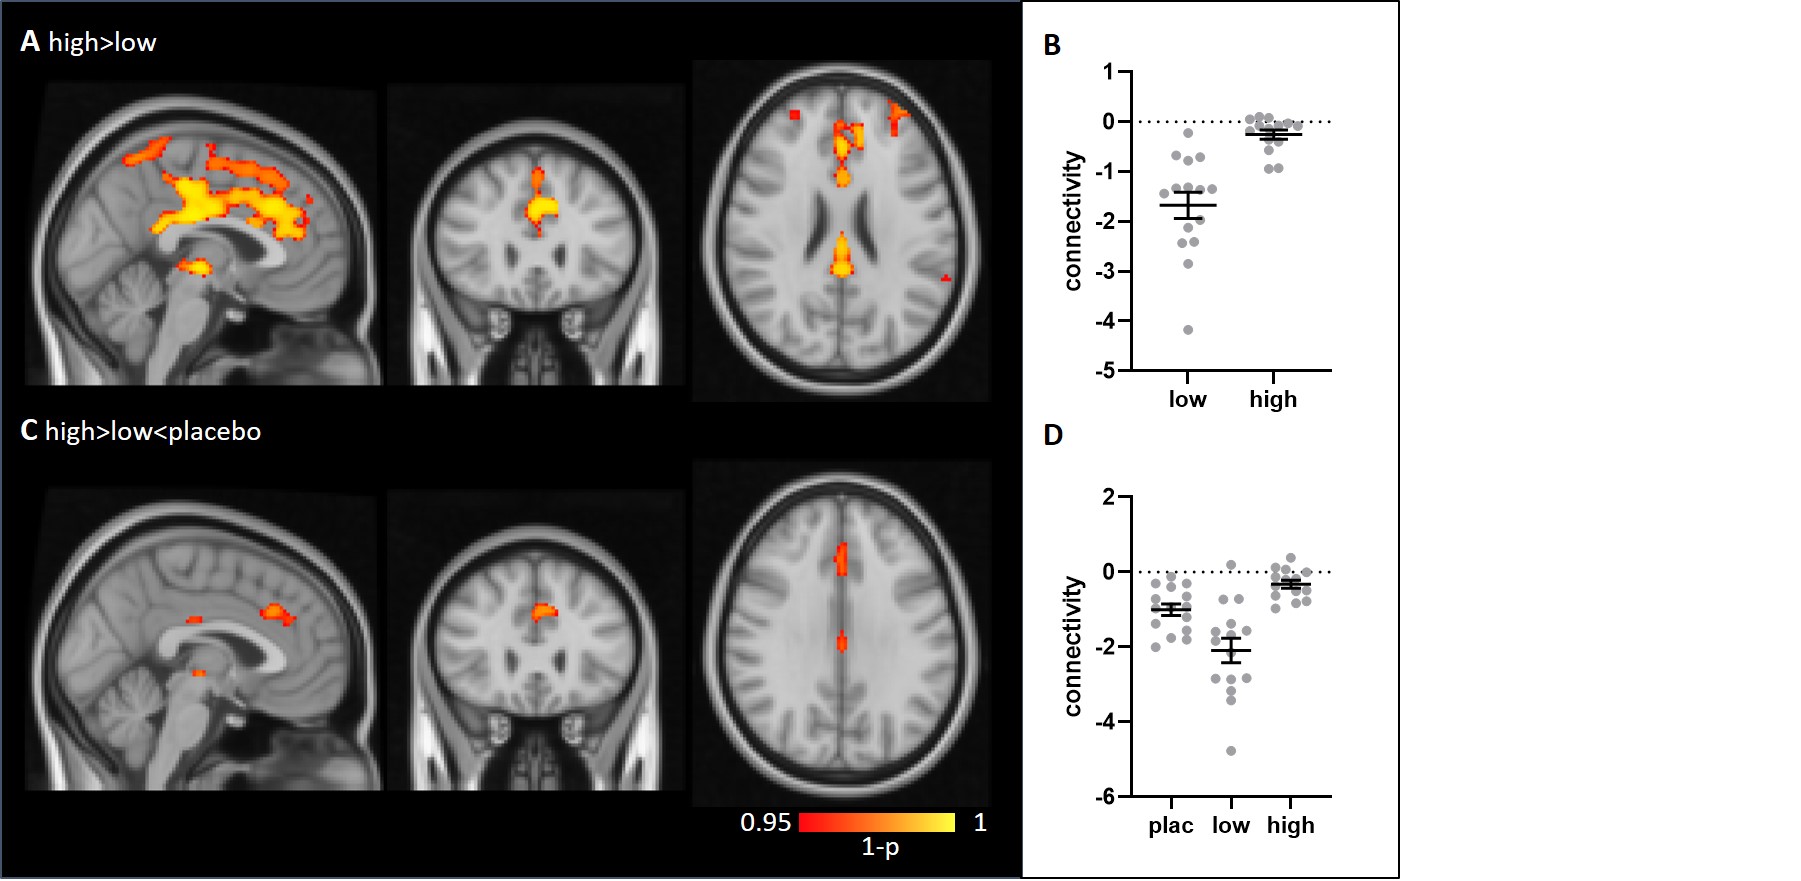
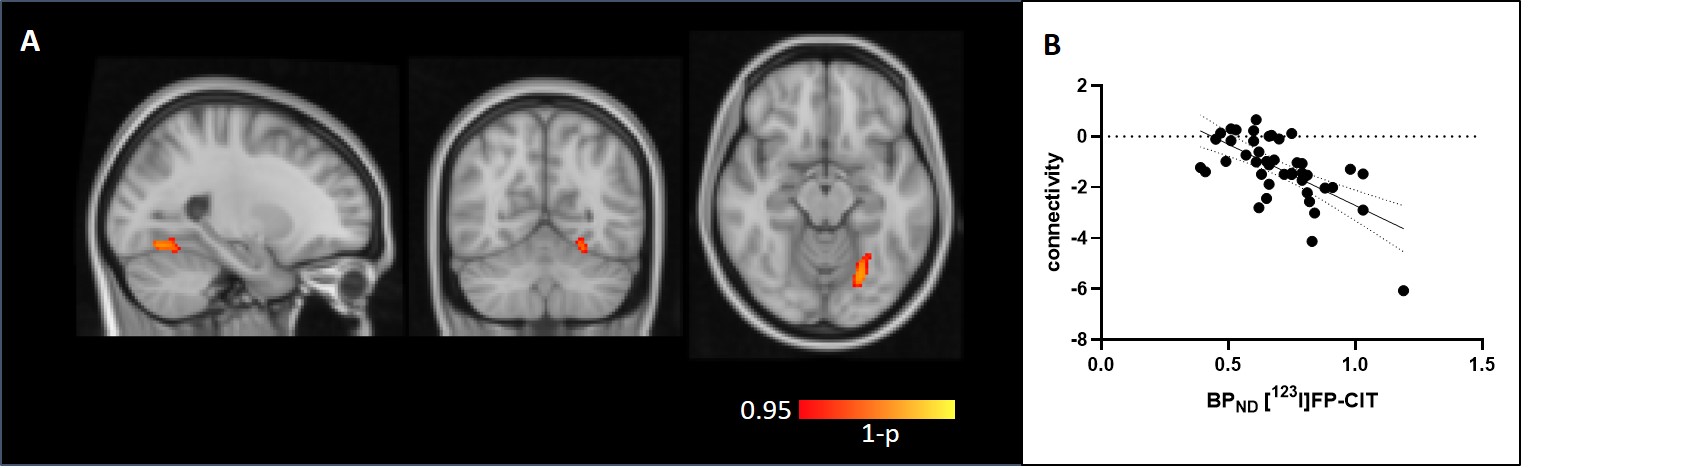
The molecular atlases of the 5-HTT and 5-HT1A receptor and the corresponding target-enriched functional connectivity maps averaged across subjects are displayed in Figure 1. Interestingly, we found significant group differences in the 5HT1A-enriched FC maps (high dose > low dose), localised in the cingulate gyrus, precuneus, frontal pole, temporal gyri and lateral occipital cortex (Figure 2). Additionally, we found an U-shaped relation with dose (plac>low<high) in the anterior cingulate and paracingulate gyri. In contrast to our expectations, no significant between-group differences in the 5-HTT enriched FC maps were detected. However, we were able to identify a significant negative association between the thalamic [123I]FP-CIT binding potential and the interindividual functional response to citalopram associated to 5-HTT in the (temporal-)occipital fusiform gyrus and lingual gyrus, such that subjects with higher thalamic 5-HTT availability had lower functional connectivity in the 5-HTT-enriched maps (Figure 3).Discussion and Conclusions
This study highlights a direct link between the pharmacokinetic and pharmacodynamic response of the healthy brain to an acute citalopram challenge, linking 5-HTT occupancy with concurrent modulations of its functional pathway. Specifically, we identified an inverse relationship between the 5-HTT binding in the thalamus and interindividual functional connectivity of the occipital and temporal areas in the 5-HTT-enriched circuit.The administration of a single dose of citalopram in healthy subjects is also known to be associated with with altered serotonin release via initial inhibitory mechanisms based on raphe 5-HT1A autoreceptor activation8. Some studies have shown that such molecular mechanisms result in an altered functional connectivity of the default mode network4,9. In this study, we identified the 5-HT1A-enriched functional circuit, whose main areas overlap with the ventral DMN, and were able to show that an acute citalopram administration mainly targets this circuit. This finding supports the hypothesis that 5-HT1A is directly linked with the antidepressant effects of SSRIs and paves the way to the use of molecular-based strategies for studying the functional effects of citalopram in depression.
Acknowledgements
No acknowledgement found.References
[1] Meyer JH, Wilson AA, Sagrati S, Hussey D, Carella A, Potter WZ, Ginovart N, Spencer EP, Cheok A, Houle S. Serotonin transporter occupancy of five selective serotonin reuptake inhibitors at different doses: an [11C]DASB positron emission tomography study. Am J Psychiatry. 2004 May;161(5):826-35. doi: 10.1176/appi.ajp.161.5.826. PMID: 15121647.
[2] Carhart-Harris RL, Nutt DJ. Serotonin and brain function: a tale of two receptors. J Psychopharmacol. 2017 Sep;31(9):1091-1120. doi: 10.1177/0269881117725915. Epub 2017 Aug 31. PMID: 28858536; PMCID: PMC5606297.
[3] McKie S, Del-Ben C, Elliott R, Williams S, del Vai N, Anderson I, Deakin JF. Neuronal effects of acute citalopram detected by pharmacoMRI. Psychopharmacology (Berl). 2005 Aug;180(4):680-6. doi: 10.1007/s00213-005-2270-y. Epub 2005 May 12. PMID: 15889241.
[4] Schrantee A, Lucassen PJ, Booij J, Reneman L. Serotonin transporter occupancy by the SSRI citalopram predicts default-mode network connectivity. Eur Neuropsychopharmacol. 2018 Oct;28(10):1173-1179. doi: 10.1016/j.euroneuro.2018.07.099. Epub 2018 Aug 4. PMID: 30082141.
[5] Schrantee A, Solleveld MM, Schwantje H, Bruin WB, Mutsaerts HM, Adriaanse SM, Lucassen P, Booij J, Reneman L. Dose-dependent effects of the selective serotonin reuptake inhibitor citalopram: A combined SPECT and phMRI study. J Psychopharmacol. 2019 Jun;33(6):660-669. doi: 10.1177/0269881119836229. Epub 2019 Mar 19. PMID: 30887865; PMCID: PMC6572584.
[6] Dipasquale O, Selvaggi P, Veronese M, Gabay AS, Turkheimer F, Mehta MA. Receptor-Enriched Analysis of functional connectivity by targets (REACT): A novel, multimodal analytical approach informed by PET to study the pharmacodynamic response of the brain under MDMA. Neuroimage. 2019 Jul 15;195:252-260. doi: 10.1016/j.neuroimage.2019.04.007. Epub 2019 Apr 4. PMID: 30953835; PMCID: PMC6547164.
[7] Beliveau V, Ganz M, Feng L, Ozenne B, Højgaard L, Fisher PM, Svarer C, Greve DN, Knudsen GM. A High-Resolution In Vivo Atlas of the Human Brain's Serotonin System. J Neurosci. 2017 Jan 4;37(1):120-128. doi: 10.1523/JNEUROSCI.2830-16.2016. PMID: 28053035; PMCID: PMC5214625.
[8] Selvaraj S, Turkheimer F, Rosso L, Faulkner P, Mouchlianitis E, Roiser JP, McGuire P, Cowen PJ, Howes O. Measuring endogenous changes in serotonergic neurotransmission in humans: a [11C]CUMI-101 PET challenge study. Mol Psychiatry. 2012 Dec;17(12):1254-60. doi: 10.1038/mp.2012.78. Epub 2012 Jun 5. PMID: 22665264.
[9] Arnone D, Wise T, Walker C, Cowen PJ, Howes O, Selvaraj S. The effects of serotonin modulation on medial prefrontal connectivity strength and stability: A pharmacological fMRI study with citalopram. Prog Neuropsychopharmacol Biol Psychiatry. 2018 Jun 8;84(Pt A):152-159. doi: 10.1016/j.pnpbp.2018.01.021. Epub 2018 Feb 1. PMID: 29409920; PMCID: PMC5886357.
Figures