0714
Increased structural connectivity in high schizotypy: a possible protective mechanism against schizophrenia.1Psychology, Cardiff University, Cardiff, United Kingdom, 2Medicine, Cardiff University, Cardiff, United Kingdom
Synopsis
This work explores the link between brain structural connectivity and schizotypy in healthy participants. We found evidence of higher structural connectivity in the sensorimotor network of high-schizotypy participants compared to those with low schizotypy. Weaker evidence was also found for alterations in the auditory, default-mode and visual networks. In contrast, no significant differences were found in the structural connectivity of the whole-brain or limbic networks. The higher connectivity possibly shields these participants from schizophrenia. Our results agree with the results of works proposing that deficiencies in the sensorimotor brain network should be investigated as possible causes for schizophrenia.
Introduction
Schizophrenia is a serious psychiatric disorder of unknown aetiology. Schizotypy encompasses a set of stable personality traits that reflect the subclinical expression of schizophrenia. Studying schizotypy can reveal characteristics (in the brain of healthy high-schizotypy participants) which protect or compensate against schizophrenia. Those characteristics can be used to inform treatment1,2. The whole-brain3, default-mode4,5,6,7, sensorimotor8,9,10, limbic11,12, auditory13 and visual10 networks are altered in schizophrenia patients compared to healthy controls. Additionally, schizophrenia patients have increased radial diffusivity (RD) in their white matter tracts compared to healthy controls14. An increase in RD, although non-specific, can be influenced by decrease in myelination or in axonal density15,16,17. In this study we used tractography-derived structural brain networks, with the edges weighted by the inverse RD, and investigated possible differences in the brain networks of healthy participants with varying schizotypy scores.Methods
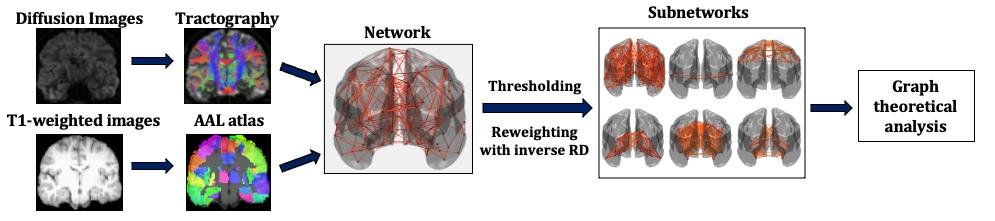
Data collection: 148 healthy participants (101 female, 18-55 years old, mean=24.6 years, SD=5.2 years) were scanned on a GE Signa HDx 3T MRI scanner at the Cardiff University Brain Research Imaging Centre (CUBRIC). T1-weighted structural data were acquired using an axial three-dimensional FSPGR sequence (TR/TE=8/3ms, 1mm isotropic resolution). Diffusion-weighted MRI data were acquired using a peripherally cardiac-gated sequence with b=1,200s/mm2 along 30 unique, isotropically distributed gradient orientations (TR/TE=20s/90ms, 2.4mm isotropic resolution). Three images with no diffusion weighting were also acquired. The diffusion images were co-registered to the T1-weighted images. Free-water, head movement and eddy current distortion corrections were performed. The participants answered the Schizotypal Personality Questionnaire, through which their schizotypy score was calculated.Tractography: Probabilistic streamline tractography was performed using MRtrix18. Four million streamlines were generated for each participant, with the seed points within the white matter.
Network construction: The AAL atlas19 was used to identify the 90 areas of the cerebrum that formed the nodes of the structural brain networks. The edges of the networks were the white-matter tracts connecting the brain areas. Edges with fewer than NSthr number of streamlines (NS) were removed; the analysis was repeated for NSthr ranging from 5 to 80, to ascertain that any statistically significant results were not due to the threshold choice. Edges that survived thresholding were reweighted with the inverse mean RD calculated along the voxels spanning the corresponding white-matter tracts. Networks were constructed for the whole-brain, auditory, sensorimotor, visual, default-mode and limbic systems. Four graph theoretical metrics, namely the mean node degree, mean clustering coefficient, mean nodal strength and characteristic path length, were calculated for all six networks using the Brain Connectivity Toolbox20.
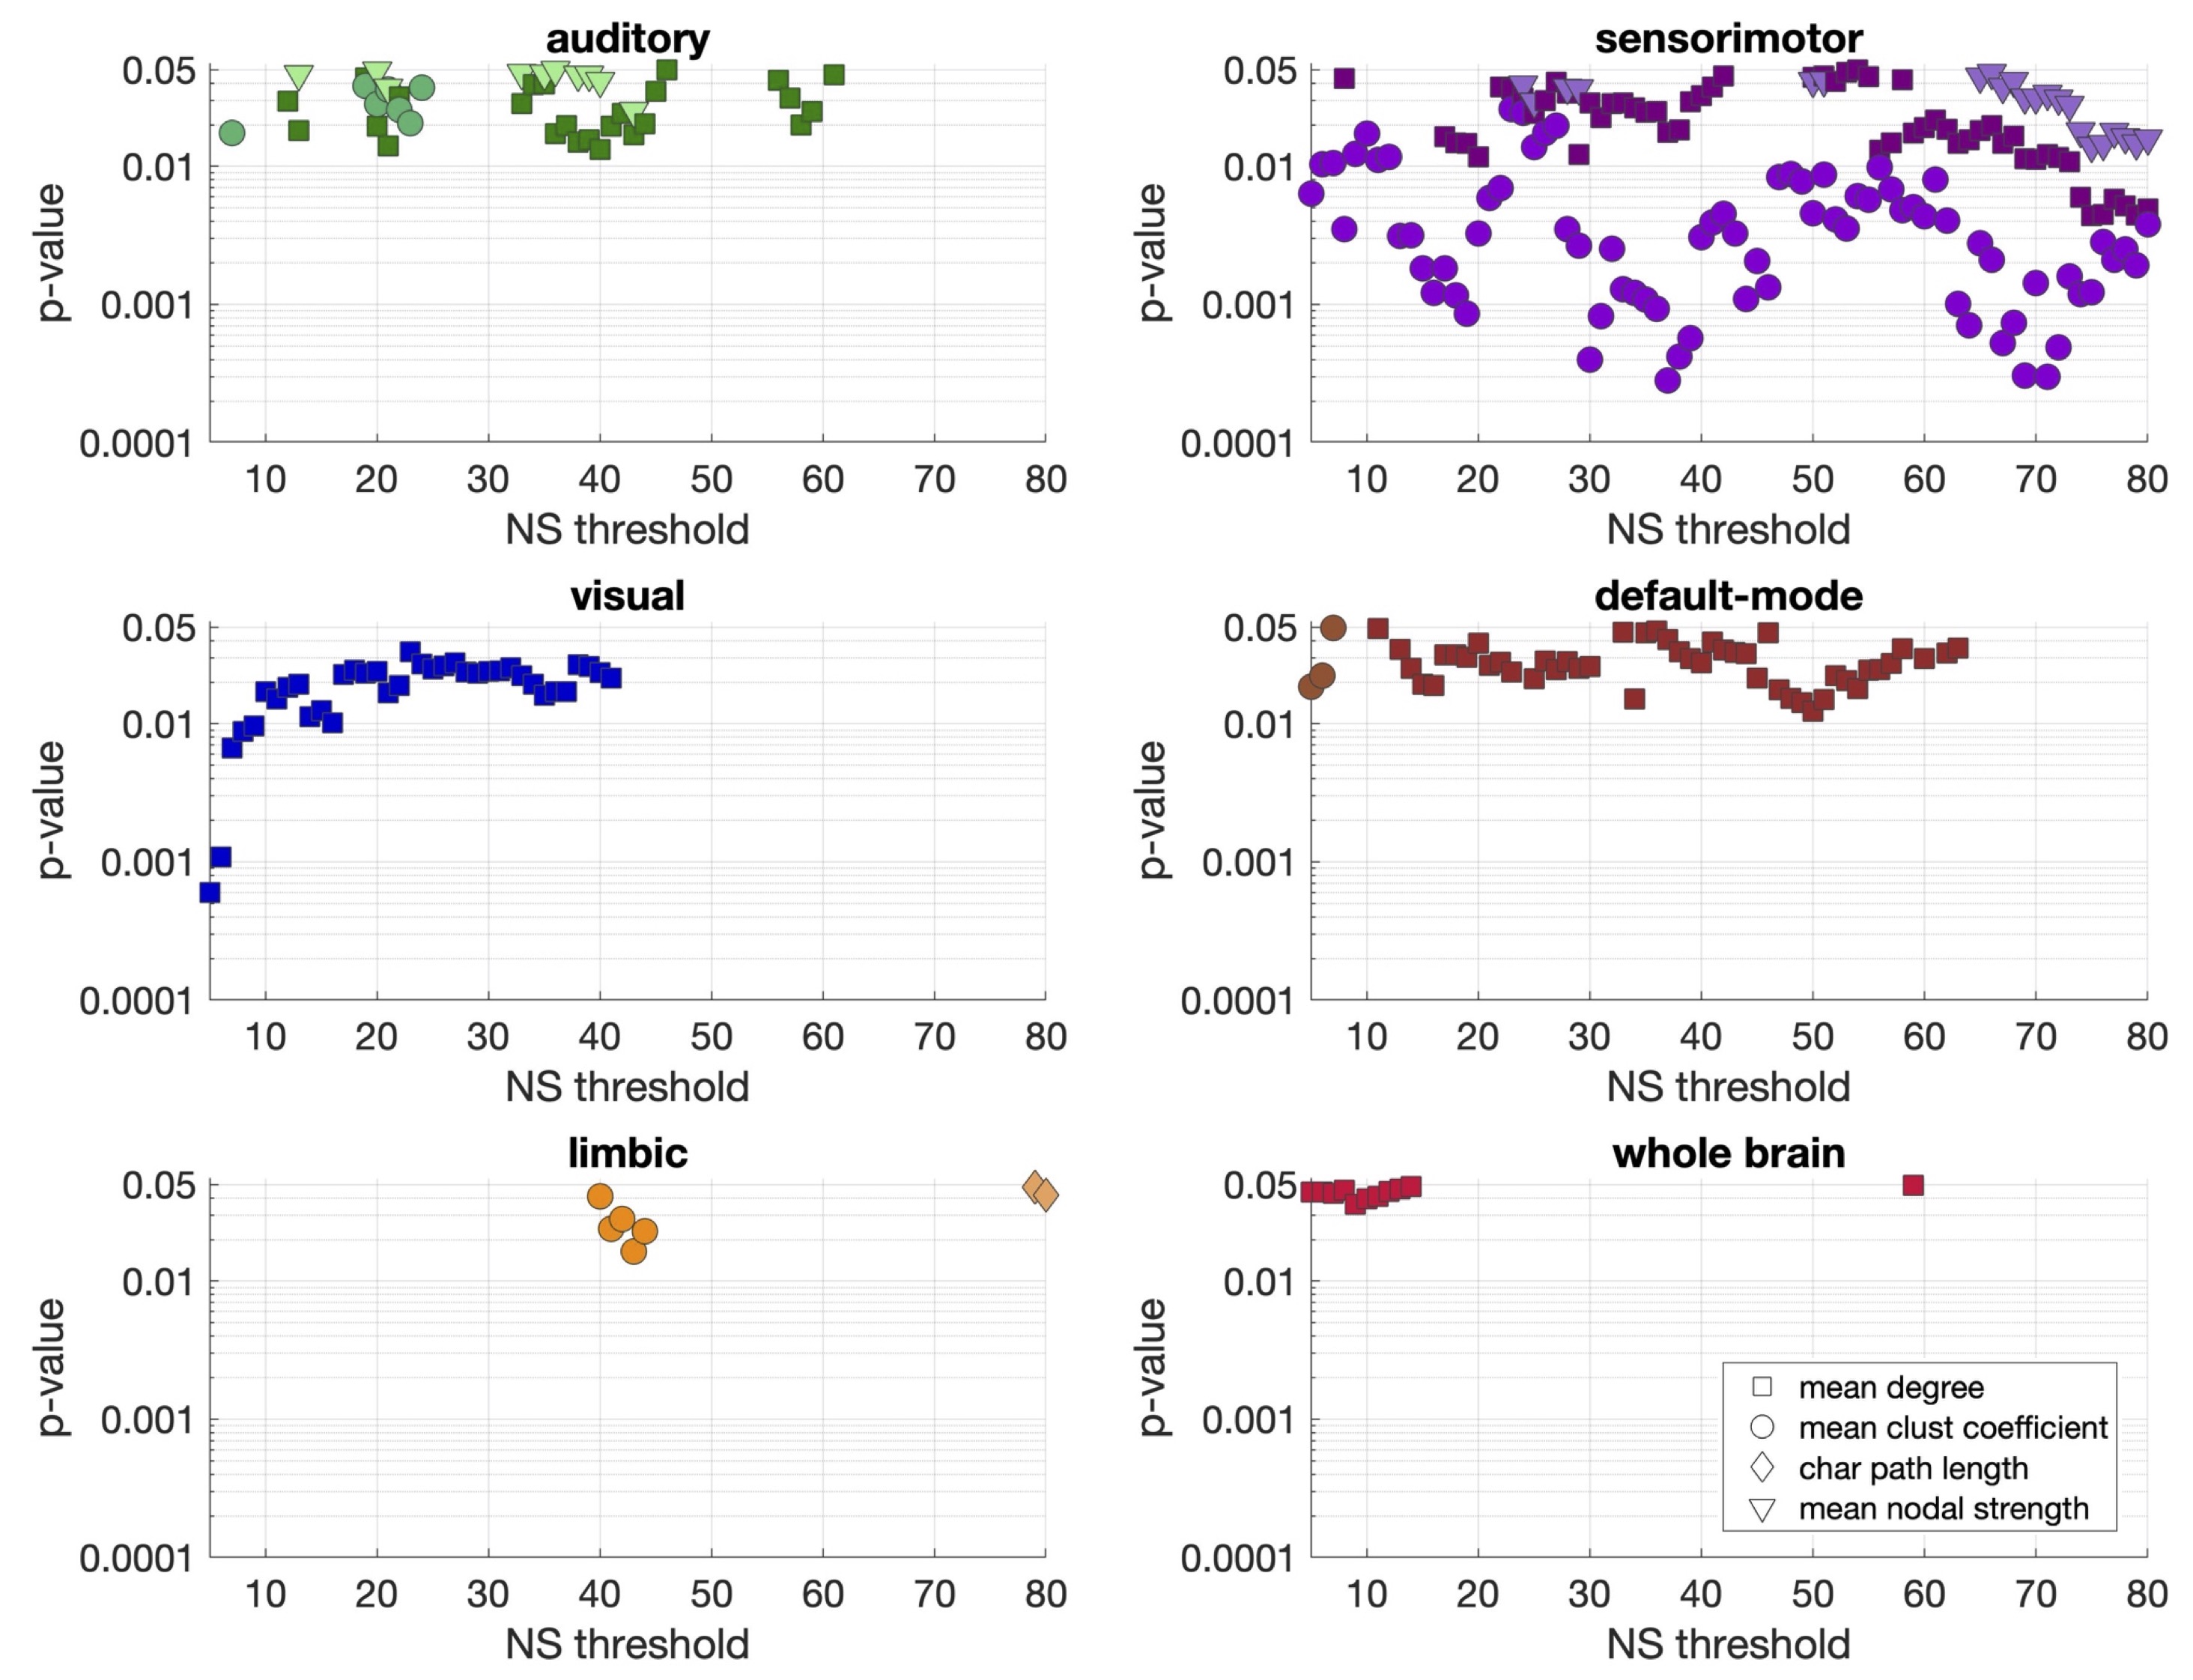
Statistical analysis: Partial correlation coefficients were calculated between the schizotypy score and the graph theoretical metrics of the participants, correcting for age and sex. Outliers with Cook's distance larger than 5 times the mean Cook’s distance21 were removed from the analysis - this resulted in the exclusion of up to 5 participants, depending on the NSthr. The resulting p-values were corrected for multiple comparisons using the false-discovery-rate algorithm22, applied over all four graph theoretical metrics for all six networks.
The analysis pipeline is shown in Fig. 1.
Results
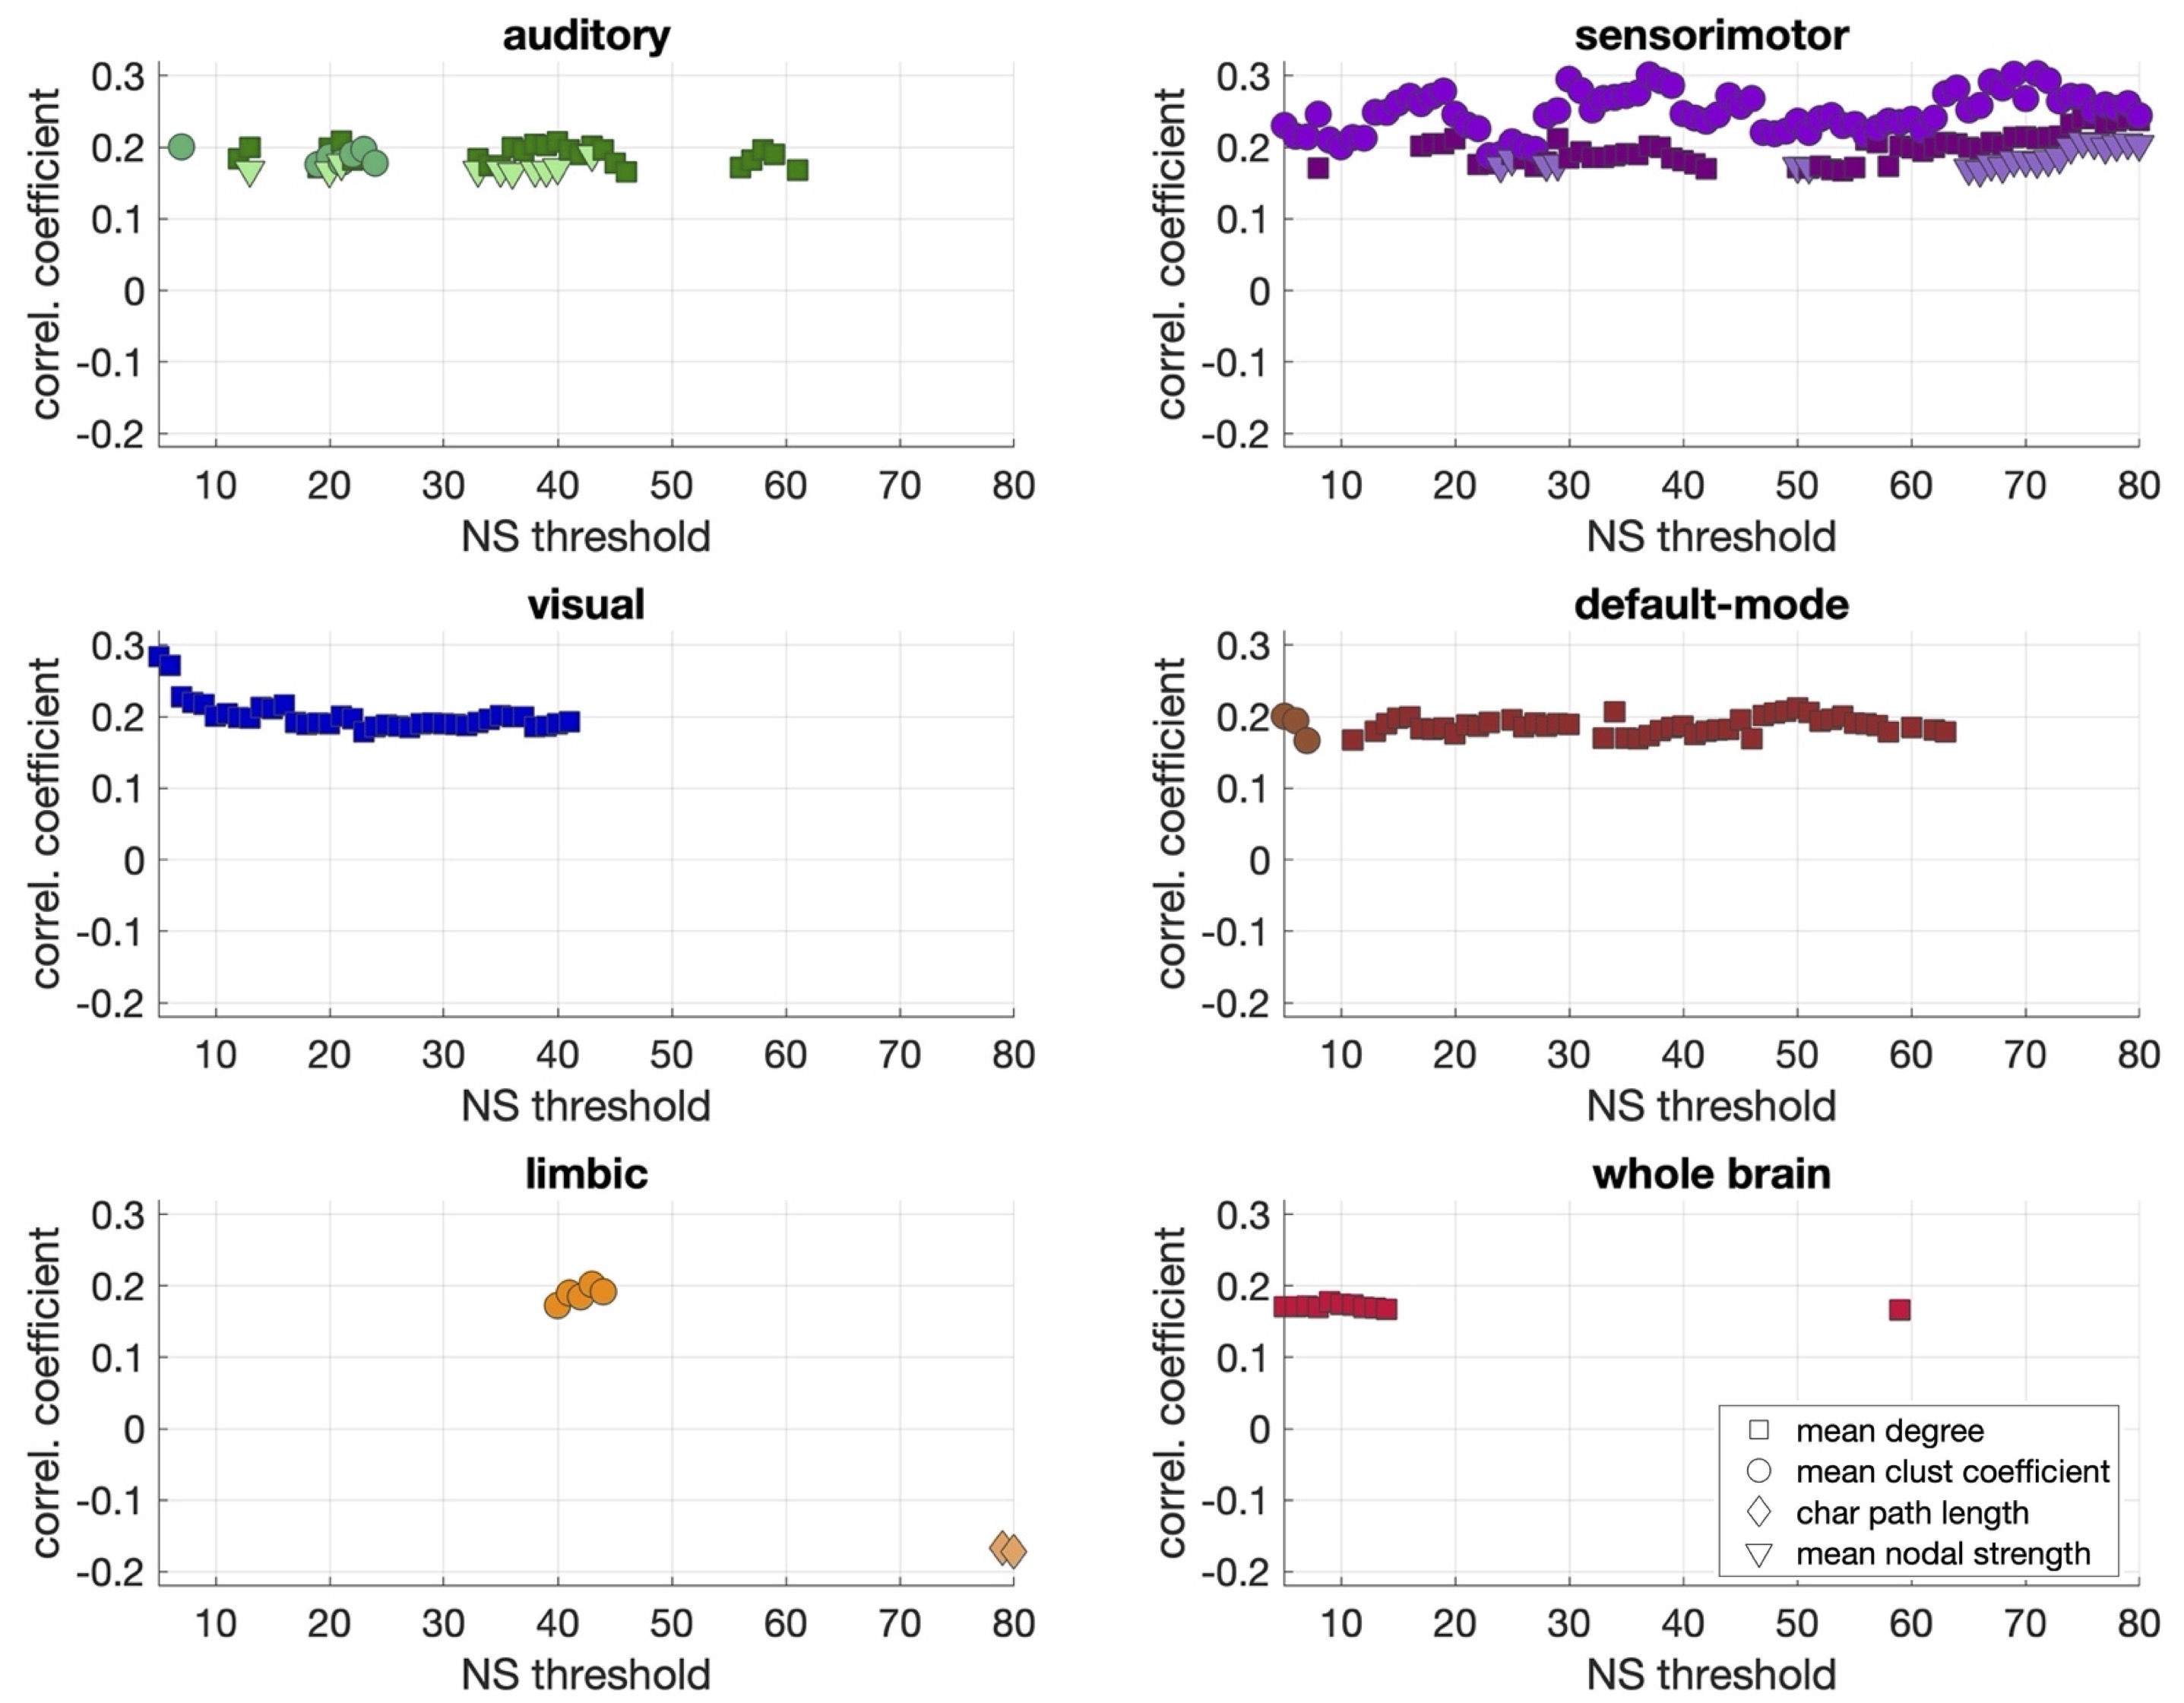
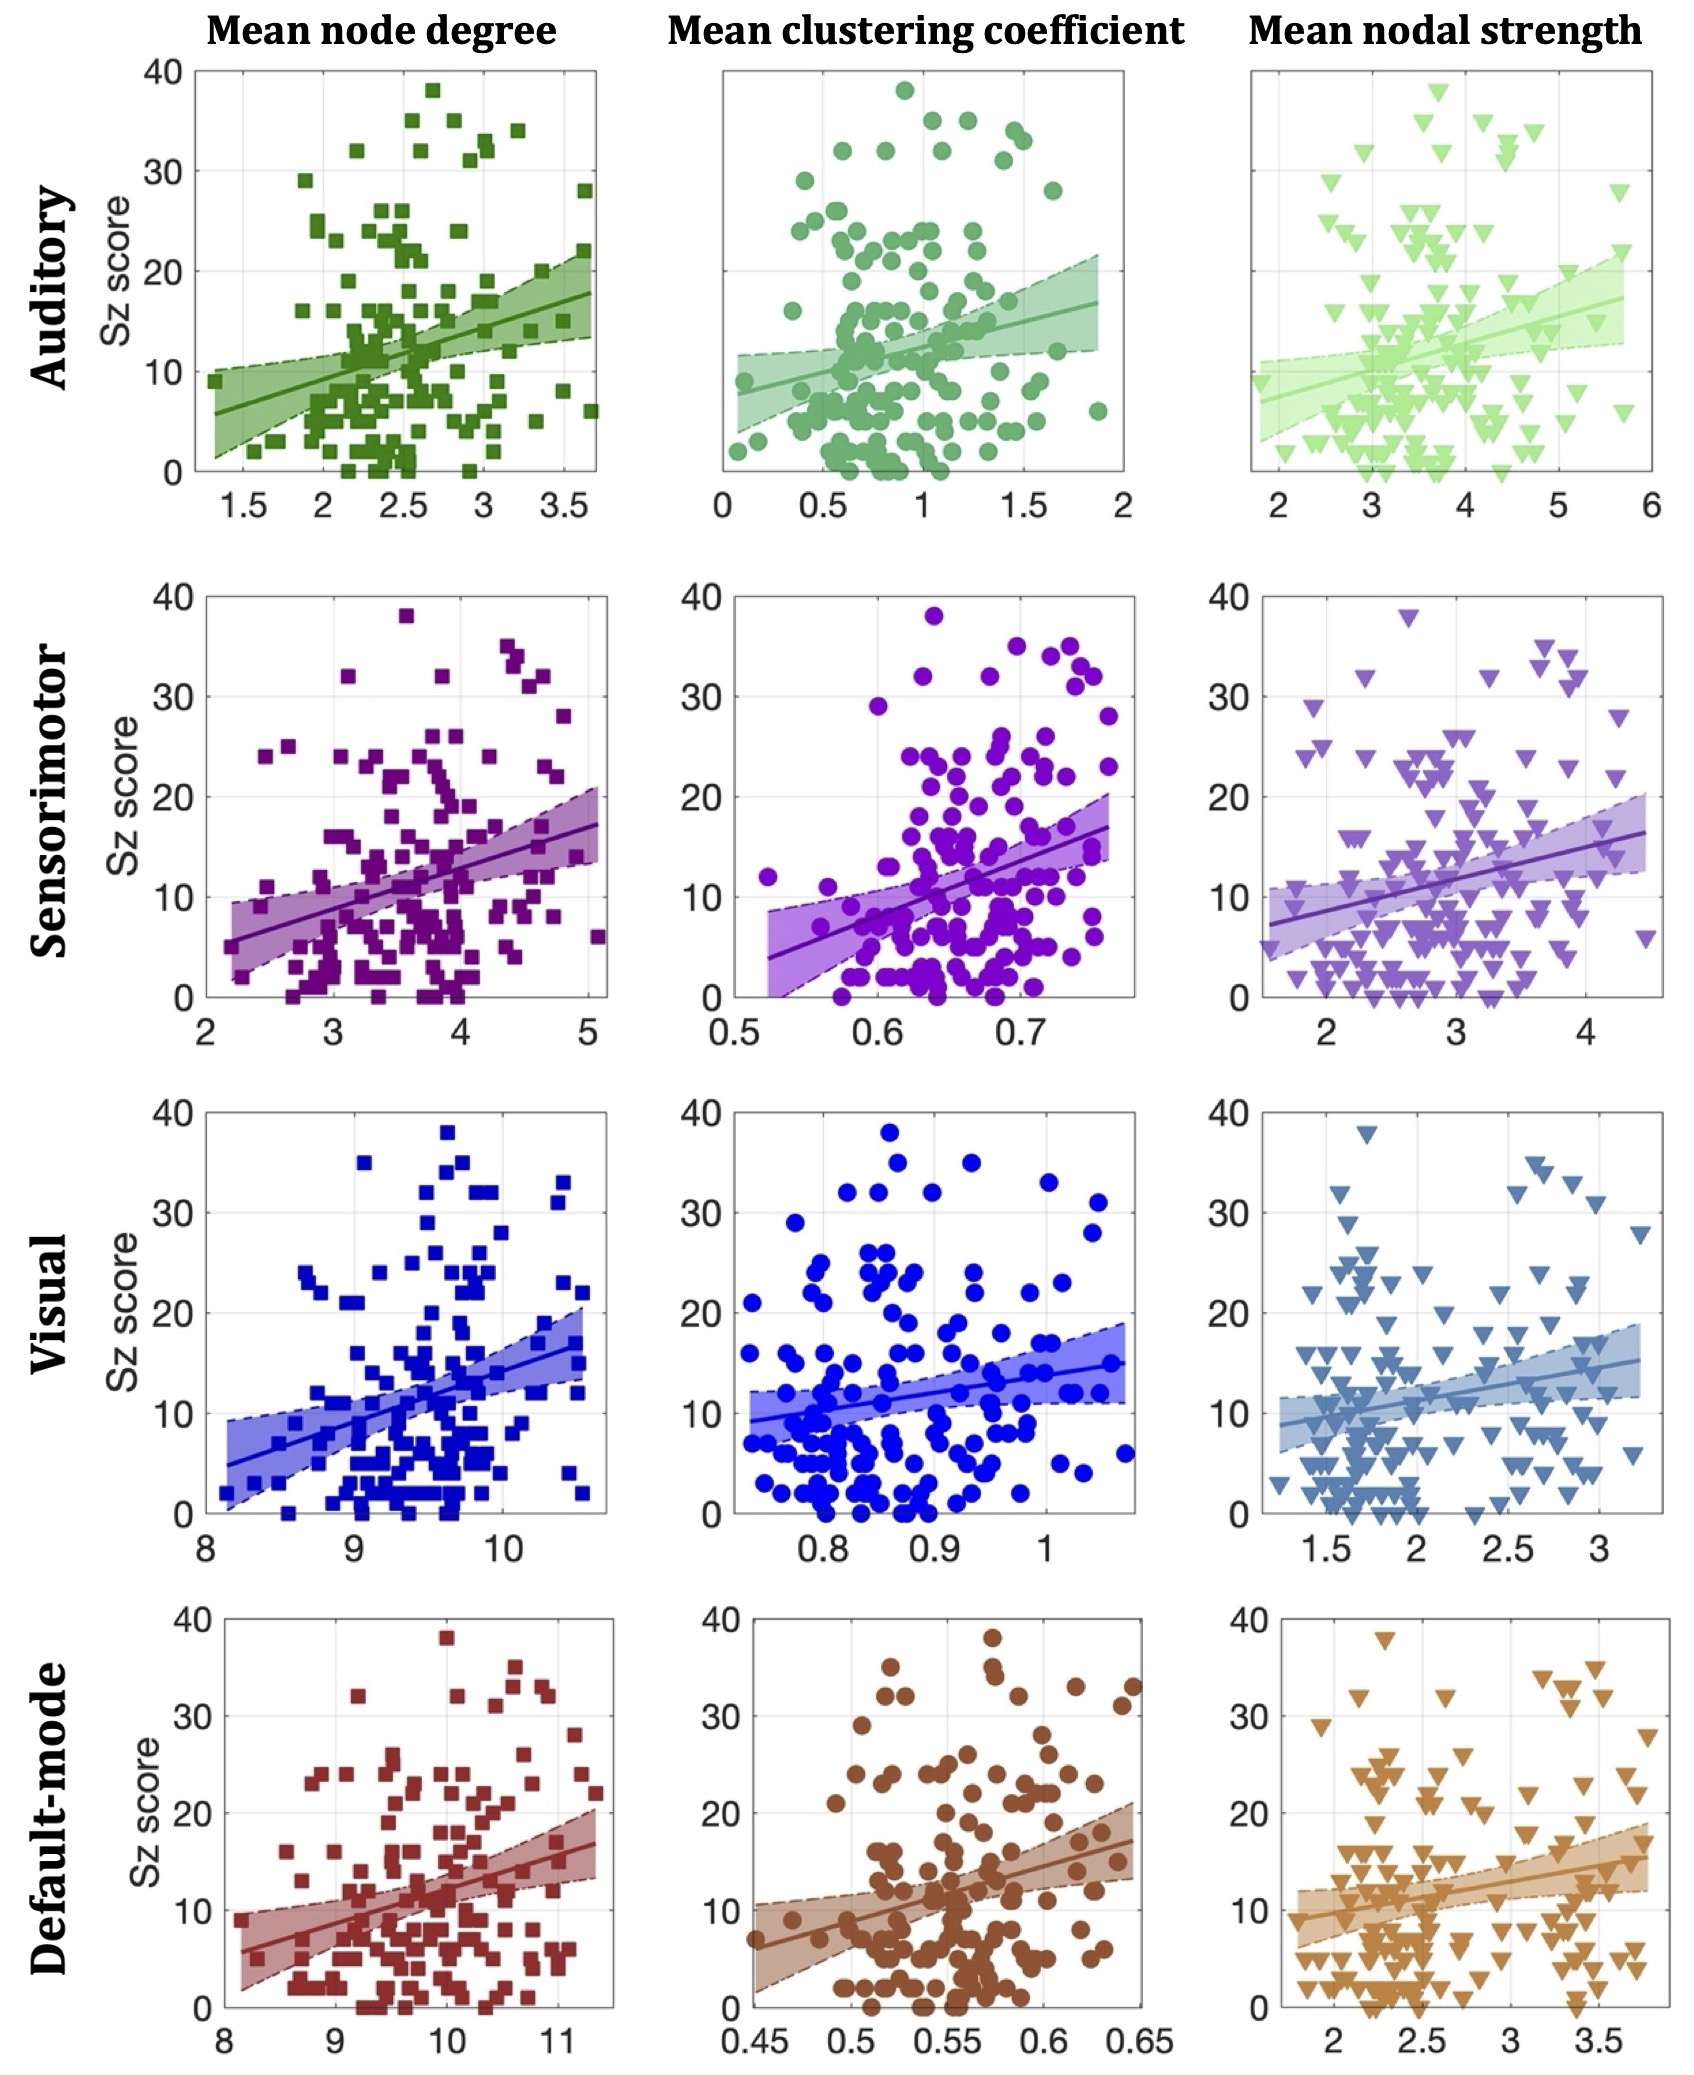
Statistically significant positive correlations that survived multiple comparison correction and persisted across NSthr were identified between schizotypy score and the mean node degree, mean clustering coefficient and mean nodal strength of the sensorimotor network. A statistically significant positive correlation between the schizotypy score and the mean node degree of the auditory, visual and the default-mode networks was found, which persisted across NSthr. No other correlations surviving multiple comparison correction persisted across NSthr. The correlation coefficients and p-values are shown in Fig. 2 and 3 respectively. Scatter plots for the correlations of the three graph theoretical metrics for which those persisted across NSthr, namely the mean node degree, mean clustering coefficient and mean nodal strength, for the four networks are shown in Fig. 4.Discussion
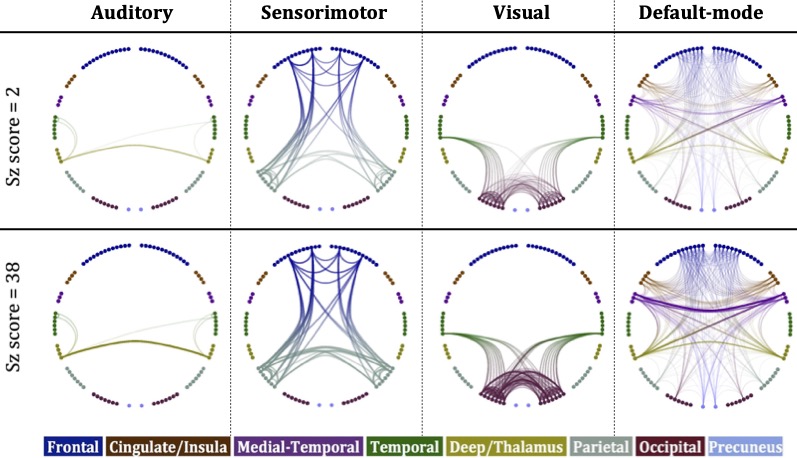
Our results provide evidence that high-schizotypy healthy participants have higher structural connectivity in the sensorimotor network, with some increases also present in the auditory, visual and default-mode networks. In Fig. 5 we compare these four networks for two male, 25-year old participants, with schizotypy scores of 2 and 38.The edges of the networks were weighted by the inverse RD, which may partly reflect differences in myelination or axon density. Both myelination and axon density promote effective communication in the brain. Therefore, our results support the notion that increased connectivity in healthy high-schizotypy participants could be enhancing communication and thus protecting against schizophrenia. Our results agree with a recent study23 which showed that increased structural connectivity (not derived from graph theory) could be a compensatory mechanism against schizophrenia.
Conclusions
Increased structural connectivity in high-schizotypy healthy participants could shield them from schizophrenia. Treatment trials focusing on the connectivity and myelination of the sensorimotor, visual, auditory and default-mode networks could provide therapeutic targets for schizophrenia patients. The persistent correlations in the sensorimotor network, along with the fact that sensorimotor regions are implicated in action observation and imitation24, functions that are crucial for successful social interactions, indicate that deficiencies in the sensorimotor network should be further investigated as causes of schizophrenia. Diffusion MRI sequences that employ higher b-values and thus are more sensitive to axonal density and myelination should be used in similar studies in the future.Acknowledgements
EM is supported by a Wellcome Trust ISSF Research Fellowship at Cardiff University (204824/Z/16/Z). SF was supported by a Wellcome Trust ISSF award at Cardiff University. DKJ was supported by a Wellcome Trust Investigator Award (096646/Z/11/Z) and a Wellcome Trust Strategic Award (104943/Z/14/Z).
References
1. U. Ettinger, C. Mohr, D. C. Gooding, A. S. Cohen, A. Rapp, C. Haenschel, S. Park. Cognition and brain function in Schizotypy: a selective review. (2015) Schizophrenia Bulletin, 41:S417-S426.
2. U. Ettinger. I. Meyhöfer, M. Steffens, M. Wagner, N. Koutsouleris. Genetics, cognition, and neurobiology of schizotypal personality: a review of the overlap with schizophrenia. (2014) Frontiers in Psychiatry, 5:18.
3. J. Kambeitz, L. Kambeitz-Ilankovic, C. Cabral, D. B. Dwyer, V. D. Calhoun, M. P. van den Heuvel, P. Falkai, N. Koutsouleris, B. Malchow. Aberrant functional whole-brain network architecture in patients with schizophrenia: a meta-analysis. (2016) Schizophrenia Bulletin, 42:S13-S21.
4. A. Pankow, L. Deserno, M. Walter, T. Fydrich, F. Bermpohl, F. Schlagenhauf, A. Heinz. Reduced default mode network connectivity in schizophrenia patients. (2015) Schizophrenia Research, 165(1):90-93.
5. R. Landin-Romero, P. J. McKenna, P. Salgado-Pineda, S. Sarrό, C. Aquirre, C. Sarri, A. Compte, C. Bosque, J. Blanch, R. Salvador, E. Pomarol-Clotet. Failure of deactivation in the default mode network: a trait marker of schizophrenia? (2014) Psychological Medicine, 45(6):1315-1325.
6. H. Wang, L.-L. Zeng, Y. Chen, H. Yin, Q. Tan, D. Hu. Evidence of a dissociation pattern in default mode subnetwork functional connectivity in schizophrenia. (2015) Scientific Reports, 5:14655.
7. A. Kottaram, L. A. Johnston, L. Cocchi, E. P. Ganella, I. Everall, C. Pantelis, R. Kotagiri, A. Zalesky. Brain network dynamics in schizophrenia: reduced dynamism of the default mode network. (2019) Human Brain Mapping, 40:2212-2228.
8. T. Kaufmann, K. C. Skåtun, D. Alnæs, N. T. Doan, E. P. Duff, S. Tønnesen, E. Roussos, T. Ueland, S. R. Aminoff, T. V. Lagerberg, I. Agartz, I. S. Melle, S. M. Smith, O. A. Andreassen, L. T. Westlye. Disintegration of sensorimotor brain networks in schizophrenia. (2015), Schizophrenia Bulletin, 41(6): 1326-1335.
9. R. A. Berman, S. J. Gotts, H. M. McAdams, D. Greenstein, F. Lalonde, L. Clasen, R. E. Watsky, L. Shora, A. E. Ordonez, A. Raznahan, A. Martin, N. Gogtay, J. Rapoport. Disrupted sensorimotor and social-cognitive networks underlie symptoms in childhood-onset schizophrenia. (2016) Brain, 139(1): 276-291.
10. A. M. Jimenez, P. Riedel, J. Lee, E. A. Reavis, M. F. Green. Linking resting-state networks and social cognition in schizophrenia and bipolar disorder. (2019) Human Brain Mapping, 40:4703-4715.
11. K. Stegmayer, S. Bohlhalter, T. Vanbellingen, A. Federspiel, R. Wiest, R. M. Müri, W. Strik, S. Walther. Limbic interference during social action planning in schizophrenia. (2018) Schizophrenia Bulletin, 44(2):359-368.
12. P. Lin, X. Wang, B. Zhang, B. Kirkpatrick, D. Öngür, J. J. Levitt, J. Jovicich, S. Yao, X. Wang. Functional dysconnectivity of the limbic loop of frontostriatal circuits in first-episode, treatment-naive schizophrenia. (2017) Human Brain Mapping, 39:747-757.
13. S. Li, N. Hu, W. Zhang, B. Tao, J. Dai, Y. Gong, Y. Tan, D. Cai, S. Lui. Dysconnectivity of multiple brain networks in schizophrenia: a meta-analysis of resting-state functional connectivity. (2019) Frontiers in Psychiatry, 10:482.
14. S. W. Joo, W. Yoon, S.-H. Shon, H. Kim, S. Cha, K. J. Park and L. Lee. Altered white matter connectivity in patients with schizophrenia: An investigation using public neuroimaging data from SchizConnect. (2018) PLoS One, 13(10), e0205369.
15. Y. Chen, H. An, H. Zhu, T. Stone, J. K. Smith, C. Hall, E. Bullitt, D. Shen, W. Lin. White matter abnormalities revealed by diffusion tensor imaging in non-demented and demented HIV+ patients. (2009) NeuroImage, 47:1154–1162
16. M. D. Cykowski, P. T. Fox, R. J. Ingham, J. C. Ingham, D. A. Robin. A study of the reproducibility and etiology of diffusion anisotropy differences in developmental stuttering: a potential role for impaired myelination. (2010) NeuroImage, 52:1495–1504.
17. D. K. Jones, T. R. Knösche and R. Turner. White matter integrity, fiber count and other fallacies: the do’s and dont’s of diffusion MRI. (2013) NeuroImage, 73:239-254.
18. J.-D. Tournier, R. E. Smith, D. Raffelt, R. Tabbara, T. Dhollander, M. Pietsch, D. Christiaens, B. Jeurissen, C.-H. Yeh, A. Connelly. MRtrix3: A fast, flexible and open software framework for medical image processing and visualisation. (2019) NeuroImage, 202:116-37.
19. N. Tzourio-Mazoyer, B. Landeau, D. Papathanassiou, F. Crivello, O. Etard, N. Delcroix, B. Mazoyer, M. Joliot. Automated anatomical labeling of activations in SPM using a macroscopic anatomical parcellation of the MNI MRI single-subject brain. (2002) NeuroImage, 15(1):273-289.
20. M. Rubinov and O. Sporns. Complex network measures of brain connectivity: uses and interpretations. (2010) NeuroImage. 52(3): 1059-1069.
21. R. D. Cook. Detection of influential observations in linear regression. (1977) Technometrics, 19(1):15-18.
22. Y. Benjamini and D. Yekutieli. The control of the false discovery rate in multiple testing under dependency. (2001) The Annals of Statistics, 29(4): 1165-1188.
23. Y.-M. Wang, X.-L. Cai, R.-T. Zhang, Y.-J. Zhang, H.-Y. Zhou, Y. Wang, Y. Wang, J. Huang, Y.-Y. Wang, E. F. C. Cheung, R. C. K. Chan. Altered brain structural and functional connectivity in schizotypy. (2020) Psychological Medicine, 1-10.
24. S. Caspers, K. Zilles, A. R. Laird, S. B. Eickhoff. ALE meta-analysis of action observation and imitation in the human brain. (2010) NeuroImage, 50(3):1148–1167.
Figures