0713
A novel deep learning framework on brain functional networks for diagnosis of psychiatric diseases
Milad Mashhady Ali Poury 1, Ali Ameri 1, Saeed Masoudnia 2, Hosna Tavakoli2,3, Faezeh Ghasemi4,5, Reza Rostami6, and Mohammad-Reza Nazem-Zadeh2,7
1Department of Biomedical Engineering, Shahid Beheshti University of Medical Sciences, Tehran, Iran (Islamic Republic of), 2Research Center for Molecular and Cellular Imaging, Tehran University of Medical Sciences, Tehran, Iran (Islamic Republic of), 3cognitive neuroscience, Institute for Cognitive Science Studies, Tehran, Iran (Islamic Republic of), 4Medical Physics and Engineering, Shahid Beheshti University of Medical Sciences, Tehran, Iran (Islamic Republic of), 5Research Center for Biomedical Technologies and Robotics, Tehran University of Medical Sciences, Tehran, Iran (Islamic Republic of), 6Department of Psychology, University of Tehran, Tehran, Iran (Islamic Republic of), 7Medical Physics and Biomedical Engineering, Tehran University of Medical Sciences, Tehran, Iran (Islamic Republic of)
1Department of Biomedical Engineering, Shahid Beheshti University of Medical Sciences, Tehran, Iran (Islamic Republic of), 2Research Center for Molecular and Cellular Imaging, Tehran University of Medical Sciences, Tehran, Iran (Islamic Republic of), 3cognitive neuroscience, Institute for Cognitive Science Studies, Tehran, Iran (Islamic Republic of), 4Medical Physics and Engineering, Shahid Beheshti University of Medical Sciences, Tehran, Iran (Islamic Republic of), 5Research Center for Biomedical Technologies and Robotics, Tehran University of Medical Sciences, Tehran, Iran (Islamic Republic of), 6Department of Psychology, University of Tehran, Tehran, Iran (Islamic Republic of), 7Medical Physics and Biomedical Engineering, Tehran University of Medical Sciences, Tehran, Iran (Islamic Republic of)
Synopsis
We developed a predicting algorithm based on brain connectivity to quantify the altered brain regions in schizophrenia, bipolar, and attention deficit hyperactivity disorders, to help diagnose them using neuroimaging biomarkers. Functional connectivity was utilized to construct brain graphs, on which the node2vec framework was applied to produce the node embeddings. The concatenation of embeddings was used to derive the region feature vectors to feed support vector machine (SVM) classifiers. Also, we build a model to assist the diagnosis of disorders using a weighted voting ensemble. The achieved accuracy proved to outperform to the state-of-the-art models.
Introduction
Schizophrenia (SZ) is a severe psychiatric illness characterized by aberrant sensory perception cognition 1. Bipolar Disorder (BP) is a serious mental disorder characterized by severe fluctuations in mood ranging from manic to depression 2. Attention deficit hyperactivity disorder (ADHD) is, on the other hand, a mental disorder mainly characterized by attention deficits, excessive activity, and behavioral impulses, most prevalent in young children 3. Despite significant research focusing on mental disorders, the mechanisms underlying these disorders are still not completely understood. Consequently, the diagnostic approaches may not be completely specific and reliable. With the recent advance in clinical neuroimaging and availability of medical imaging devices, promising results are obtained in specific diagnoses for SZ, BP, and ADHD patients, for which both medical and behavioral presentations may be confusing4-6. The diagnosis of these diseases and also monitoring their progression or regression can be facilized by means of neuroimaging modalities, such as functional magnetic resonance imaging (fMRI), by which functional connectivity (FC) pattern of the brain can be reconstructed. FC has successfully identified fundamental differences between patients and healthy control subjects.Materials and Methods
Rs-fMRI datasets are accessed from the UCLA Consortium for Neuropsychiatric Phenomics (CNP) dataset 7, which is publicly available in the OpenfMRI database. Data from fifty healthy subjects, as well as fifty SZ and BP each, and forty ADHD patients were inspected during a quality control process. The fMRI data were preprocessed in MATLAB using SPM8 8 and the package of data processing & analysis for brain imaging (DPARSF) 9. Automated anatomical labeling (AAL) atlas was used to identify the brain regions of interest (ROI). As a result of Pearson’s correlation (PC) between time series of brain regions, a 116 × 116 correlation matrix was generated to define the relationship amongst different regions of brain and match to the FC network. The FC can be modeled as a weighted graph using the graph theory, where the weak weights are eliminated by setting the values below a specified threshold to zero and retaining the rest. Recent developments in deep learning, especially in natural language processing, have led several studies to extend language models to graph representation learning. The node2vec algorithm 10 aims to learn a vectorial representation of nodes in a graph by optimizing a neighborhood preserving objective. It has been inspired by the word embedding algorithm word2vec, expanding the prior node embedding algorithm “Deep Walk” 11. The node2vec employs a second-order random walk algorithm to calculate the node’ neighborhood network. It generally consists of three steps: sampling, training skip-gram, and computing embedding This random walk results in a bag of nodes of a neighborhood from sampling by use of flexible biased random walks on the network. The bag of nodes is generated from the random walks and is fed into the skip-gram network. Each node is represented by a one-hot vector and maximizes the probability for predicting the neighbor nodes. The hidden layer output of the network is taken as the graph embedding. By concatenation of these embeddings, a feature vector of nodes for every group is generated. By applying a grid search approach and obtaining the best parameters of SVM for the classification of the groups of patients vs. HC in total regions, we achieved a unique accuracy in each region by calculating the feature discrimination rates. The corresponding SVM with an accuracy higher than 0.7 were then chosen as the base expert, and the final classification output results of the ensemble were obtained by using majority voting.Results
We calculated cross-validated average classification accuracy and standard deviation for the specific regions and selected highest-ranked features, where their accuracy was higher than 70%. We also found our proposed algorithm outperforms the SVM classifier for the binary classification. Finally, we have calculated the influence of each selected region by min-max scaling and visualized them on the brain graph that the size of every node emphasizes the value of that region in the targeted dysfunctionDiscussion
SVM results showed that the values in the inferior frontal gyrus, orbital part and left cerebellum regions might be potential imaging markers to schizophrenia patients distinguished from healthy controls. Also results of SVM in the bipolar patients directed to the middle frontal gyrus, postcentral gyrus, and the insula. Results of ADHD region-based classification discovered that supramarginal gyrus and angular gyri are influential. As we review the literature found out that though selected features vary due to dataset variation but the key point is that the selected features group is totally fixed. By utilizing the node2vec algorithm the interconnected pattern of each region for each subject is projected to a vector that be associated with cognitive symptoms found in different disorders. Based on the exclusiveness of every selected vector in each subject, employment of a majority voting approach between vectors will improve the classification in comparison to recent works.Conclusion
We introduced a classification framework that takes deep learning-based feature extraction into account with connectivity graphs as input and altered regions due to dysfunction as output. By utilizing ensemble learning, we achieved the highest accuracy among the approaches in previous literature, that would suggest that proposed method may be used for real-world systems.Acknowledgements
This work was supported by Iran’s National Elites Foundation, Ahmadi-Roshan Grant, in 2021.References
1. Chyzhyk, D. & Graña, M. Classification of schizophrenia patients on lattice computing resting-state fMRI features. Neurocomputing 151, 151-160 (2015). 2. Lish, J.D., Dime-Meenan, S., Whybrow, P.C., Price, R.A. & Hirschfeld, R.M.A. The National Depressive and Manic-depressive Association (DMDA) survey of bipolar members. Journal of Affective Disorders 31, 281-294 (1994). 3. Dey, S., Rao, A.R. & Shah, M. Attributed graph distance measure for automatic detection of attention deficit hyperactive disordered subjects. Frontiers in Neural Circuits 8(2014). 4. Liang, M.-J., et al. Identify changes of brain regional homogeneity in bipolar disorder and unipolar depression using resting-state FMRI. PloS one 8, e79999 (2013). 5. Schulz, K.P., et al. Response inhibition in adolescents diagnosed with attention deficit hyperactivity disorder during childhood: an event-related FMRI study. American Journal of Psychiatry 161, 1650-1657 (2004). 6. Turner, J.A., et al. A multi-site resting state fMRI study on the amplitude of low frequency fluctuations in schizophrenia. Frontiers in neuroscience 7, 137 (2013). 7. Poldrack, R.A., et al. A phenome-wide examination of neural and cognitive function. Scientific Data 3, 160110 (2016). 8. Penny, W.D., Friston, K.J., Ashburner, J.T., Kiebel, S.J. & Nichols, T.E. Statistical parametric mapping: the analysis of functional brain images, (Elsevier, 2011). 9. Yan, C. & Zang, Y. DPARSF: a MATLAB toolbox for "pipeline" data analysis of resting-state fMRI. Frontiers in Systems Neuroscience 4(2010). 10. Grover, A. & Leskovec, J. node2vec: Scalable Feature Learning for Networks. in Proceedings of the 22nd ACM SIGKDD International Conference on Knowledge Discovery and Data Mining 855–864 (Association for Computing Machinery, San Francisco, California, USA, 2016). 11. Mikolov, T., Chen, K., Corrado, G. & Dean, J. Efficient estimation of word representations in vector space. arXiv preprint arXiv:1301.3781 (2013). 12. Pläschke, R.A.-O., et al. On the integrity of functional brain networks in schizophrenia, Parkinson's disease, and advanced age: Evidence from connectivity-based single-subject classification. 13. Ramkiran, S., Sharma, A. & Rao, N.P. Resting-state anticorrelated networks in Schizophrenia. Psychiatry Research: Neuroimaging 284, 1-8 (2019). 14. Zhuang, H., et al. Multimodal classification of drug-naïve first-episode schizophrenia combining anatomical, diffusion and resting state functional resonance imaging. Neuroscience Letters 705, 87-93 (2019). 15. Jing, R., et al. Machine learning identifies unaffected first-degree relatives with functional network patterns and cognitive impairment similar to those of schizophrenia patients. Hum Brain Mapp 40, 3930-3939 (2019). 16. Zou, H. & Yang, J. Multiple functional connectivity networks fusion for schizophrenia diagnosis. Medical & Biological Engineering & Computing 58, 1779-1790 (2020). 17. Wismüller, A. & Vosoughi, M.A. Classification of schizophrenia from functional MRI using large-scale extended Granger causality. in Medical Imaging 2021: Computer-Aided Diagnosis, Vol. 11597 115971G (International Society for Optics and Photonics, 2021). 18. Achalia, R., et al. A proof of concept machine learning analysis using multimodal neuroimaging and neurocognitive measures as predictive biomarker in bipolar disorder. Asian Journal of Psychiatry 50, 101984 (2020). 19. Wang, Y., et al. Classification of Unmedicated Bipolar Disorder Using Whole-Brain Functional Activity and Connectivity: A Radiomics Analysis. Cerebral Cortex 30, 1117-1128 (2020). 20. Shan, X., et al. Disrupted Regional Homogeneity in Drug-Naive Patients With Bipolar Disorder. Frontiers in Psychiatry 11(2020). 21. Xi, C., et al. Abnormal functional connectivity within the reward network: a potential neuroimaging endophenotype of bipolar disorder. Journal of Affective Disorders 280, 49-56 (2021). 22. Pan, P., et al. Increased Global-Brain Functional Connectivity Is Associated with Dyslipidemia and Cognitive Impairment in First-Episode, Drug-Naive Patients with Bipolar Disorder. Neural Plasticity 2021, 5560453 (2021). 23. Riaz, A., Asad, M., Alonso, E. & Slabaugh, G. Fusion of fMRI and non-imaging data for ADHD classification. Computerized Medical Imaging and Graphics 65, 115-128 (2018). 24. Sen, B., Borle, N.C., Greiner, R. & Brown, M.R. A general prediction model for the detection of ADHD and Autism using structural and functional MRI. PloS one 13, e0194856 (2018). 25. Miao, B., Zhang, L.L., Guan, J.L., Meng, Q.F. & Zhang, Y.L. Classification of ADHD Individuals and Neurotypicals Using Reliable RELIEF: A Resting-State Study. IEEE Access 7, 62163-62171 (2019). 26. Shao, L., You, Y., Du, H. & Fu, D. Classification of ADHD with fMRI data and multi-objective optimization. Computer Methods and Programs in Biomedicine 196, 105676 (2020).Figures
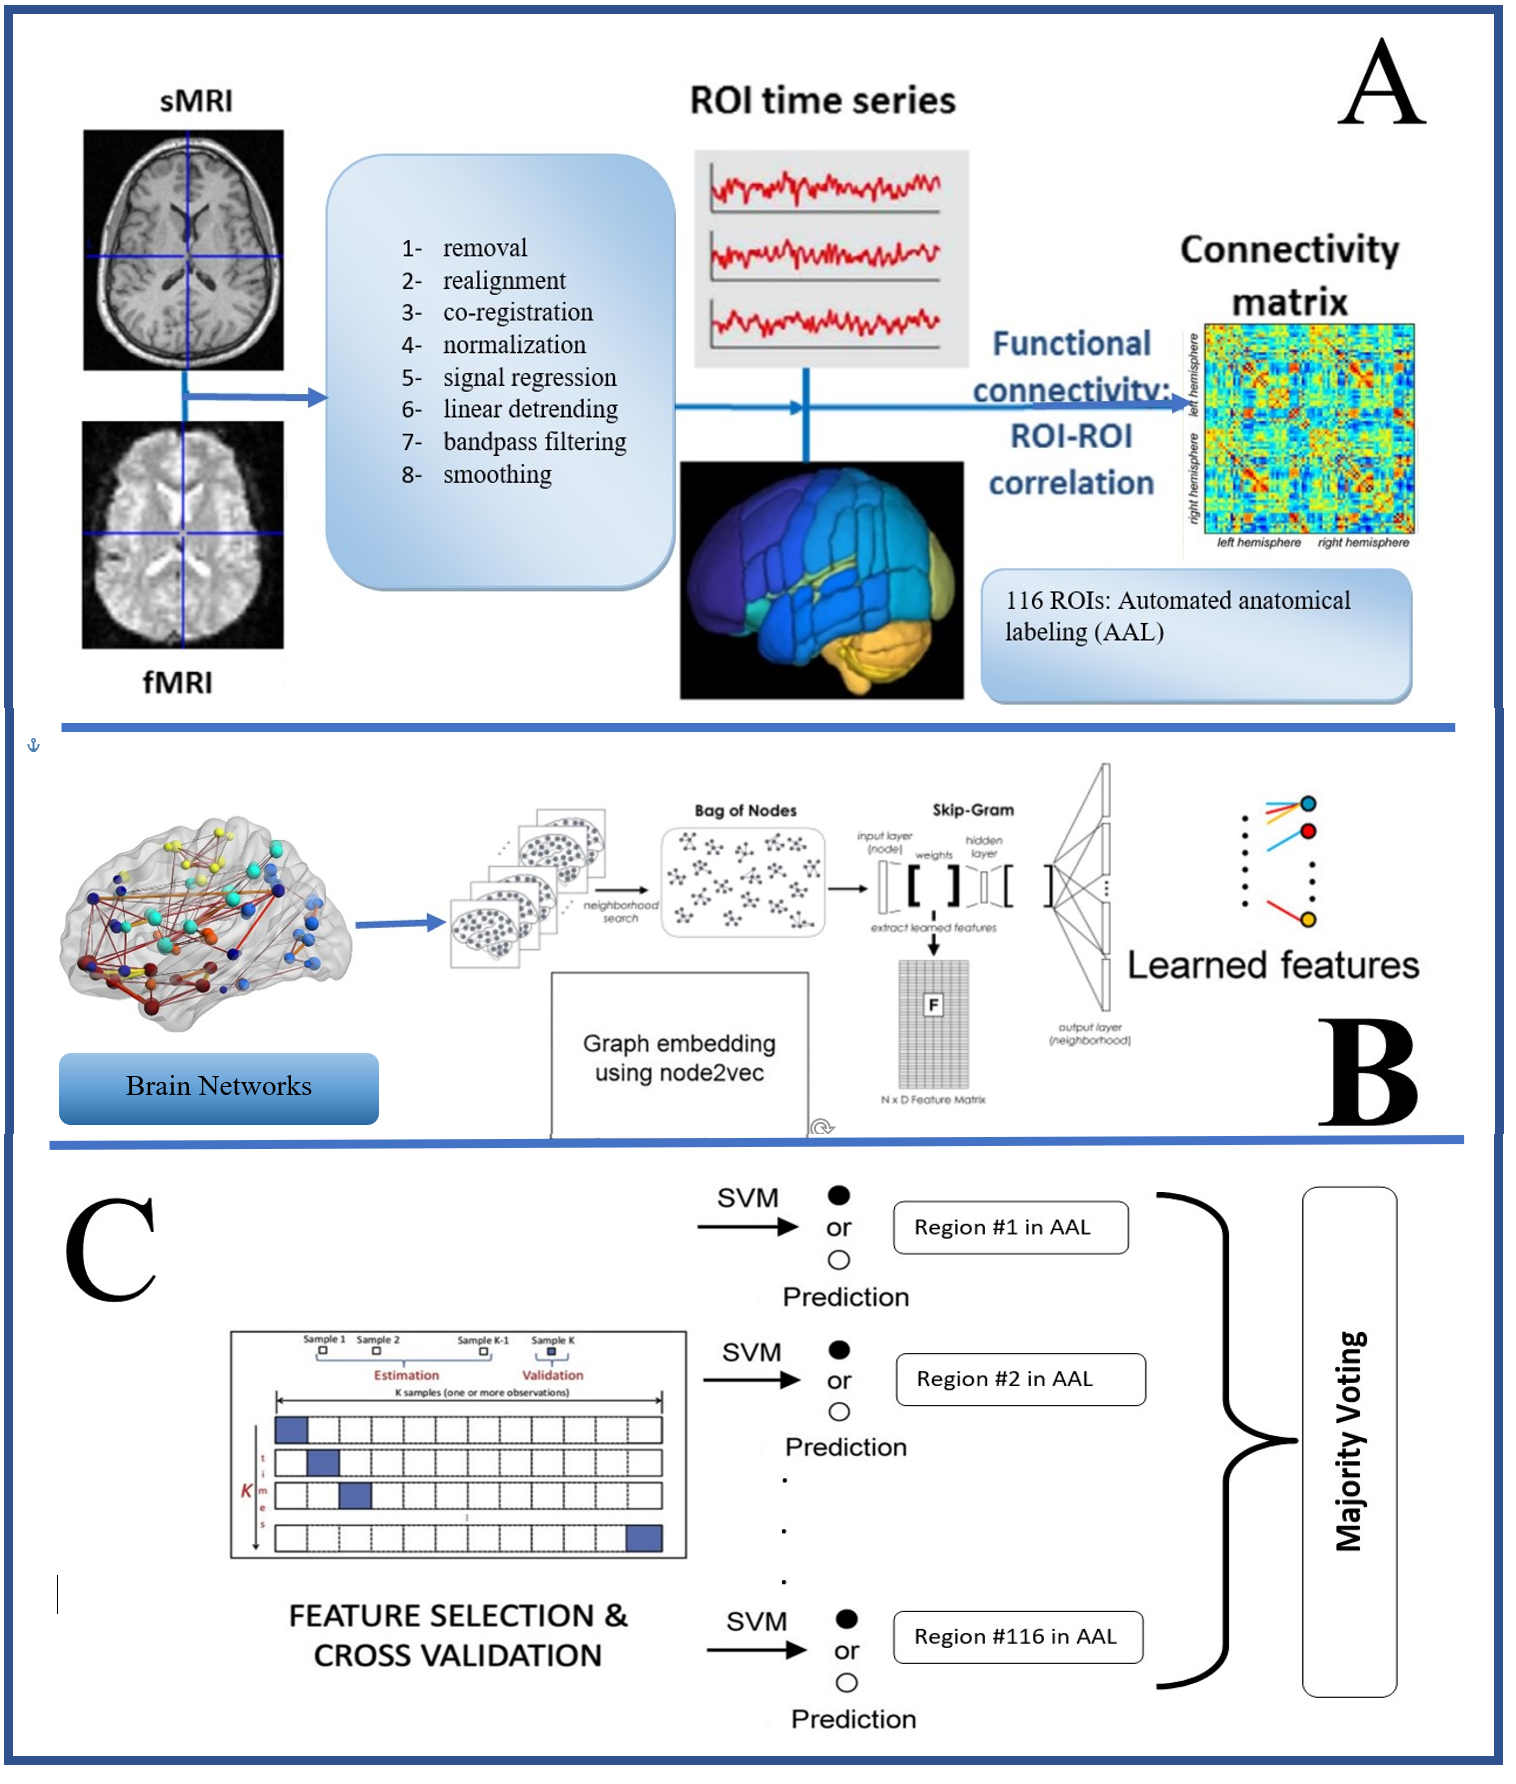
Fig. 1. Schematic representation
of the workflow. A) Preprocessing data B) Extracting features by node2vec C)
Classification

Fig. 2.
Accuracy of SVM classifier in every selected region per group .
Node degree of
selected regions per group is calculated based on the confidence of each
classifier in every region.
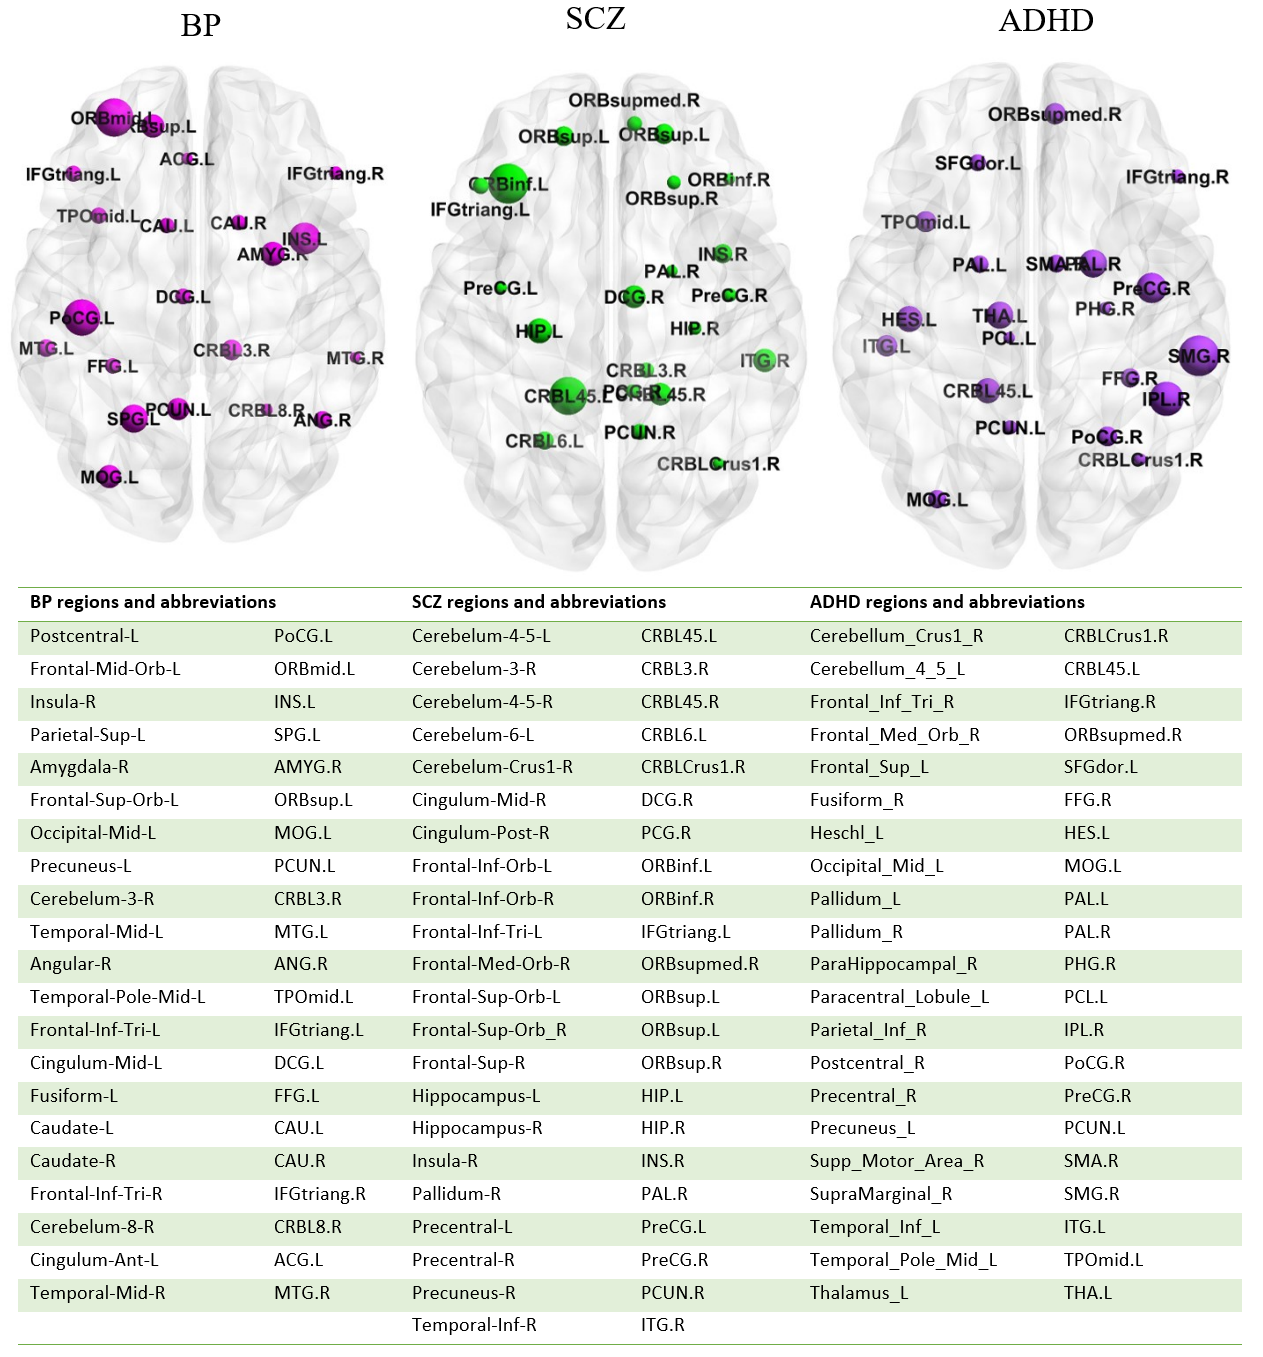
Fig.
3. Most discriminating regions in bipolar disorder, schizophrenia, ADHD.
Table
shows the altered brain regions and their abbreviations.
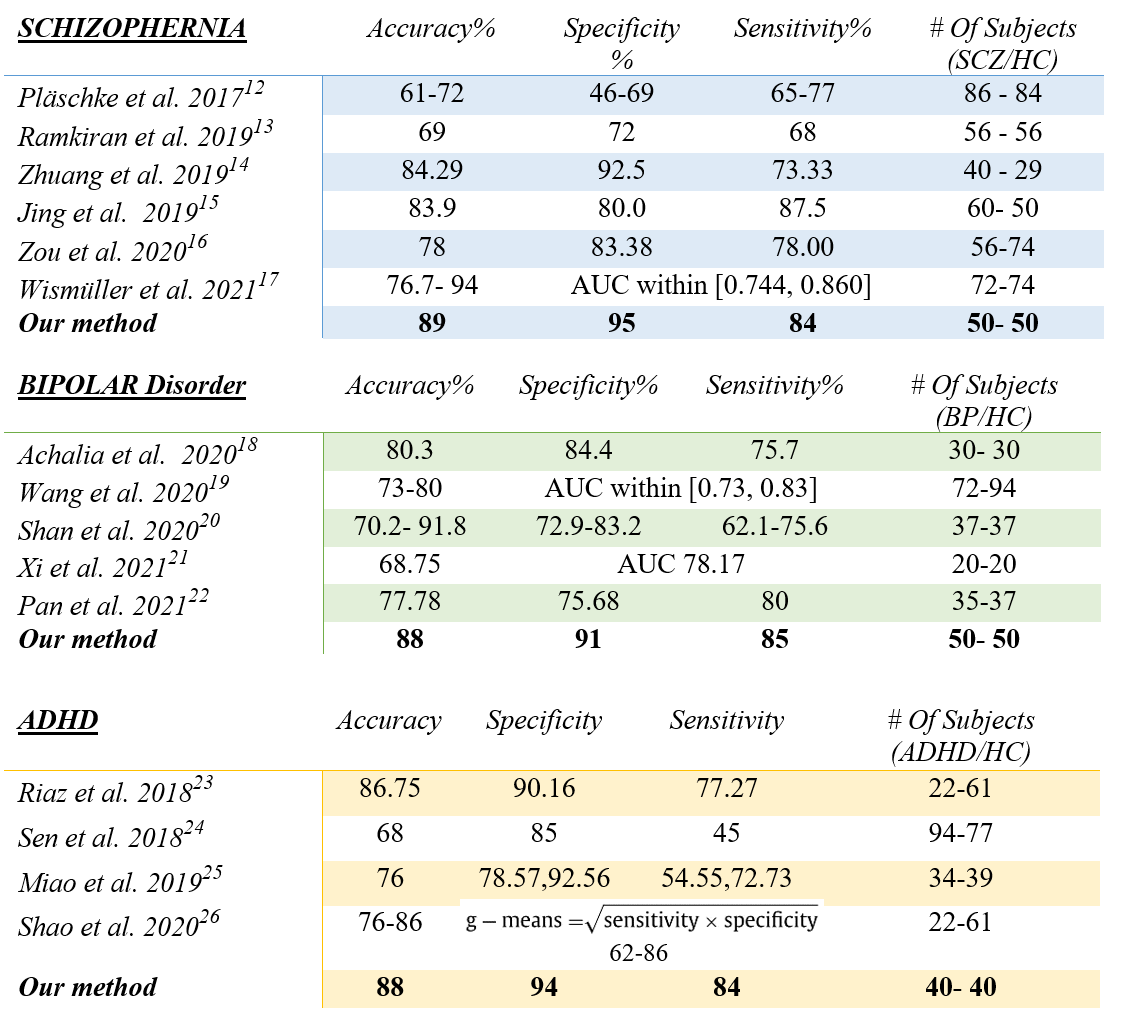
Fig. 4. Comparison
of the proposed method with recent frameworks
DOI: https://doi.org/10.58530/2022/0713