0706
Design and Optimization of Transmit Arrays for MRI at 11.7T1Imaging Centre of Excellence, University of Glasgow, Glasgow, United Kingdom, 2University of Paris-Saclay, CEA, CNRS, BAOBAB, NeuroSpin, Gif sur Yvette, France
Synopsis
The promise of supra-linear boost in signal-to-noise-ratio is driving the development of MRI at extremely high static field strengths, such as 10.5T and beyond. The shorter wavelengths in tissues at high Larmor frequency causes destructive interference of the electromagnetic field, resulting in image inhomogeneity and increased local specific absorption rate (SAR). An efficient transmit array is vital in this regime to optimally use the available RF power, achieve efficient excitation and operate within SAR constraints. This work presents the design and optimization of an 8-channel transmit array for MRI at 11.7T and its performance evaluation using RF pulse design simulations.
Introduction
The world’s most powerful 11.7T human MRI scanner1 is now operational at CEA, Paris-Saclay. At 11.7T, however, the radiofrequency (RF) wavelength is shorter compared to the size of the human brain, resulting in inhomogeneous excitation as well as increased energy deposition in tissue. Transmit arrays are essential to mitigate the RF field inhomogeneity problem2,3. An understanding of their loss mechanisms is important to achieve efficient transmit excitation and operate within the specific absorption rate (SAR) constraints. This work presents the design of an 8-channel transmit array at 11.7T using electromagnetic (EM) simulations and the selection of the most suitable design using RF pulse design simulations.Methods
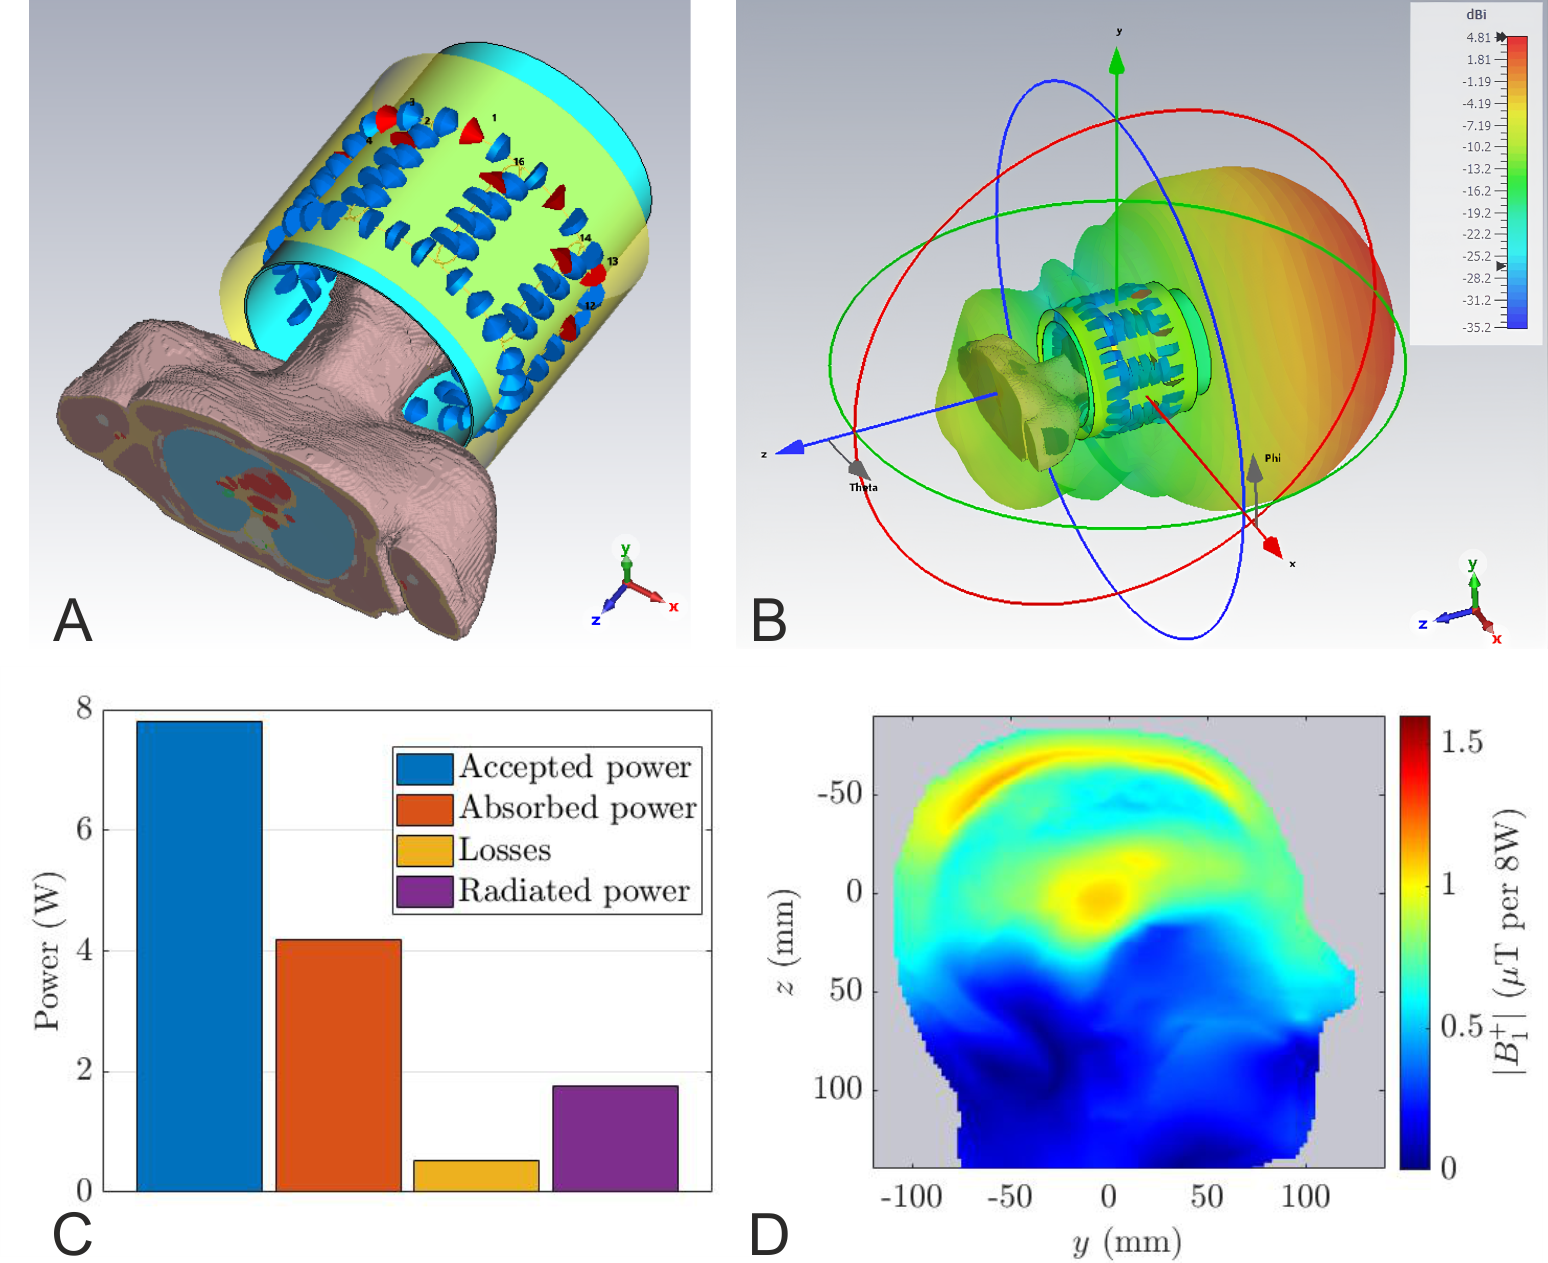
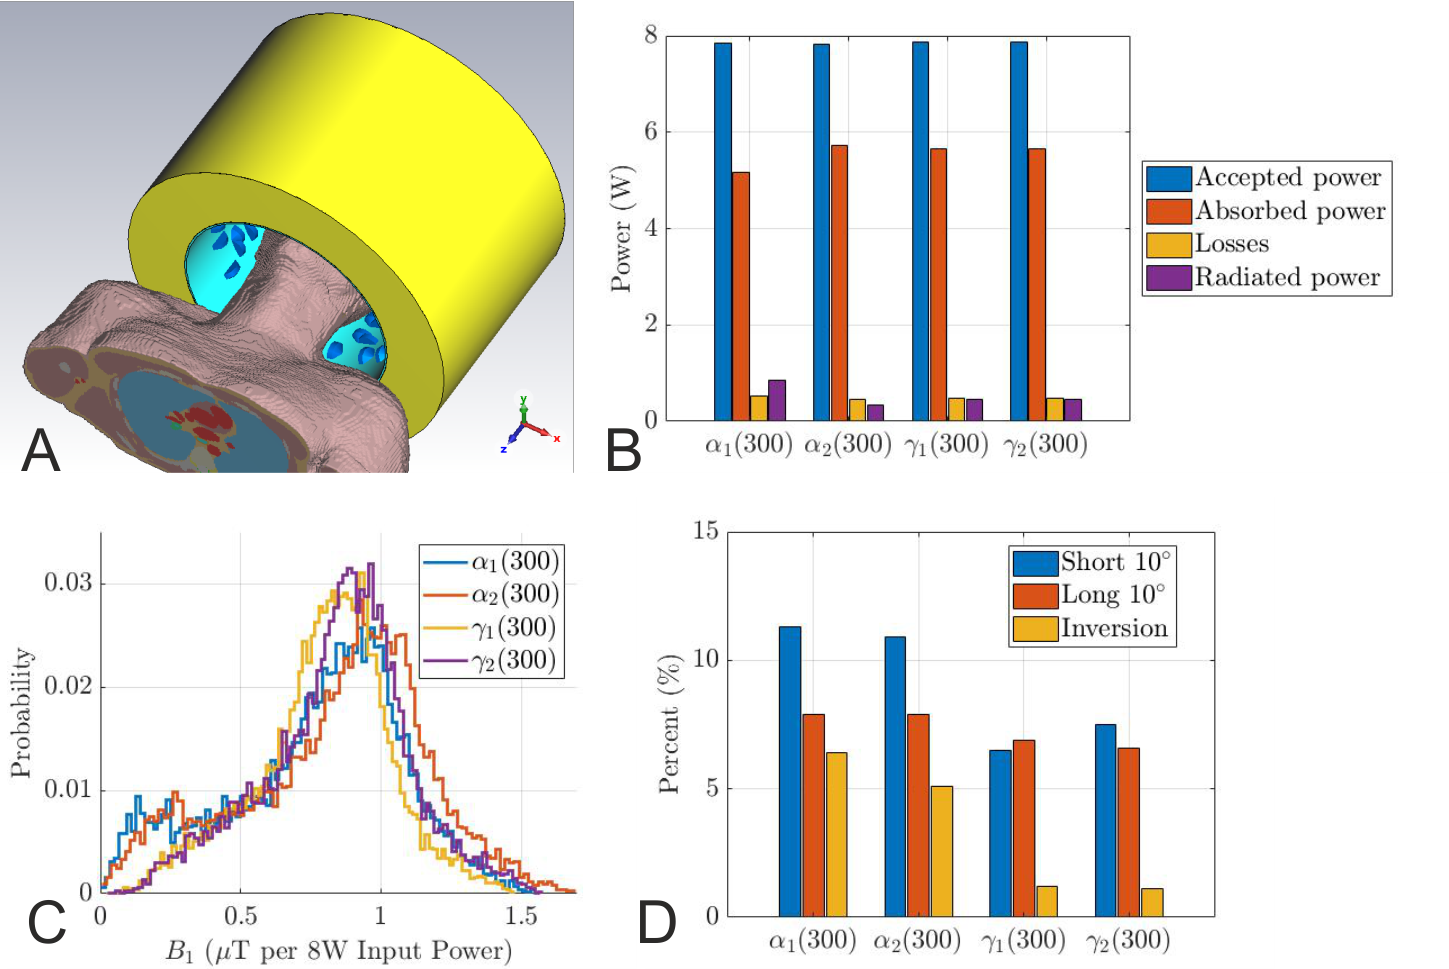
EM studies were performed using CST Studio Suite 2021 (Dassault Systems, France)4. The coil was loaded with the Duke body model (virtual family, 2mm resolution) truncated below the level of shoulders. The transmit array consisted of 8-rectangular loops arranged on a fiberglass tube with 285mm inner diameter ($$$\epsilon_r=5.5$$$, $$$\tan \delta =0.04$$$, wall thickness 2.5mm). The loops’ length along the z-direction was varied from 12cm (array-$$$\alpha$$$) to 16cm (array-$$$\gamma$$$). To tune the loops to 499.415 MHz, each one consisted of 13-fixed capacitors and one variable capacitor. The capacitors were connected by 2mm diameter wires. The adjacent elements were geometrically overlapped. The model included the lumped components’ losses, cable losses up to the coil plug, and the scanner bore.The reference model, shown in Fig. 1a, consisted of a 350 mm diameter conventional cylindrical shield commonly used in 7T transmit arrays5. To optimize the transmit performance, in conjunction with the transmit array, we designed several RF shields for two diameters: 400mm (subscript 1) and 450mm (subscript 2). The shield length was varied from 240mm to 300mm with 20mm increments. The array S-parameters were optimized using the co-simulation approach6. To increase the cut-off frequency of the RF shield and reduce the radiated power, folded-end sections (FES) were introduced at both ends, which extended from the outer shield until the inner tube (Fig. 2a). Our optimization criteria included analyzing the loss mechanisms of the transmit array and minimizing the losses due to components, reflection, radiation, and coupling.
RF pulse design simulations were used to choose the optimum transmit array. The electric and magnetic field maps were exported on a 5mm isotropic grid. Given the B1+ maps, RF pulse design consisted of homogenizing the flip angle on the brain mask (white matter, grey matter, and cerebellum) with 5 $$$k_T$$$- and 7 $$$k_T$$$-points respectively for small tip angle (10° target, 0.5 and 1ms durations) and inversion (180° target, 4ms duration) pulses, under explicit power and SAR constraints7. For each coil configuration, VOPs were made for SAR control. The flip angle Normalized Root Mean Square Error (NRMSE) results were put alongside the loss mechanisms for further understanding.
Results and Discussion
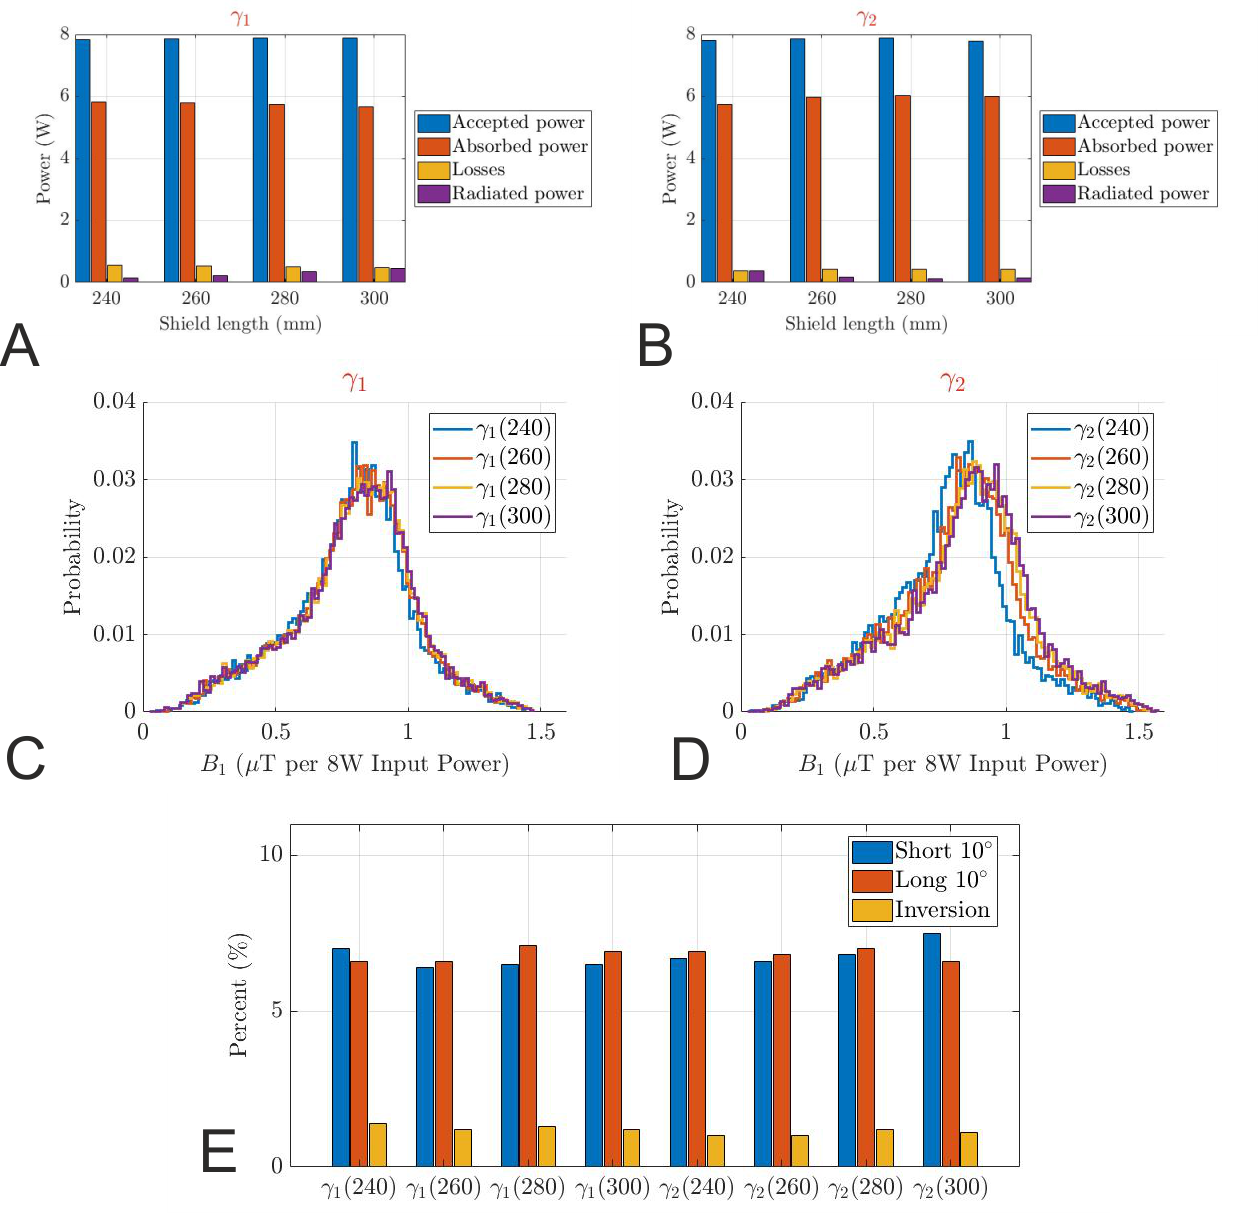
The far-field pattern and the power budget (Fig. 1) demonstrate that the conventional cylindrical shield behaves like a waveguide at 499.415MHz, and 22.5% of the accepted power is lost to radiation. Introduction of the FES significantly reduced the radiated power to less than 10.9%, 4.5%, 5.7%, and 4.8% for $$$\alpha_1$$$, $$$\alpha_2$$$, $$$\gamma_1$$$, and $$$\gamma_2$$$, respectively (Fig. 2b). Even though the $$$\alpha$$$-configuration achieves a higher peak B1+ in the centre, the coefficients of variation in CP mode are significantly worse, 41% and 39% versus 27.1% and 27.4% for the $$$\gamma$$$-configuration (Fig. 2c). Furthermore, it also exhibits larger NRMSEs of the $$$k_T$$$-points for all three different pulses, see Fig. 2d. Therefore, the $$$\gamma$$$-configuration was chosen for further optimization.Fig. 3 shows the influence of the shield length on the power budget of $$$\gamma$$$-arrays. While we found improvement in transmit performance by increasing the shield diameter and maintaining the FES, there is no real trend between the shield length, shield diameter, and radiated power. This demonstrates the need to optimize RF shield designs in conjunction with the transmit array. The array decoupling was significantly altered when the FES was too close to the coil elements (< 4cm). Fig. 3c and 3d are histograms of the CP-like B1+ fields inside the brain for all $$$\gamma$$$-designs while NRMSEs of the $$$k_T$$$-point pulses are shown in Fig. 3e. Based on the results of the RF-pulse design simulations, both designs $$$\gamma_1$$$(260) and $$$\gamma_2$$$(240) provide similar transmit performance. Because the bulkier shield would offset the coil from the iso-centre, $$$\gamma_1$$$(260) was preferred.
The simulated S-parameters and the CP mode B1+ maps for $$$\gamma_1$$$(260) while loading the coil with Duke model is shown in Fig. 4. The reduced radiated power due to the FES improved the maximum B1+ in the middle of the brain from 1.05 µT (Fig. 1d) to 1.45 µT for 8W total input power. The flip angle maps for 10◦ and 180◦ pulses are then presented in Fig. 5.
Conclusion
We have demonstrated that conventional RF coil designs can still be employed at 11.7T. However, it is important to consider the loss mechanisms of the transmit array, and RF shield designs must be optimized in conjunction with transmit arrays. Notably, RF pulse design simulation workflow was used to identify the preferred configuration. Future work will involve the construction of the optimized transmit array and validation of results in the 11.7T MRI scanner.Acknowledgements
This project has received funding from the European Union’s Horizon 2020 research and innovation programme under grant agreement No. 885876 (AROMA).References
- Nowogrodzki, A. The world's strongest MRI machines are pushing human imaging to new limits. Nature. 2018, 563(7732), 24-27.
- Van de Moortele, P. F., Akgun, C., Adriany, et al. B1 destructive interferences and spatial phase patterns at 7 T with a head transceiver array coil. Magn Reson Med. 2005, 54(6), 1503-1518.
- Vaughan, J. T., Garwood, M., Collins, C. M., Liu, et al. 7T vs. 4T: RF power, homogeneity, and signal‐to‐noise comparison in head images. Magn Reson Med. 2001, 46(1), 24-30.
- Hoffmann, J., Shajan, G., Scheffler, K., et al. Numerical and experimental evaluation of RF shimming in the human brain at 9.4 T using a dual-row transmit array. Magn Reson Mater Phys Biol Med. 2014, 27(5), 373-386.
- Williams, S. N., Allwood-Spiers, S., McElhinney, P., et al. A nested eight-channel transmit array with open-face concept for human brain imaging at 7 Tesla. Front. Phys. 2021, 9.
- Kozlov, M., and Turner, R. Fast MRI coil analysis based on 3-D electromagnetic and RF circuit co-simulation. J. Magn. Reson. 2009, 200(1), 147-152.
- Hoyos-Idrobo, A., Weiss, P., Massire, A., et al. On variant strategies to solve the magnitude least squares optimization problem in parallel transmission pulse design and under strict SAR and power constraints. IEEE Trans Med Imaging. 2013, 33(3), 739-748.
Figures

Reflection (a) and transmission coefficients of γ1(260). The nearest neighbour coupling (b) and next neighbour coupling (c) are -20.9dB and -13.9dB on average, respectively. No coupling is greater than -12dB. (d) B1+ field map for 8W input power (CP mode) in the DUKE virtual family model. The peak B1+ value in the middle of the brain is 1.45 μT. (e) Three slices through the maximum SAR in CP mode (1W total input power) in the DUKE virtual family model. The maximum SAR value is 0.425 W/kg.
