0705
Feasibility study for conductivity reconstructions from spin-echo images using artificial neural network with simulation data in 3T MR system1Department of Electrical and Electronic Engineering, Yonsei University, Seoul, Korea, Republic of, 2Department of Radiotherapy, UMC Utrecht, Utrecht, Netherlands, 3Computational Imaging Group for MR Diagnostics and Therapy, UMC Utrecht, Utrecht, Netherlands, 4Department of Radiology, Gangnam Severance Hospital, Yonsei University College of Medicine, Seoul, Korea, Republic of
Synopsis
Phase-based Electrical properties tomography is a non-invasive imaging technique that uses MRI systems to measure the tissue conductivity. However, the conductivity reconstruction process causes problems such as noise amplification and boundary artifact. To address such limitations, several DL-based reconstruction methods were proposed. Building upon these works, we propose an ANN-based conductivity reconstruction method trained only on simulation dataset. The proposed method was studied with the aim of: (a) approaching ground-truth conductivity values, (b) noise-robustness, (c) higher image resolution, (d) generalization to clinical data. The feasibility was investigated on simulations and TSE in-vivo data (one healthy volunteer, two meningioma cases).
Introduction
MR-based Electrical Properties Tomography (EPT) is a non-invasive technique to derive electrical properties of tissues at Larmor frequency1,2. Tissue EPs may find applications as quantitative biomarker for pathologies3-5. Yet, there are several problems6-9 with conductivity reconstructions such as noise amplification and boundary artifact. Recently, deep learning (DL) approaches10-13 for EPT reconstructions were proposed to address such limitations. Building upon these works, here we propose a deep learning-based conductivity reconstruction method with simulated data in training to address 1) approaching ground-truth conductivity (GTC) values, 2) noise-robustness, 3) higher image resolution, and 4) generalization to clinical data. The feasibility was investigated on simulated and in-vivo data.Method
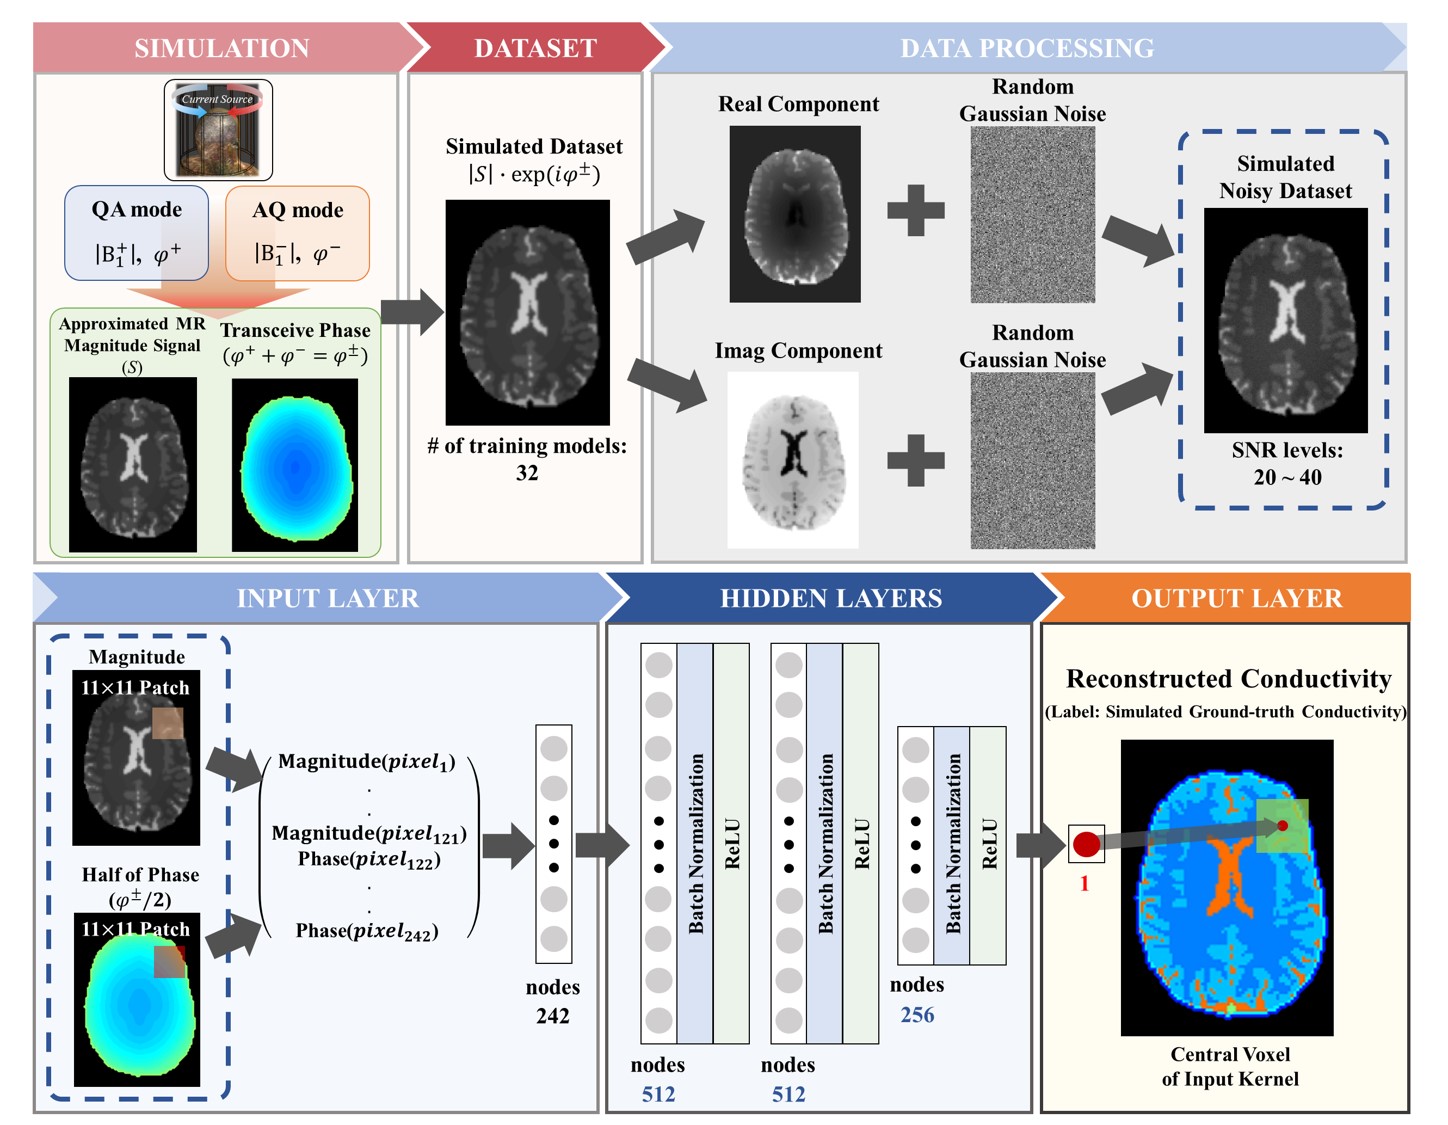
An artificial neural network (ANN) was trained for conductivity reconstructions from MRI data using simulated brain data (known GTC values) and tested on: simulated brain data, 1 healthy volunteer, 2 meningioma patients.Simulations were performed in Sim4Life (Zurich-Med-Tech, Zurich, Switzerland) by placing Duke, Ella, and additional cylindrical models (human models, IT’IS Foundation14,15) inside a birdcage coil. To introduce variability in the training set, different rotations (±5°) were applied to the models within the coil, and various conductivity values were assigned to: cerebrospinal fluid (1.65~2.14 S/m), white matter (0.3~0.43 S/m), gray matter (0.56~0.63 S/m), cylinder models (0.5~1.5 S/m). For these models, T2-weighted spin-echo magnitude data were synthesized using the Bloch equation to approximate magnitude images. Ultimately, 41 models with 1.0×1.0mm2 resolution were obtained (32 for training and 9 for testing).
Turbo spin-echo (TSE) data were acquired at 3T: 1 healthy volunteer (Tim Trio, Siemens Healthineers: TR/TE=4500/85ms, resolution=1.0×1.0mm2, slice thickness=3mm) and 2 meningioma (MR750, GE Healthcare: TR/TE=4363/95ms, resolution=0.625×0.75mm2, slice thickness=2mm, resized to 1.0×1.0mm2 for the network testing).
An ANN network was designed to estimate conductivity values from approximated MR magnitude maps and transceive phase maps. Random Gaussian noise (SNR=20~40) was added to the real and imaginary components of the synthesized training dataset. The training dataset consisted of paired magnitude and phase patches (patch size=11×11), and GTC of the central voxel in the patch (see Fig.1 for details). The network was tested on: 1) simulated brain data without/with lesions, 2) in-vivo data (one healthy volunteer and two patients). Ultimately, we tested whether there was a dependency of the reconstructed conductivity maps with the MRI magnitude signal which was provided in input.
Results
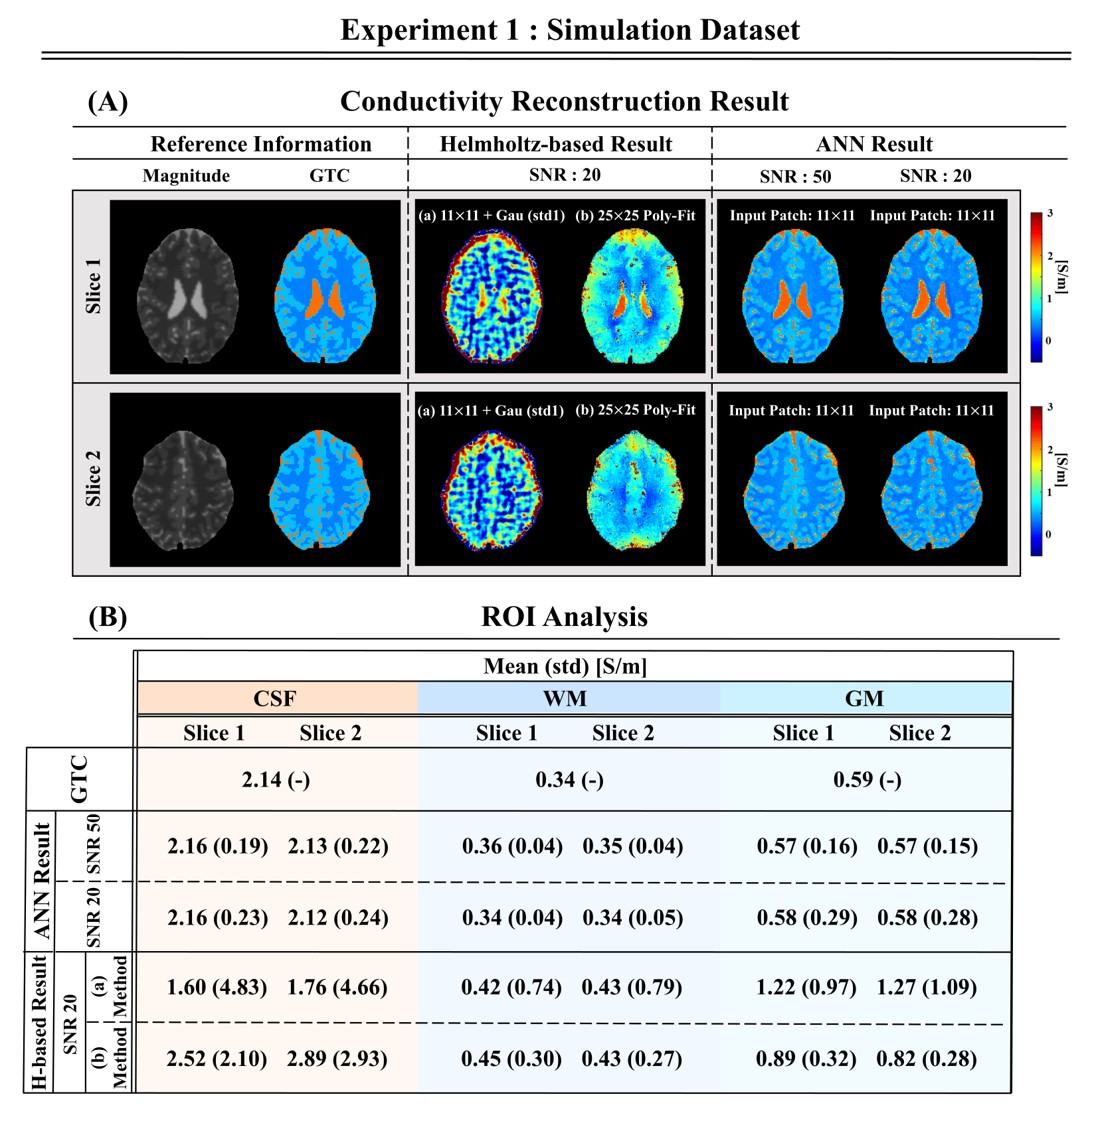
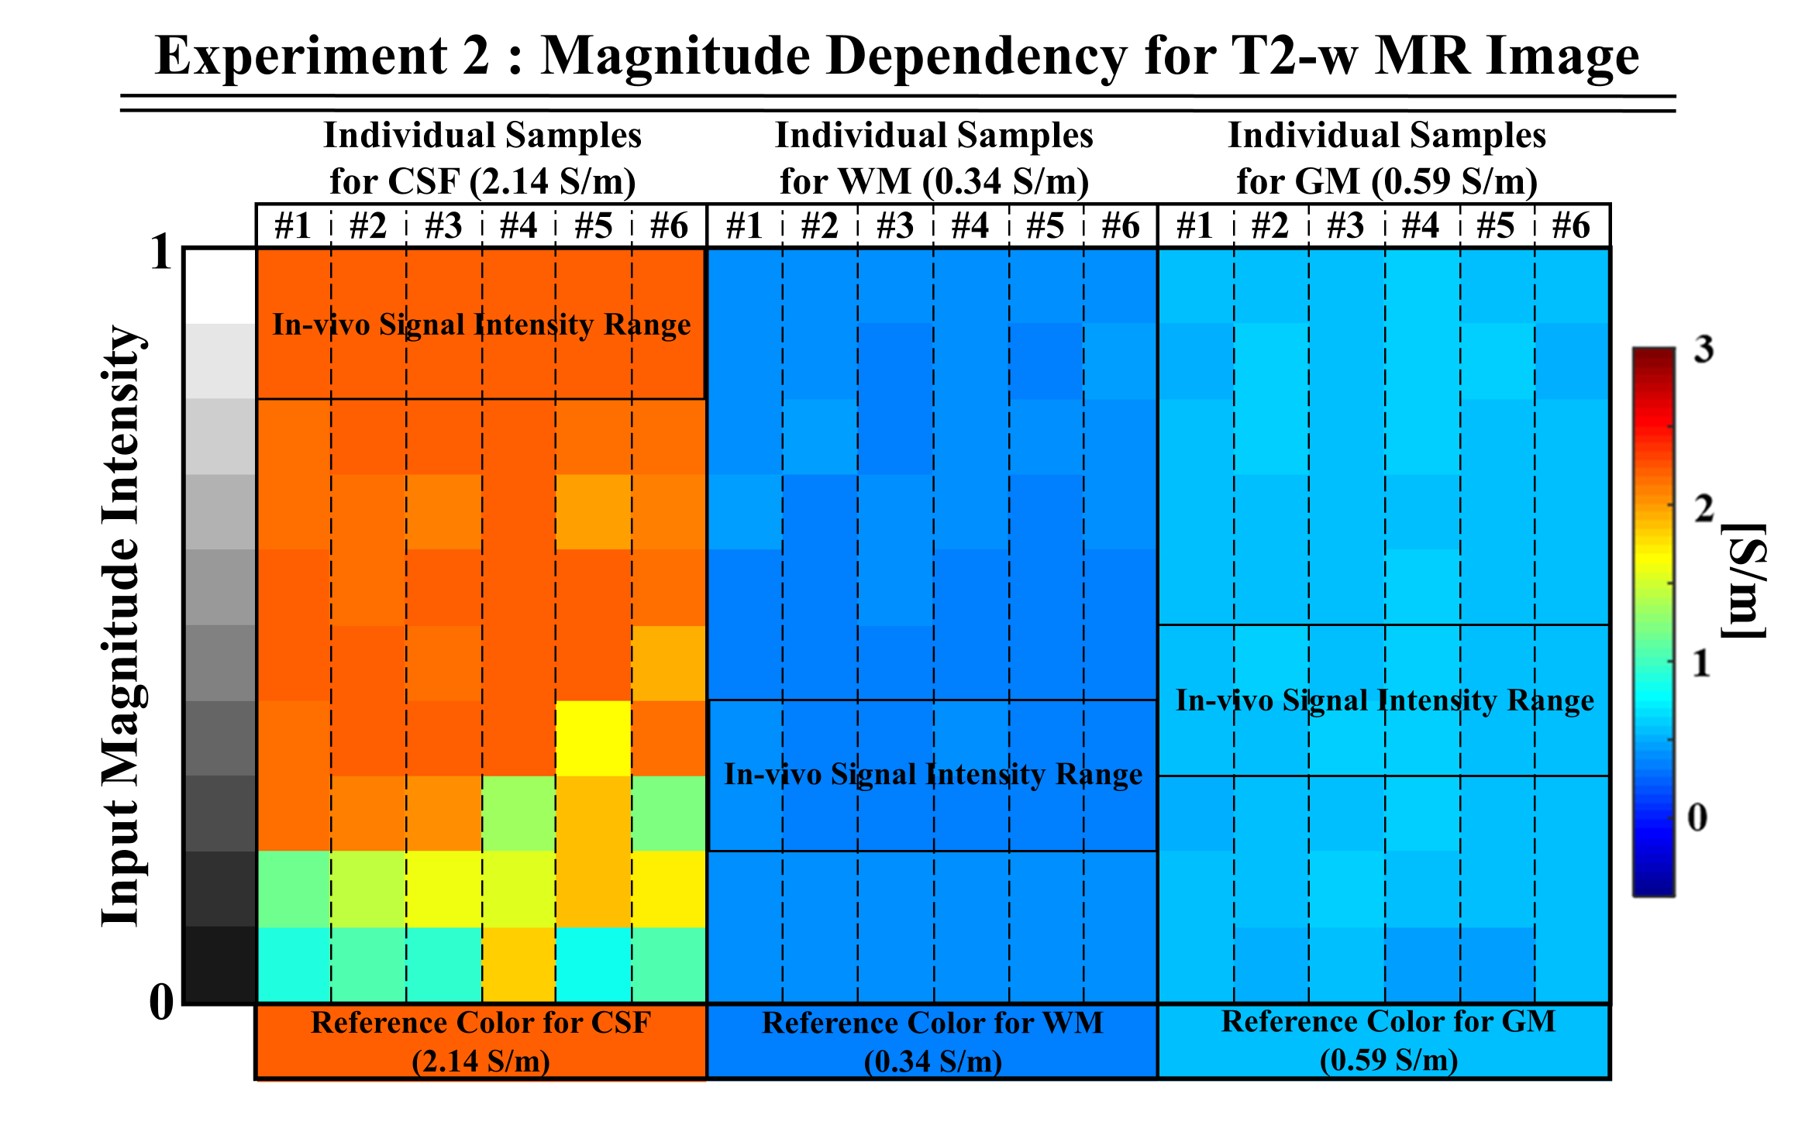
Conductivity reconstructions on simulated brain data using the proposed ANN approach are shown in Fig.2 for different SNR levels; these are compared to the Helmholtz-based reconstruction methods (as reference: a) 11×11 Laplacian kernel16, b) 25×25 weighted polynomial fitting kernel17(Poly-Fit)). ANN-based conductivity reconstructions show good reconstruction quality (also at boundaries) and demonstrate good agreement with GTC values for different SNR levels.Fig.3 shows that conductivity reconstructions for WM, GM, and CSF are not affected by changes in the T2-w magnitude signal intensities, indicating that the reconstructed conductivity values do not strongly depend on the input signal intensity. A small bias is introduced only for the CSF when the T2-w signal intensity is lower than 0.4, which however may not be possible for the CSF tissue for a T2-w acquisition.
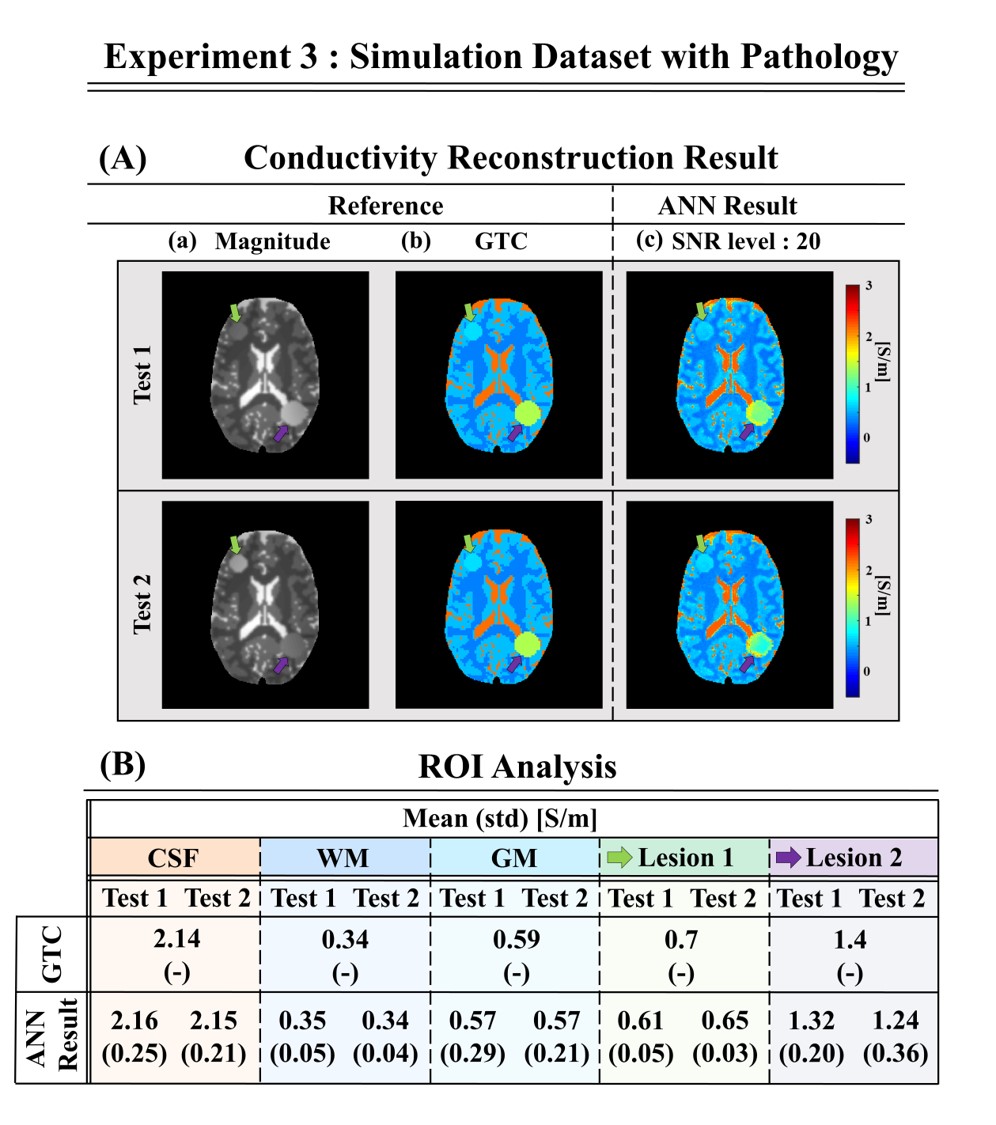
Fig.4 shows that the proposed approach can allow reconstructions of lesions not present in the training set. This was evaluated on simulated brain data, which allows knowledge of the GTC. The reconstructed conductivity values of the lesions show the possibility of this method to generalize to unforeseen cases. Note that although these reconstructions do not show strong dependency on the magnitude signal of the lesions, conductivity values may tend to be underestimated.
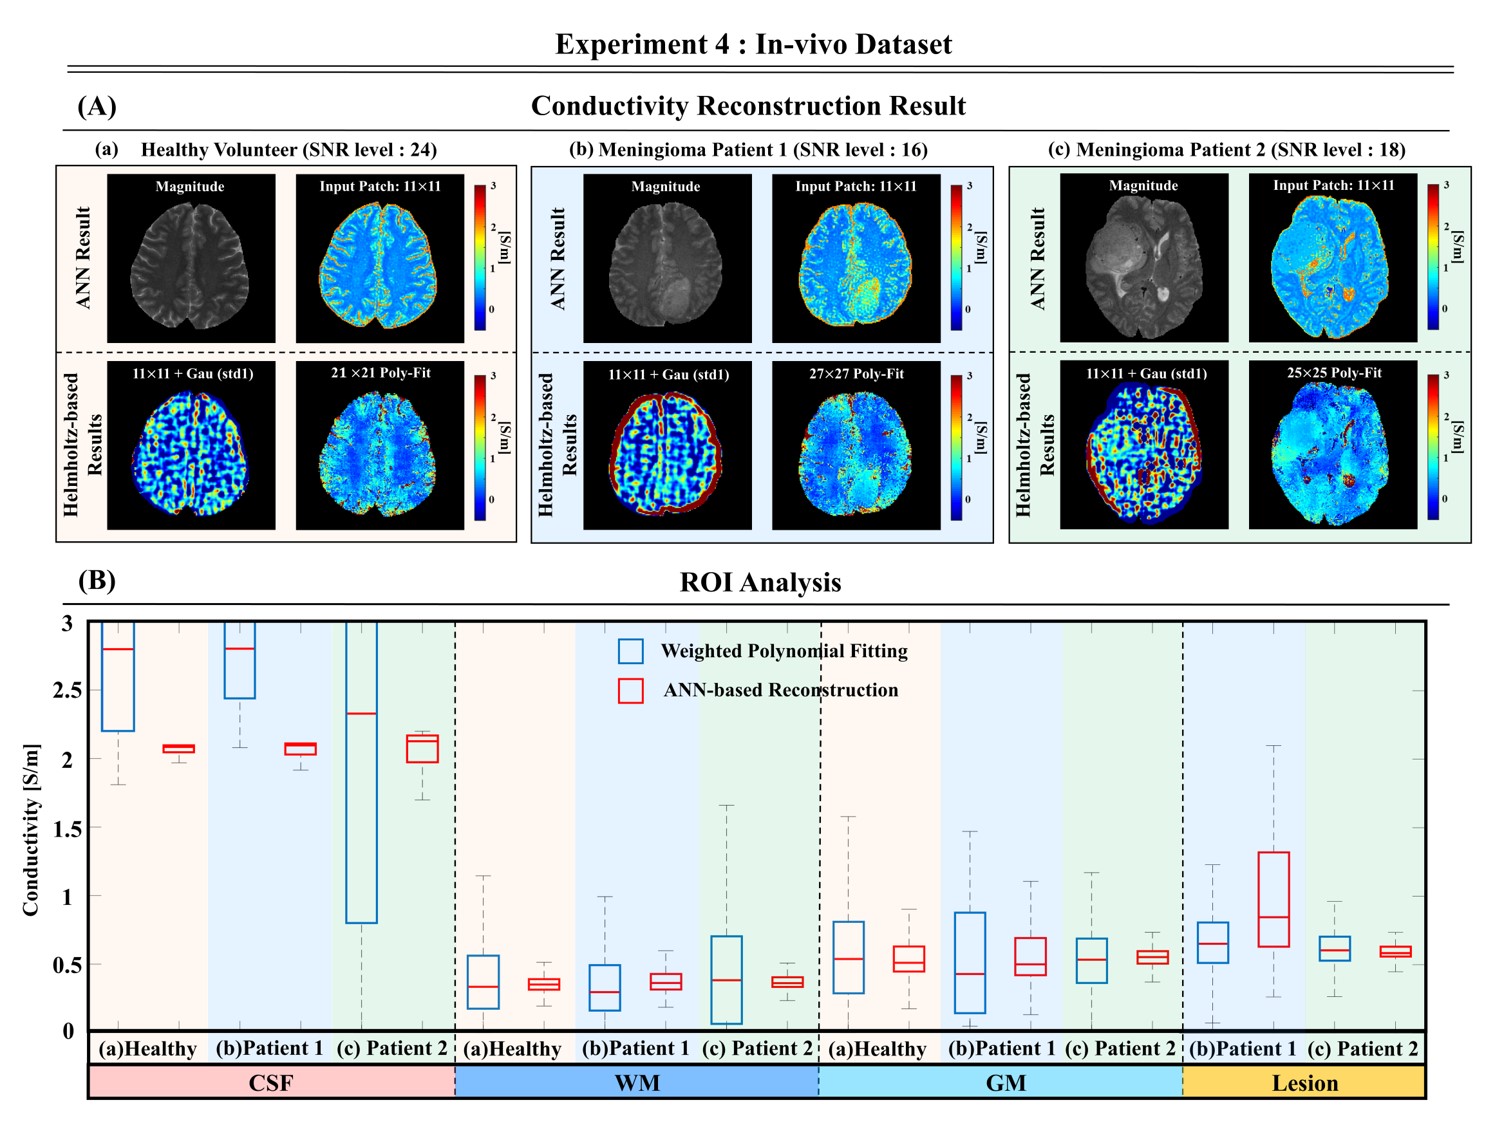
Fig.5 shows good quality ANN-conductivity reconstructions on the healthy volunteer and two meningioma patients. The reconstructed ANN-conductivity values are in line with literature values18. Also, these maps show good quality reconstructions of the lesions (meningioma) with higher conductivity values compared to healthy tissues as previously shown4,19. 11×11 Laplacian kernel and Poly-Fit reconstructions are also shown for comparison.
Discussion and Conclusion
The presented results show the feasibility of using an ANN network for conductivity reconstructions. These results show good quality reconstructions on simulated and in-vivo data. Quantitative analysis performed in simulation settings shows that the reconstructed conductivity values agree with GTC values. Additionally, the presented network seems to be robust with respect to different SNR levels, and may be applicable to unseen cases both for simulated and in-vivo data (with small underestimation). While the direct use of MR magnitude information as a network input may be suspected to lead to a strong dependence of the reconstructed conductivity with the provided magnitude information, the presented results seem to discard this hypothesis in homogeneous regions. As further investigations, the network was also tested on two meningioma cases. Tumors were classified into the following two groups: tumors with soft consistency (patient1), and tumors with hard consistency (patient2). The ANN-based reconstruction results show different conductivity distributions for two cases (higher conductivity values in patient1 than in patient2). These are preliminary observations since ANN reconstruction on lesions requires further investigations. Of course, the impact of other sources of artifacts (e.g. motion/pulsation) on conductivity reconstructions should be further investigated. Finally, the generation of network uncertainty estimations maps should be considered as a future study.Acknowledgements
This work was supported by the National Research Foundation of Korea(NRF) grant funded by the Korea government(MSIT) (NRF-2019R1A2C1090635).
S.M. received funding from Netherlands Organisation for Scientific Research (NWO), grant number:18078.
References
1. Katscher U, et al., Determination of Electric Conductivity and Local SAR Via B1 Mapping. IEEE transactions on medical imaging, 2009;28(9):1365-1374.
2. Voigt T, et al., Quantitative conductivity and permittivity imaging of the human brain using electrical properties tomography. Magnetic Resonance in Medicine, 2011;66(2):456-466.
3. Kim S-Y, et al. Correlation between conductivity and prognostic factors in invasive breast cancer using magnetic resonance electric properties tomography (MREPT). European radiology, 2016;26(7):2317-2326.
4. Tha K.K., et al. Noninvasive electrical conductivity measurement by MRI: a test of its validity and the electrical conductivity characteristics of glioma. European radiology, 2018;28(1):348-355.
5. Mori N, et al. Diagnostic value of electric properties tomography (EPT) for differentiating benign from malignant breast lesions: comparison with standard dynamic contrast-enhanced MRI. European radiology, 2019;29(4):1778-1786.
6. Shin J, et al. Quantitative conductivity estimation error due to statistical noise in complex B1+ map. Journal of the Korean Society of Magnetic Resonance in Medicine, 2014;18(4):303-313.
7. Lee S.K., et al. Theoretical investigation of random noise-limited signal-to-noise ratio in MR-based electrical properties tomography. IEEE transactions on medical imaging, 2015;34(11):2220-2232.
8. Seo J, et al. Error analysis of nonconstant admittivity for MR-based electric property imaging. IEEE transactions on medical imaging, 2011;31(2):430-437.
9. Mandija S, et al. Error analysis of helmholtz‐based MR‐electrical properties tomography. Magnetic Resonance in Medicine, 2018;80(1):90-100.
10. Mandija S, et al. Opening a new window on MR-based Electrical Properties Tomography with deep learning. Scientific reports, 2019;9(1):1-9.
11. Leijsen R., et al. Combining deep learning and 3D contrast source inversion in MR‐based electrical properties tomography. NMR in Biomedicine, 2019;e4211.
12. Hampe N., et al. Investigating the challenges and generalizability of deep learning brain conductivity mapping. Physics in Medicine & Biology, 2020;65(13):135001.
13. Jung K-J, et al. Improving phase‐based conductivity reconstruction by means of deep learning–based denoising of B1+ phase data for 3T MRI. Magnetic Resonance in Medicine, 2021;86(4):2084-2094.
14. Christ A, et al. The Virtual Family—development of surface-based anatomical models of two adults and two children for dosimetric simulations. Physics in Medicine & Biology, 2009;55:N23.
15. Gosselin M-C, et al. Development of a new generation of high-resolution anatomical models for medical device evaluation: the Virtual Population 3.0. Physics in Medicine & Biology, 2014;59(18):5287.
16. Lee S-K, et al. Theoretical investigation of random noise-limited signal-to-noise ratio in MR-based electrical properties tomography. IEEE transactions on medical imaging, 2015,34(11): 2220-2232.
17. Lee J, et al. MR‐based conductivity imaging using multiple receiver coils. Magnetic Resonance in Medicine, 2016;76(2):530-539.
18. Mandija S, et al. Brain Tissue Conductivity Measurements with MR-Electrical Properties Tomography: An In Vivo Study. Brain topography, 2021;34(1):56-63.
19. Liao Y, et al. An MR technique for simultaneous quantitative imaging of water content, conductivity and susceptibility, with application to brain tumours using a 3T hybrid MR-PET scanner. Scientific reports, 2019;9(1):1-12.
Figures