0703
Comparison of whole brain biophysical model predictions and MR thermometry measurements in healthy humans1Department of Biomedical Engineering, Georgia Institute of Technology and Emory University, Atlanta, GA, United States, 2Department of Biostatistics and Bioinformatics, Emory University, Atlanta, GA, United States, 3Woodruff School of Mechanical Engineering, Georgia Institute of Technology, Atlanta, GA, United States, 4Department of Radiology and Imaging Sciences, Emory University School of Medicine, Atlanta, GA, United States, 5Department of Neurology, Emory University School of Medicine, Atlanta, GA, United States, 6Petit Institute for Bioengineering and Bioscience, Georgia Institute of Technology, Atlanta, GA, United States
Synopsis
To advance our understanding of thermal dynamics in the human brain, a thermal modeling framework was previously developed to facilitate temperature predictions in the absence of clinical thermometry. Here, predicted brain temperatures using our fully conserved model were compared with MR thermometry in 21 healthy human subjects. Bland-Altman plots demonstrated agreement between predictions and MR-measurements for average temperature values, but some differences were observed at the lowest and highest temperatures. Regional variations were similar between predicted and measured temperatures. We anticipate our modeling framework will form the necessary baseline for predicting injury-induced brain temperature changes in patients.
Introduction
Brain temperature regulation is driven by the balance between heat generation from metabolism and heat dissipation into circulating blood1 and is a potential biomarker for hemodynamic impairment after injury or ischemia.2 One promising non-invasive brain thermometry method relies on the chemical shift difference derived from MR spectroscopy or spectroscopic imaging; however, it is often not clinically practical due to long acquisition times for whole brain imaging. Recently, a biophysical model was developed to predict personalized brain temperature using MR structural and vessel images,3 providing a framework for brain temperature predictions even when experimental thermometry is not possible. In this study, we compared our model predictions with whole brain MR thermometry (WB-MRT) to identify differences in simulated and measured temperatures and evaluate reproducibility in a healthy cohort.Methods
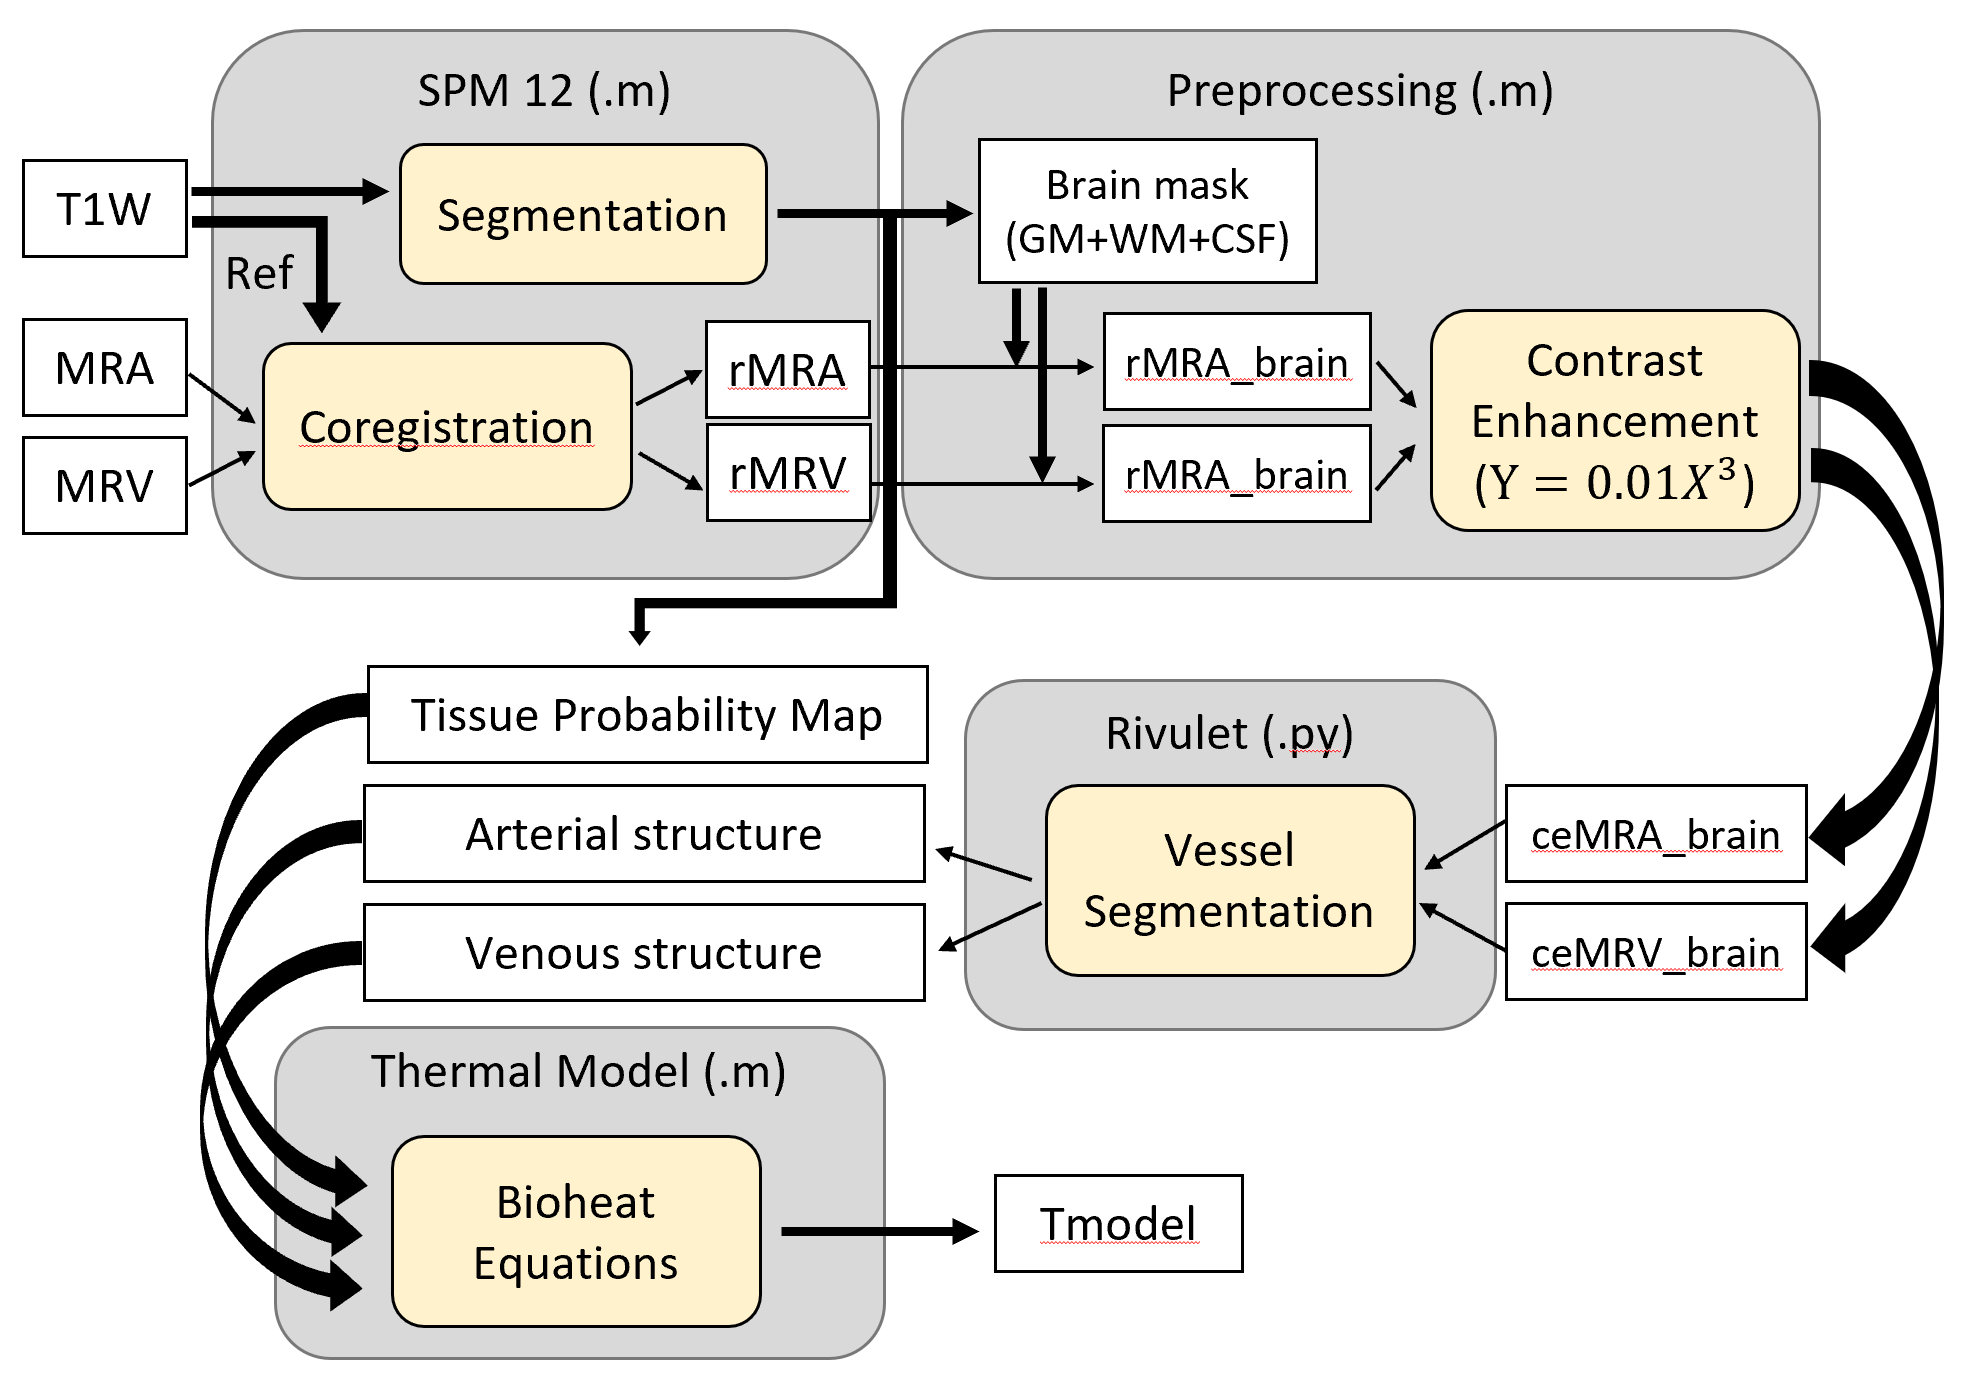
MR data was collected from 21 healthy subjects (27±3 years old, 12 males and 9 females) on a 3T MR scanner (PrismaFit, Siemens, Erlangen, Germany) using a 32-channel phased array head coil (Siemens). A T1-weighted magnetization-prepared rapid gradient-echo (MPRAGE) sequence (TR/TI/TE=2300/900/3.39ms, flip angle (FA)=9°, FOV=256×256mm2, matrix size=192×192, 160 slices, slice thickness=1mm) was used to acquire high resolution structural images. MR angiography (MRA) was collected using a 3D time-of-flight (TOF) sequence (TR/TE/FA=22ms/3.86ms/15°, FOV=200×200mm2, matrix size=256×256, slice thickness=0.62mm). MR venography (MRV) was collected using a 2D TOF sequence (TR/TE/FA=18ms/3.79ms/60°, FOV=220×220mm2, matrix size=256×256, slice thickness=3.0mm). Echo-planar spectroscopic imaging (EPSI) (TR1/TR2/TE=1551/511/17.6ms, FA=71°, FOV=280x280mm2, and interpolated resolution=64x64x32) was acquired for WB-MRT. Axillary temperature was measured continuously during the scan.WB-MRT maps were generated using MIDAS.4,5 Quality control measures included metabolite linewidth <13Hz, water linewidth <12Hz, Cramer–Rao lower bounds of water <2%, frequency shift <20Hz, and temperatures between 35-40°C. Chemical shift differences between water and N-acetylaspartate were used to calculate temperature as previously reported.6 T1-weighted images were segmented into 5 domains (gray matter, white matter, cerebrospinal fluid, skull, and fat) using SPM 12. MRA, MRV, and WB-MRT were coregistered to T1-weighted image space (1.3×1.3×1.0 mm3 resolution). MRA and MRV were preprocessed with a power-law transformation (Y=0.01X3), followed by vessel segmentation using the automated software Rivulet,7 identifying locations of vessel nodes (initial and terminal point of each vessel segment), diameters, and connections. Vessel structure was then augmented using a rapidly exploring random tree (RRT) algorithm. Whole brain simulated temperature maps were generated with our previously reported brain thermal model3 using subject-specific MR input data and compared to WB-MRT. The processing pipeline is shown in Figure 1. A threshold of |0.8°C| based on a previous phantom study was used to determine agreement between simulated and MR-measured temperatures.8 Bland-Altman plots were used for voxel-wise comparisons between MR-measured and model-predicted temperatures. To identify spatial gradients, average temperatures in frontal, temporal, parietal, and occipital lobes were calculated for all subjects. All values are reported as the mean ± standard deviation (SD) unless otherwise noted.
Results
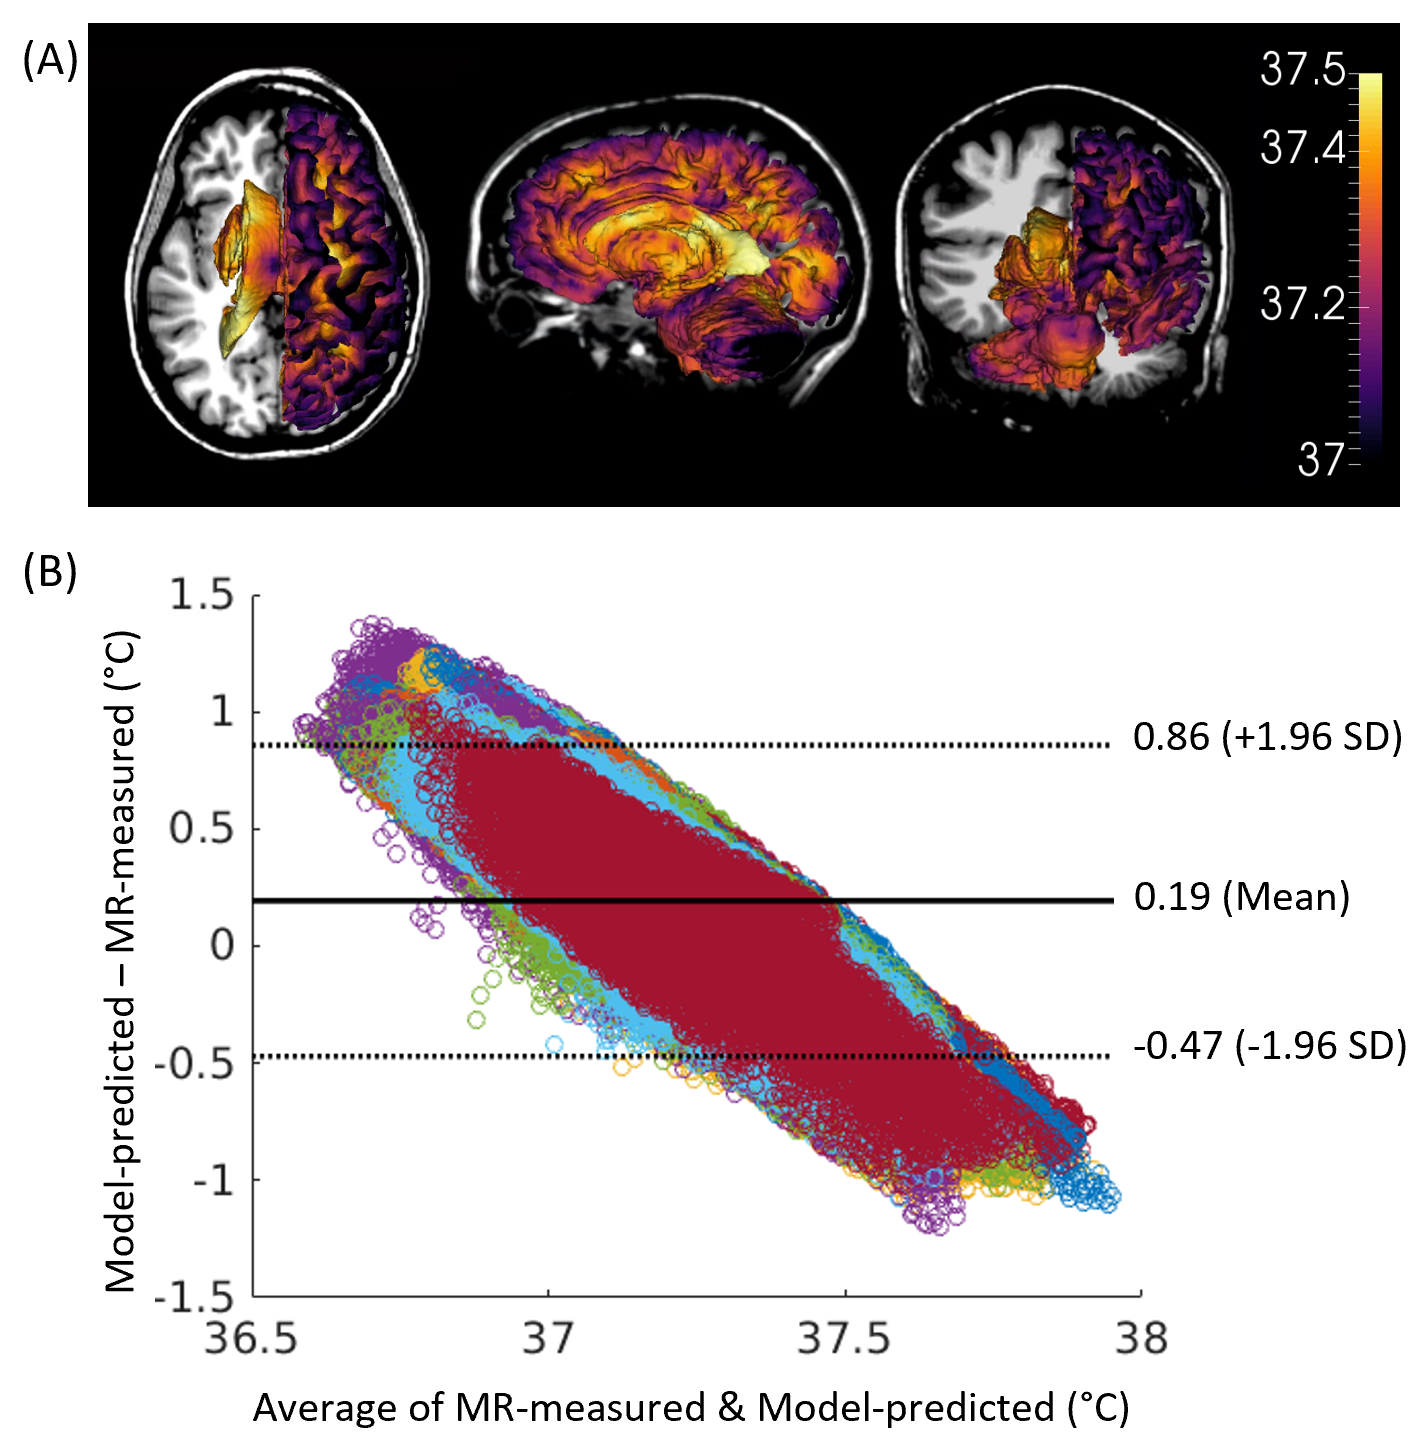
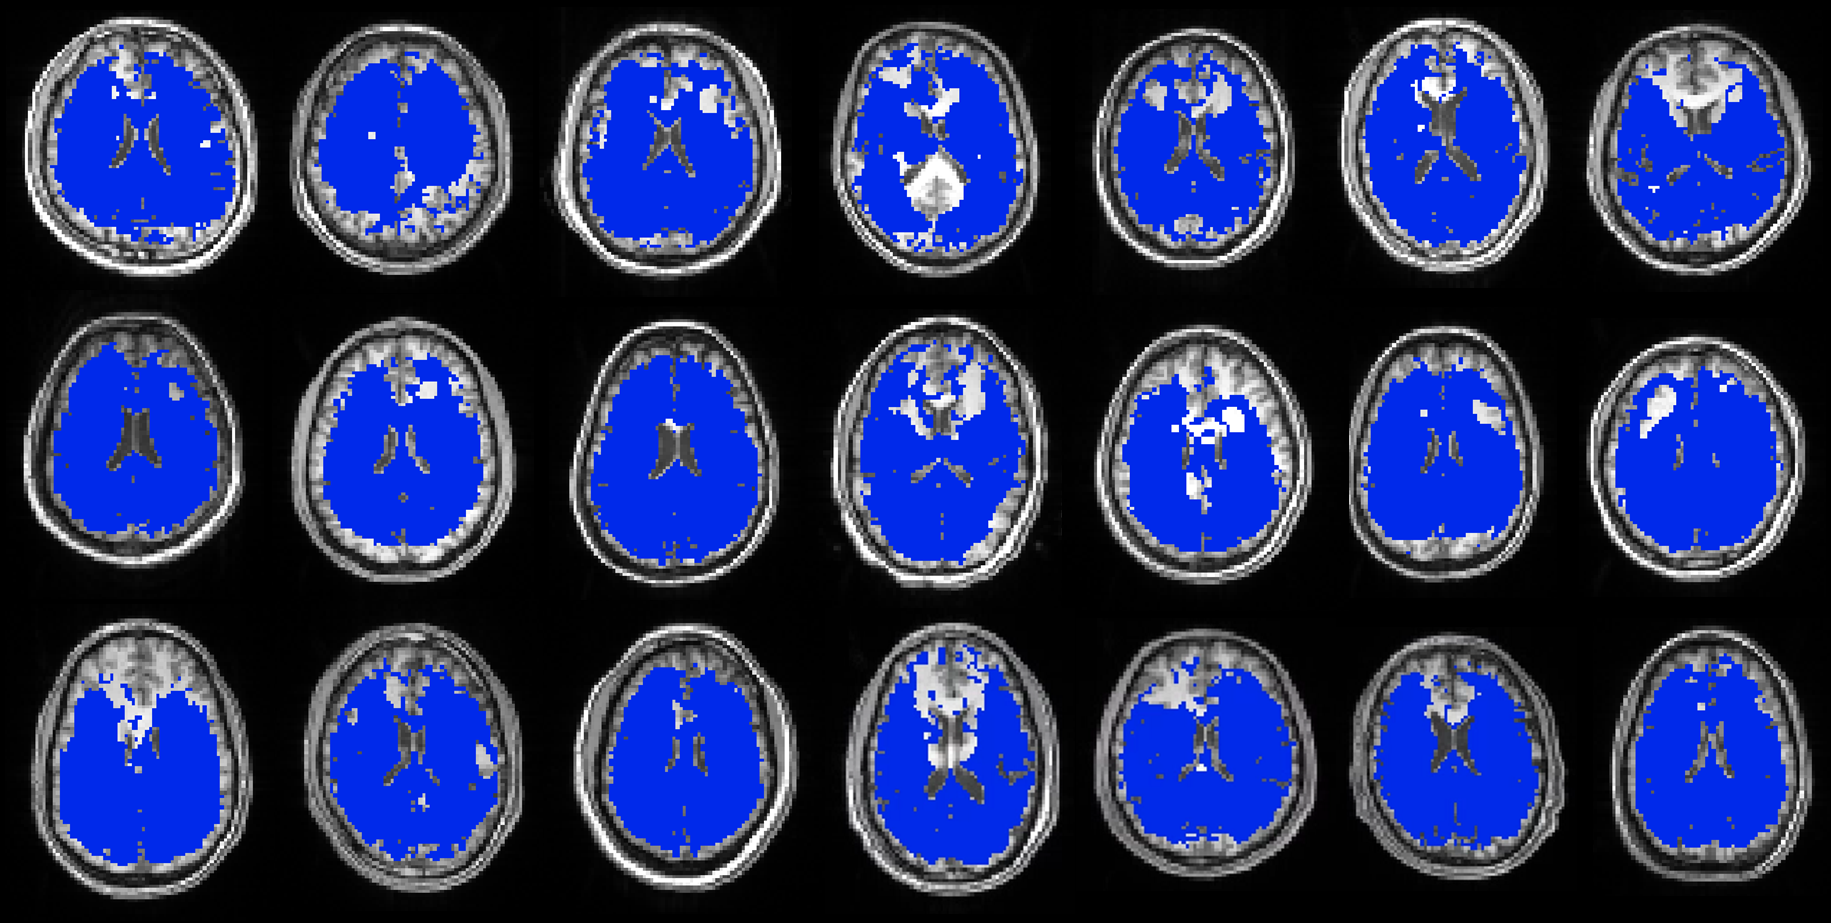
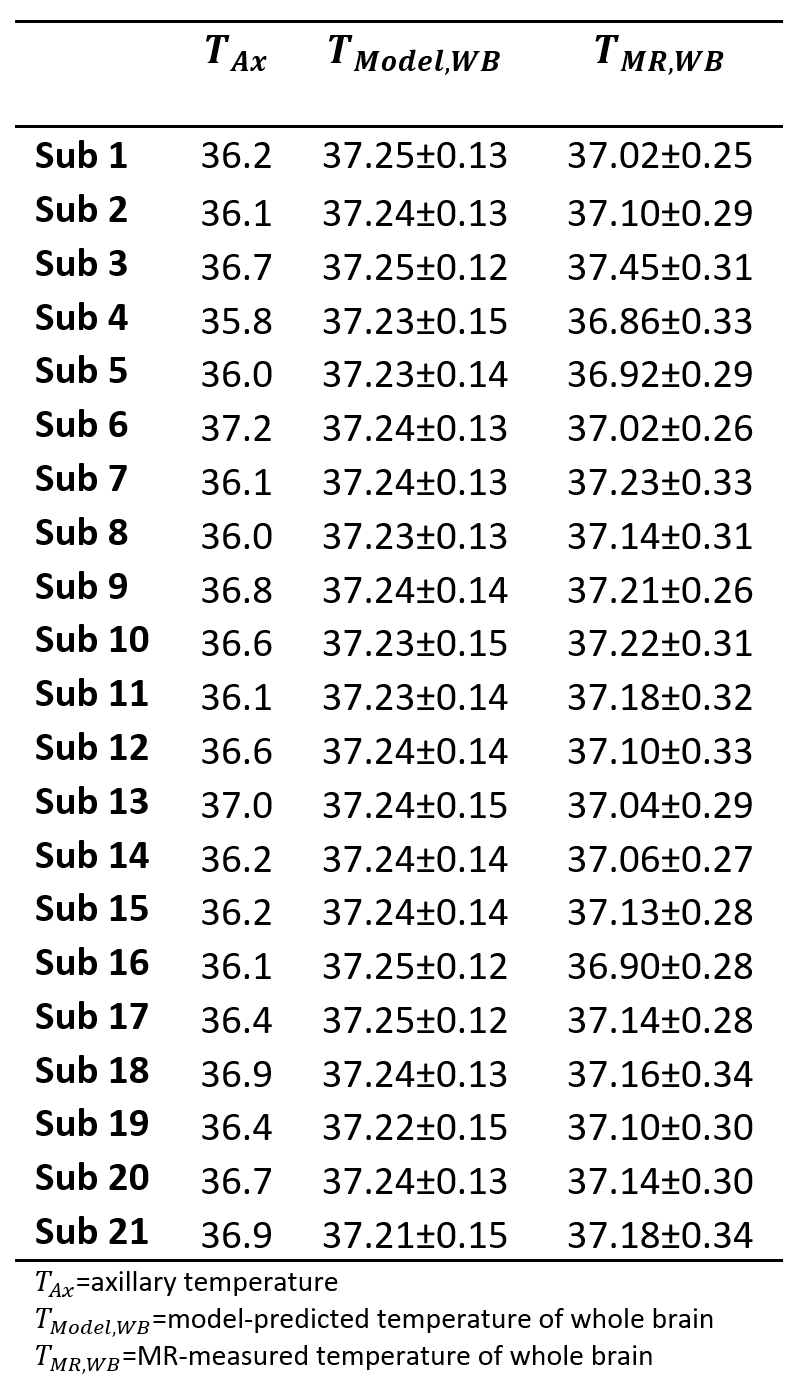
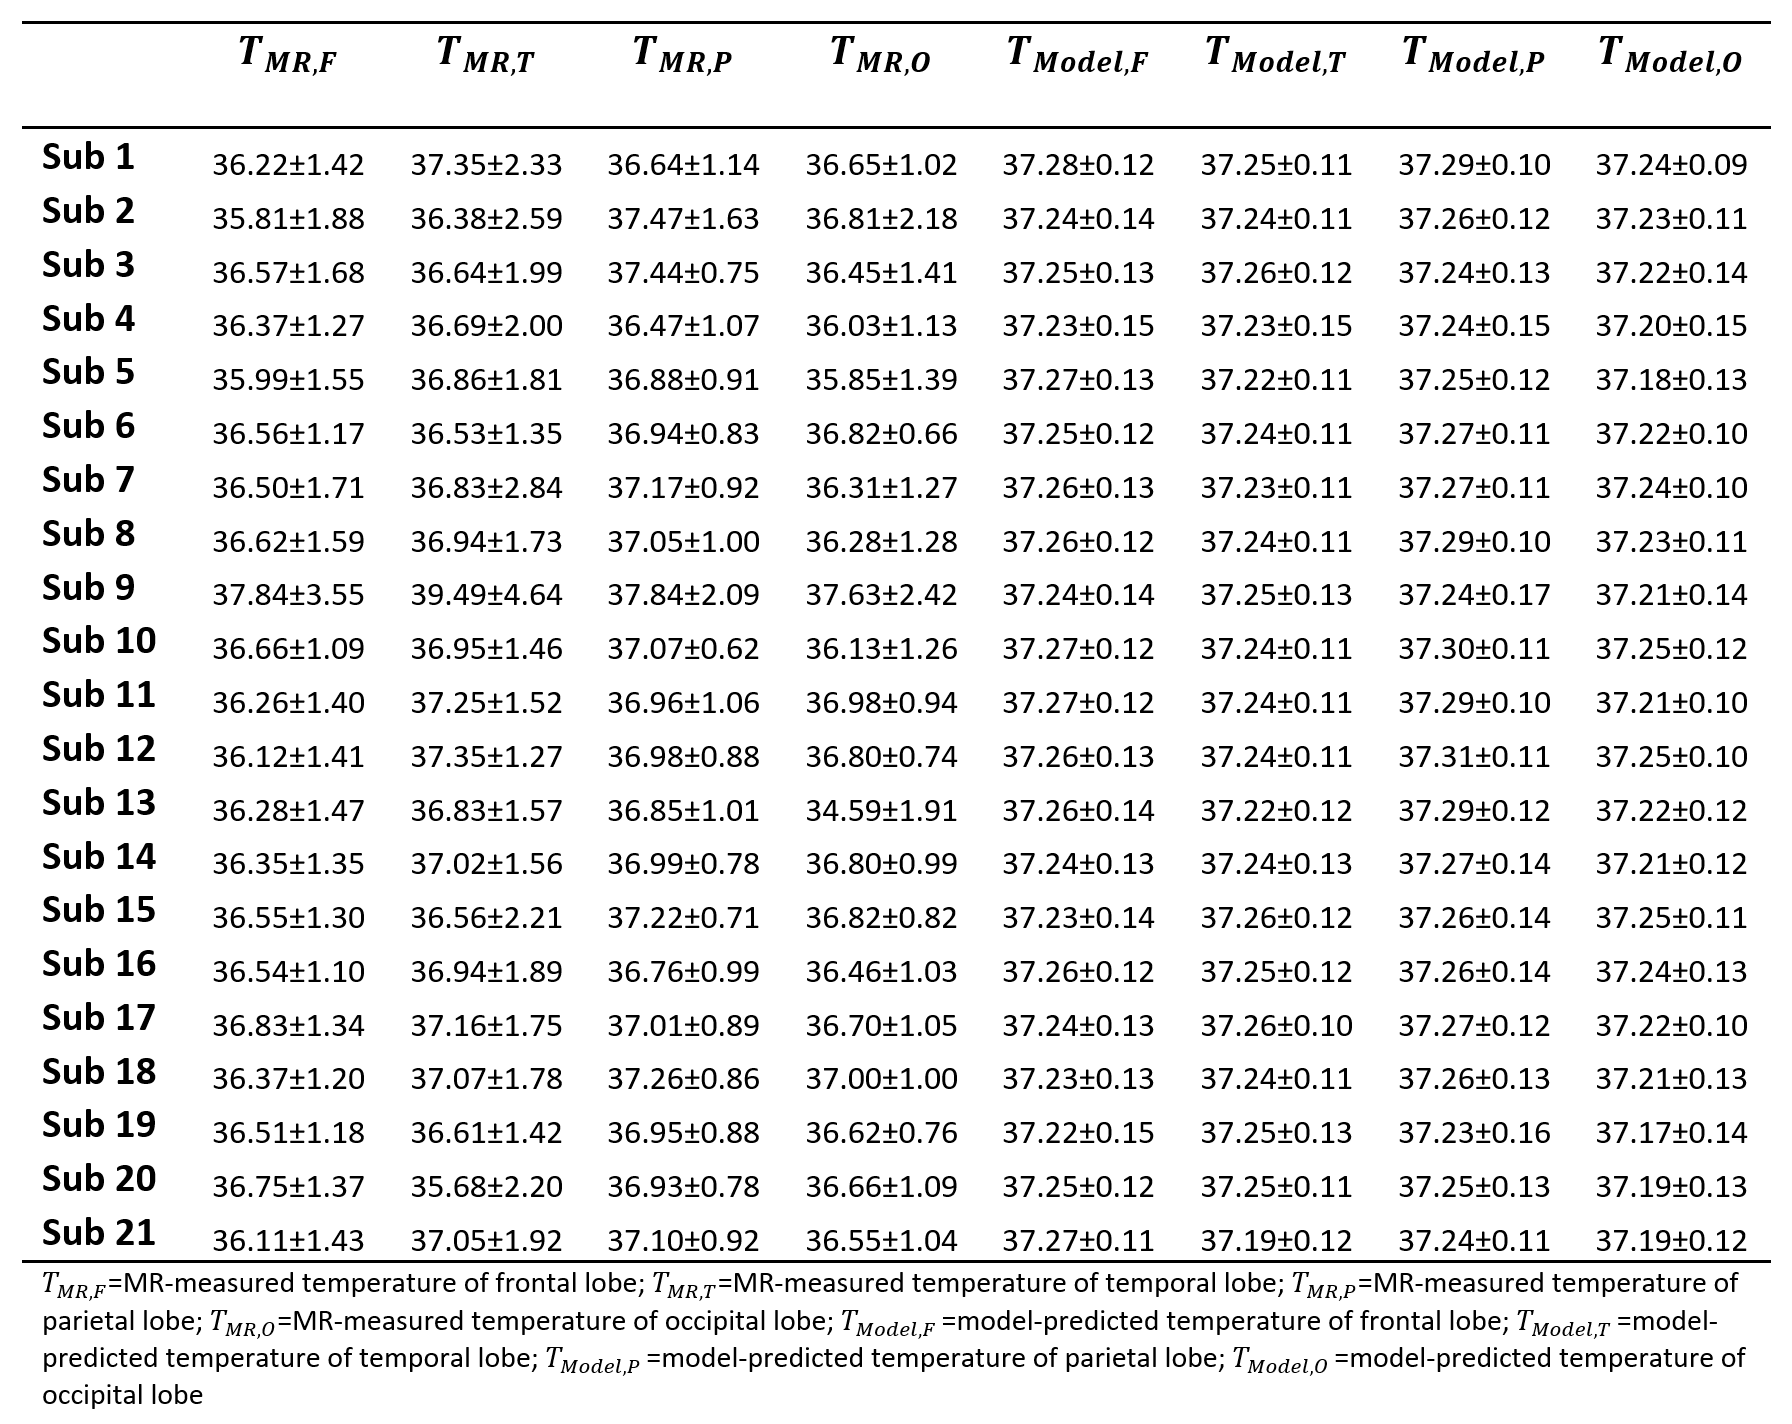
Model-predicted temperatures showed similar spatial gradients across all subjects such as relatively higher temperatures in caudate, putamen, and ventricles and relatively lower temperatures in frontal and temporal cortical gray matter and cerebellum (Figure 2A). From voxel-wise comparisons using Bland-Altman plots, 95.0% of all voxels were within the limit of agreement (±1.96 SD from the mean) (Figure 2B). Bland-Altman plots indicated the model-predicted temperatures were higher than MR-measured temperatures at the lower range of temperatures (<36.9°C), and lower than MR-measured temperatures at the higher range of temperatures (>37.5°C). For 20 out of 21 subjects, MR-measured and model-predicted temperatures were within the agreement threshold (|0.8°C|) for >90% of voxels. Threshold maps for all subjects are presented in Figure 3. The average within-threshold voxel percentage across all subjects was 97.0±3.3%. Both model-simulated and MR-measured brain temperatures were higher than body temperature with mean differences across all subjects of 0.8±0.4°C and 0.7±0.4°C, respectively (Table 1). From regional analysis, average model-predicted temperature values across all subjects were 37.25±0.13, 37.24±0.12, 37.27±0.12, and 37.22±0.12°C for frontal, temporal, parietal, and occipital lobes, respectively. Average MR-measured temperature values were 36.47±1.50, 36.96±1.99, 37.05±0.99, and 36.52±1.21°C for the same respective lobes (Table 2).Discussion
We evaluated voxel-wise accuracy and reproducibility of our personalized brain temperature model using comparison with MR-measured brain temperatures in healthy human subjects. Except for portions of the frontal lobe where EPSI data was not acquired to avoid the sinus region, the majority of voxels (>96%) had good agreement between model-simulated and MR-measured temperatures. Although Bland-Altman analysis supports strong agreement between modeled and MR-measured temperatures, experimental uncertainties (e.g., due to motion and long scan times) and model uncertainties in parameters such as perfusion pressure may have contributed to differences at the upper and lower temperature ranges. From regional analysis, both model-simulated and MR-measured temperature showed highest temperatures in the parietal lobe, with 0.5°C lower temperatures in the occipital lobe, showing similar thermal gradients across methods and subjects.Conclusion
Personalized 3D brain temperature predictions for 21 healthy subjects were compared with WB-MRT, and both methods revealed similar voxel-wise temperatures and spatial gradients. As brain temperature is an important factor for patients after brain injury or ischemia, our personalized model of healthy brain temperature provides an important baseline for further development of an injury model.Acknowledgements
No acknowledgement found.References
1. Yablonskii DA, Ackerman JJ, Raichle ME. Coupling between changes in human brain temperature and oxidative metabolism during prolonged visual stimulation. Proc Natl Acad Sci USA. 2000;97:7603-7608
2. Fleischer CC, Wu J, Qiu D, Park S-E, Nahab F, Dehkharghani S. The brain thermal response as a potential neuroimaging biomarker of cerebrovascular impairment. Am J Neuroradiol. 2017;38:2044-2051
3. Sung D, Kottke PA, Risk BB, Allen JW, Nahab F, Fedorov AG, Fleischer CC. Personalized predictions and non-invasive imaging of human brain temperature. Commun Phys. 2021;4:1-10
4. Ebel A, Maudsley AA. Detection and correction of frequency instabilities for volumetric 1H echo‐planar spectroscopic imaging. Magn Reson Med. 2005;53:465-469
5. Maudsley AA, Goryawala MZ, Sheriff S. Effects of tissue susceptibility on brain temperature mapping. Neuroimage. 2017;146:1093-1101
6. Prakash KN B, Verma SK, Marchenko Y, Seramani S, Sadananthan SA, Michael N, Childs C, Jia L, Maudsley AA, Velan SS. Echo planar spectroscopic imaging based temperature calibration at 7T and 3T for whole brain temperature measurement in rodents and humans. Proc. Int. Soc Magn Reson Med. 2014;22:2871
7. Liu S, Zhang D, Song Y, Peng H, Cai W. Automated 3-D neuron tracing with precise branch erasing and confidence controlled back tracking. IEEE Trans Med Imaging. 2018;37:2441-2452
8. Dehkharghani S, Mao H, Howell L, Zhang X, Pate K, Magrath P, Tong F, Wei L, Qiu D, Fleischer C, Oshinski JN. Proton resonance frequency chemical shift thermometry: Experimental design and validation toward high-resolution noninvasive temperature monitoring and in vivo experience in a nonhuman primate model of acute ischemic stroke. Am J Neuroradiol. 2015;36:1128-1135
Figures