0702
Detection of Laser-Associated Heating in the Brain During Simultaneous BOLD-fMRI and Optogenetic Stimulation1Biomedical Engineering, Vanderbilt University, Nashville, TN, United States, 2Vanderbilt University Institute of Imaging Science, Vanderbilt University, Nashville, TN, United States, 3Radiology and Radiological Sciences, Vanderbilt University, Nashville, TN, United States
Synopsis
Optogenetic stimulation with BOLD-fMRI has been applied in studies of brain circuits, by selectively exciting optical fluorophores with wavelength-specific light. However, the light used for stimulation may induce non-negligible heating effects. Because BOLD fMRI is mainly based on relatively long TE gradient-recalled echo acquisitions that are also suitable for measuring temperature changes with the proton resonance frequency (PRF) shift, we can monitor simultaneously the neural effects and laser-associated heating. We proposed a processing pipeline to calculate temperatures from BOLD images based on PRF shift thermometry and detect small temperature rises induced by laser-associated heating with general linear modeling.
Introduction
Optogenetic techniques are valuable for selectively exciting neurons targeted by a wavelength-specific fluorophore that responds only to laser light with a specific wavelength1, the effects of which can be detected using BOLD fMRI2. However, the lasers used to excite the optical fluorophores may produce non-negligible thermal effects in neural tissues3. BOLD fMRI is conventionally based on relatively long TE gradient-recalled echo (GRE) acquisitions which are also suitable for real-time temperature monitoring, so the opportunity arises to simultaneously monitor the neural effects of optogenetic neuromodulation and concomitant tissue heating caused by the laser. We describe a processing pipeline to calculate temperature maps from BOLD images and detect small temperature rises associated with laser stimulation using general linear modeling and based on the proton resonance frequency (PRF) shift with temperature4.Methods
Animal Preparation: Figure 1 illustrates the experimental setup. A squirrel monkey transfected using AAV5/9-CaMKIIa-ChR2 in secondary somatosensory cortex (S2) was pre-anesthetized with ketamine and anesthesia was maintained with isoflurane (0.9-1.5%) delivered in a 70:30 N2O/O2 mixture during functional data acquisition. ChR2 has a peak excitation wavelength of 470 nm (blue light). An optical fiber with tip area 0.0314 mm2 was inserted into the left side of S2. All procedures were conducted in accordance with NIH guidelines and were approved by the IACUC at Vanderbilt University.Data Acquisition: fMRI and structural images were collected on a Varian DirectDriveTM/Agilent MR spectrometer horizontal 9.4-T magnet using a birdcage head coil. BOLD fMRI images were acquired with a 2-shot T2*-weighted 2D GRE-EPI sequence with TE/TR = 10ms/1500ms, in-plane resolution = 0.86 x 0.86 mm2, slice thickness = 1 mm, 24 slices and 290 volumes. High-resolution T2*-weighted structural images were acquired with in-plane resolution 0.12 x 0.12 mm2 in the same session.
Laser Stimulation Protocol: During imaging, blue (473 nm) and green (561 nm) light emissions with power 30 mW and 20 Hz pulses were delivered in an interleaved fashion. After acquiring 10 baseline volumes (3s / volume), 30 second-duration blocks of interleaved blue and green light were repeated 28 times. The protocol was repeated with three laser duty-cycles of 3s/30s (10%), 6s/30s (20%), and 9s/30s (30%) for each pulse.
Temperature Map Calculation and Processing: Figure 2 shows how the images were processed to calculate temperature changes. Complex-valued BOLD-fMRI images were reconstructed from raw data with EPI phase correction. Then, the hybrid referenceless and multi-baseline subtraction thermometry method5,6 was used to calculate a voxel-wise temperature time series based on the PRF shift, while removing dynamic background phase variations due to motion, respiration, and cardiac pulsation. Next, a general linear model was fit to the temperature time series (no spatial smoothing) at each voxel for the stimulation presentation paradigm using FSL7 to quantify the temperature changes during the stimulation. No convolution function was used in the model. Finally, a statistical threshold was applied to identify the voxels that exhibited significant temperature changes (p < 0.05, FDR corrected).
Results
Figure 3 shows a movie of calculated temperature through time, using conventional baseline subtraction and hybrid multi-baseline thermometry. Compared with baseline subtraction thermometry, hybrid multi-baseline thermometry reduced confounding phase variations caused mainly by respiration that otherwise obscure true temperature changes caused by the laser. Figure 4 plots the mean temperatures through time in 2 x 2-voxel ROI of size 1.72 x 1.72 mm2 around the probe. The blue and green columns in the background indicate when the blue and green lasers were on. For 3-second/10% duty cycle illumination there is very little apparent temperature change due to the lasers, but the temperatures start to peak for 6-second/20% duty cycle illumination and temperature peaks closely follow laser illumination in the 9-second/30% duty cycle case. Figure 5 shows z-statistic temperature ‘activation’ maps and parametric temperature change maps overlayed on structural images, for each duty cycle and laser color. The parametric temperature change maps represent the average amount by which the temperature increased due to the laser in each voxel. The white arrows indicate the position of the laser probe. Similar to the ROI temperature curves, little activation is seen for the 3-second illumination protocol for both blue and green light, while the 3-second and 9-second protocols show stronger activation and temperature rises.Discussion
Optogenetic stimulation in combination with BOLD fMRI provides a powerful method for neuron type-selective neuromodulation with simultaneous read-out of effects, both locally and over the whole brain. At the same time, the lasers used to stimulate the optogenetic effect may cause heating that could confound the results. In this work, we demonstrated how BOLD-fMRI images can be used to simultaneously detect small temperature changes on the order of tenths of a degree Celsius caused by the lasers used for optogenetic neuromodulation. At 30-mW power level, we found that detectable temperature rises appeared with laser protocols with duty cycles of 20% or higher, and that the two laser wavelengths induced similar levels of heating. Because control green light does not excite neurons as blue light does, the observed temperature changes are likely only attributable to PRF shifts caused by the laser8. These results and the technique could be useful for the design of optogenetic stimulation protocols and for monitoring confounding heating effects.Acknowledgements
We acknowledge the support of NIH grants U18 EB 029351 (HEAL), R01 EB028773, and R01 NS078680.References
- Carter, Matthew E., and Luis de Lecea. "Optogenetic investigation of neural circuits in vivo." Trends in molecular medicine 17.4 (2011): 197-206.
- O’Shea, Daniel J., et al. "Development of an optogenetic toolkit for neural circuit dissection in squirrel monkeys." Scientific Reports 8.1 (2018): 1-20.
- Albers, Franziska, et al. "Functional MRI readouts from bold and diffusion measurements differentially respond to optogenetic activation and tissue heating." Frontiers in neuroscience 13 (2019): 1104.
- Rieke V, Butts Pauly K. MR thermometry. J Magn Reson Imaging. 2008;27(2):376-390. doi:10.1002/jmri.21265
- V. Rieke, R. Instrella, J. Rosenberg, W. A. Grissom, B. Werner, E. Martin, and K. Butts Pauly. Comparison of temperature processing methods for monitoring focused ultrasound ablation in the brain. J Magn Reson Imag, 38(6):1462–71, 2013.
- Grissom WA, Rieke V, Holbrook AB, et al. Hybrid referenceless and multibaseline subtraction MR thermometry for monitoring thermal therapies in moving organs. Med Phys. 2010;37(9):5014-5026. doi:10.1118/1.3475943
- Jenkinson, Mark, et al. "FSL." Neuroimage 62.2 (2012): 782-790
- Yang, ZY, et al. BOLD response in squirrel monkey brains evoked by green light without exogenous opsin. ISMRM 2022 (submitted)
Figures
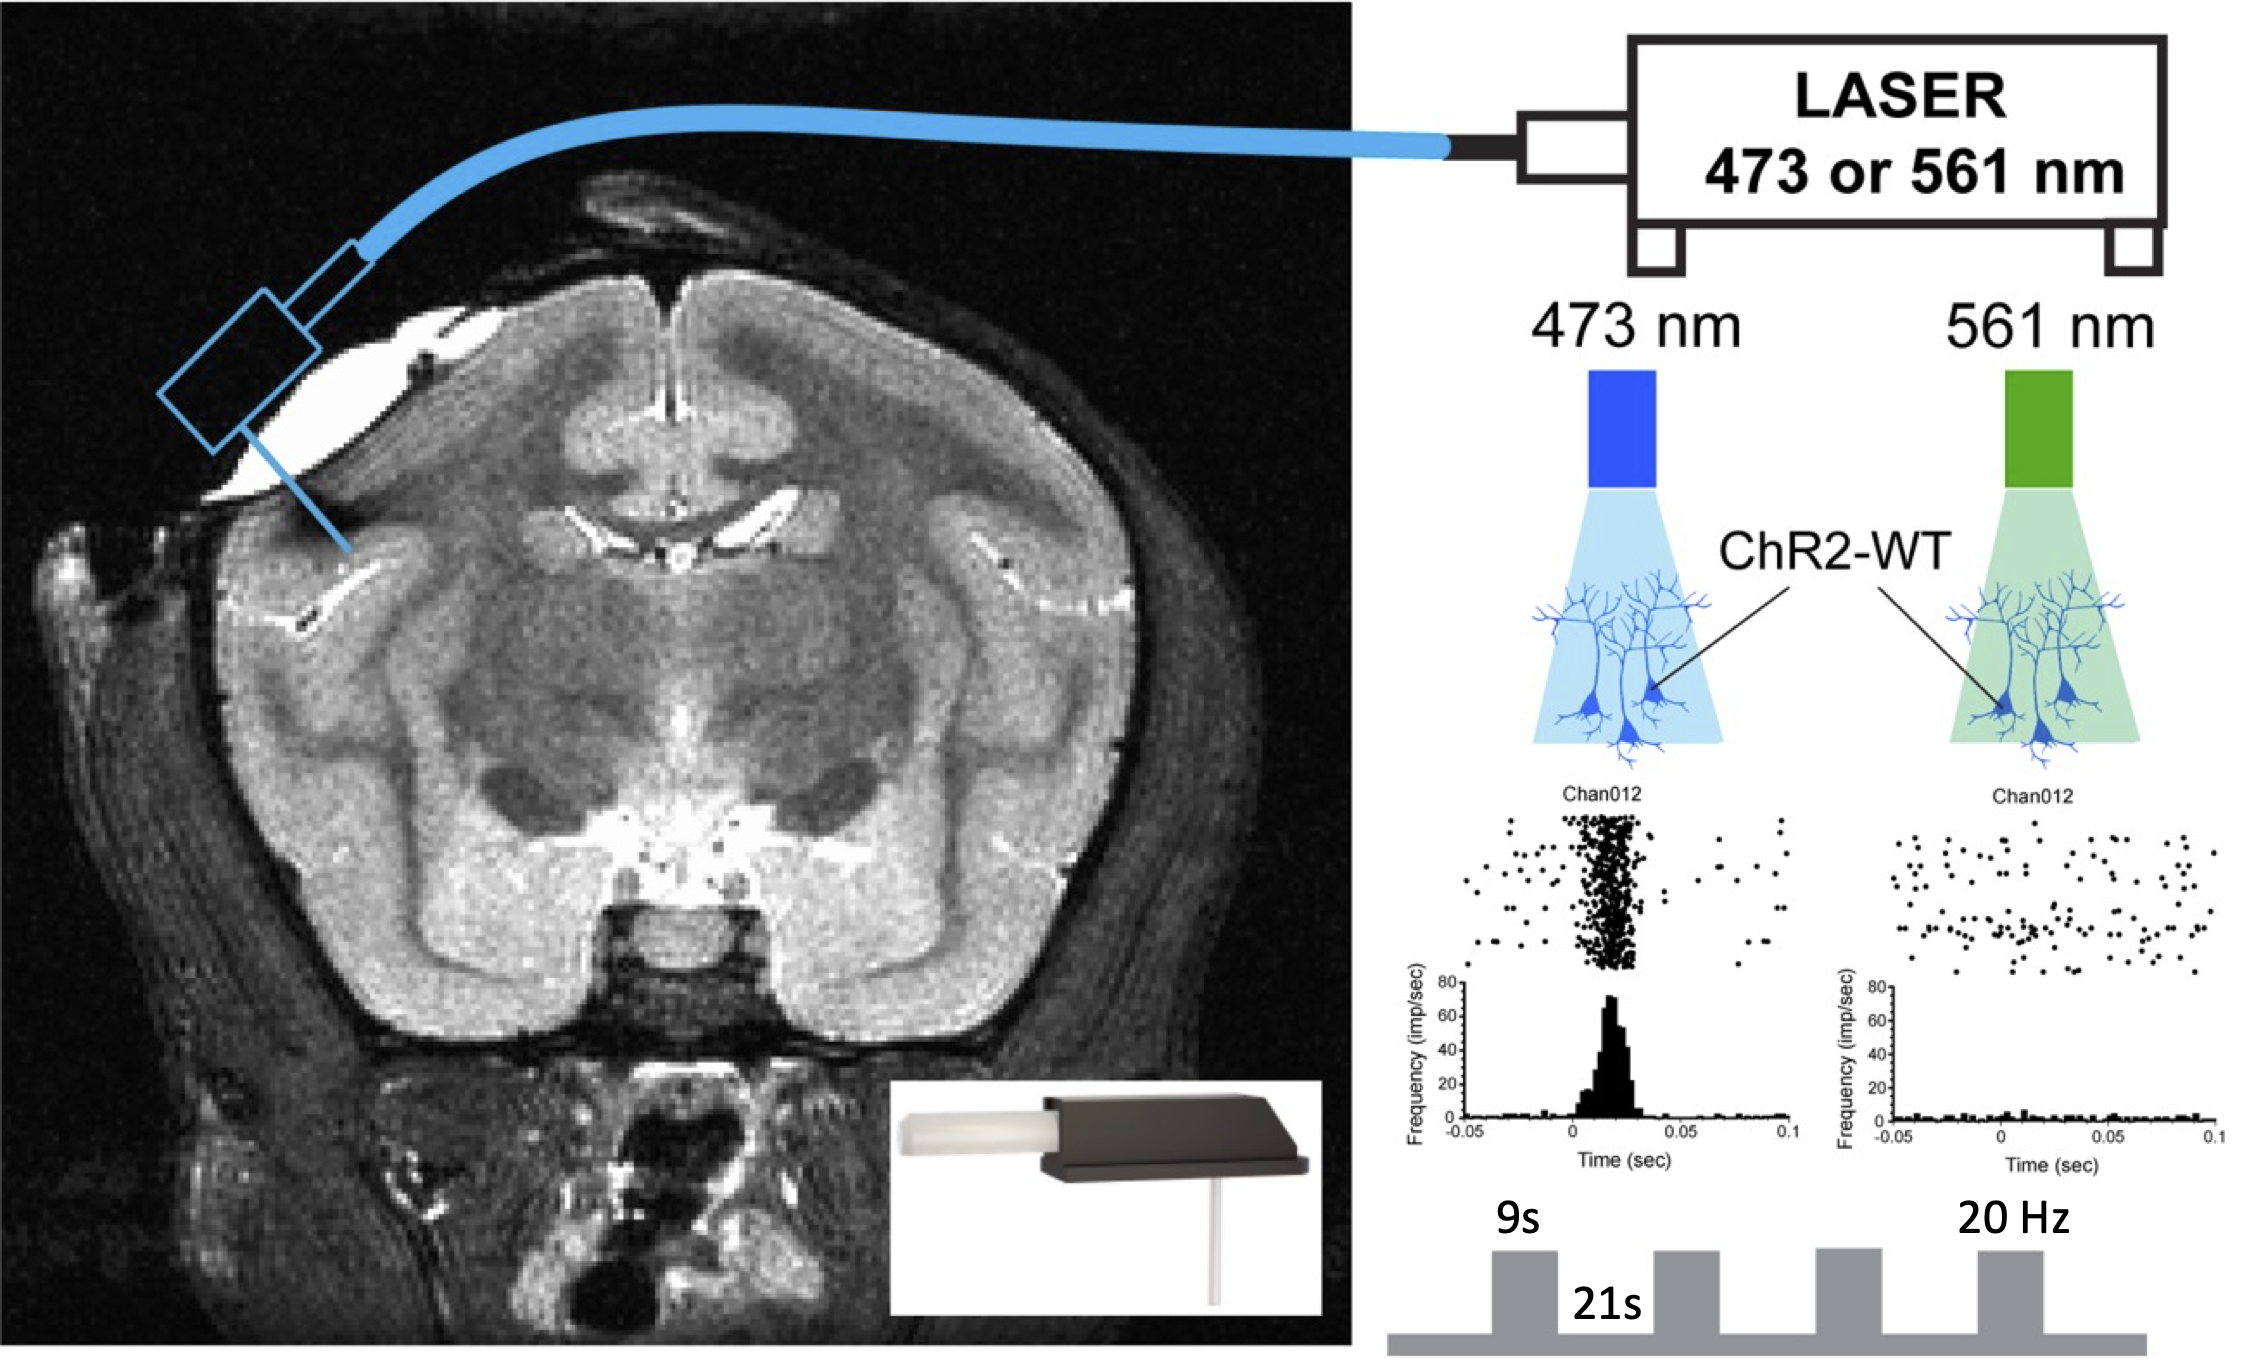
Figure 1. Schematic diagram of the simultaneous fMRI with optogenetic neuromodulation setup at 9.4. A laser fiber was implanted at the S2 cortex where AAV5/9-CaMKIIa-ChR2 virus was transfected (left panel). Squirrel monkey with optogenetically transfected cortical neurons was scanned simultaneously with alternating blue and green laser stimulation. The blue light activates neurons and evoked firing while green light acts as a control and does not excite neurons (right panel).
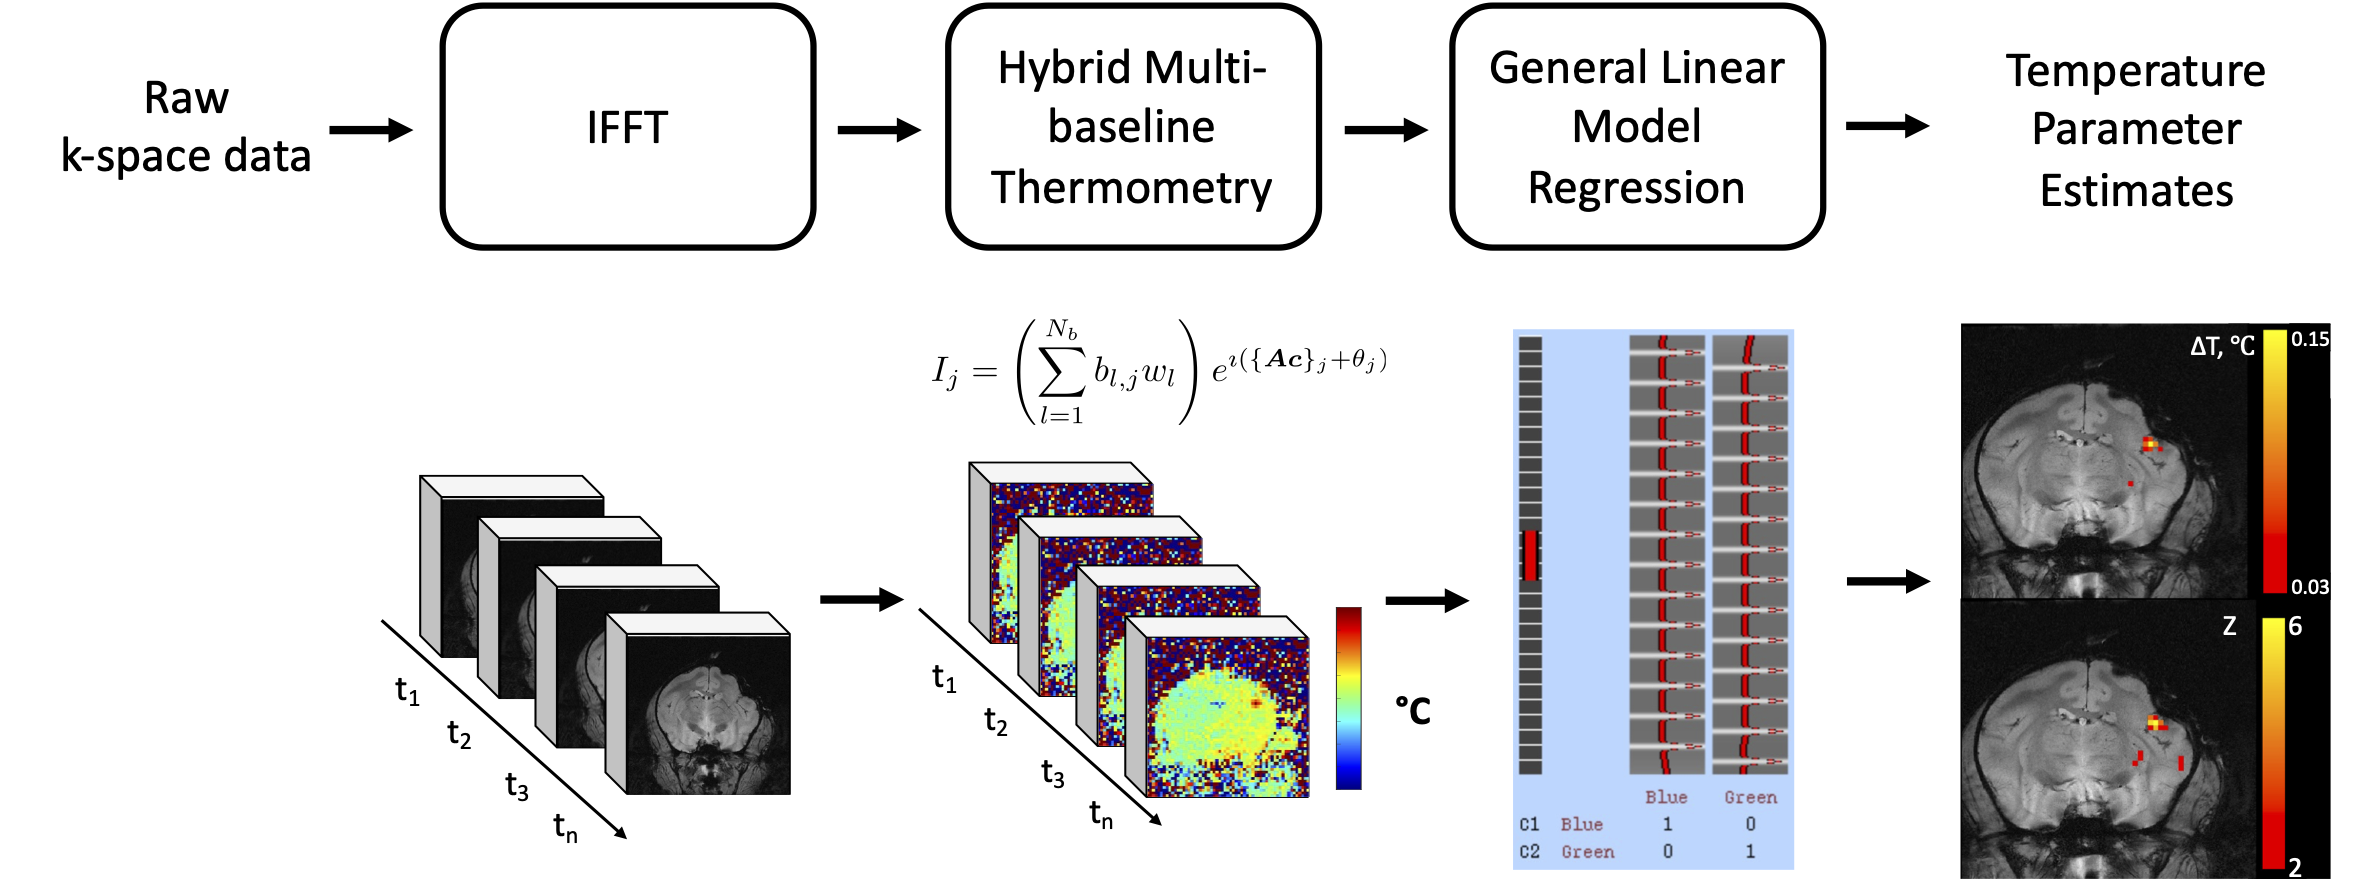
Figure 2. Temperature Map Calculation and Processing Pipeline. Raw images were reconstructed to a complex-valued time series which was converted to temperature maps using the hybrid multi-baseline thermometry method. Then GLM was applied using each laser stimulation protocol to generate parametric temperature and temperature ‘activation’ maps.
Figure 3. Temperature maps at selected time points from the 30% duty cycle dataset, with baseline subtraction thermometry vs. hybrid multi-baseline thermometry. Black arrows indicate the position of the laser probe. Compared with single-baseline thermometry, hybrid multi-baseline thermometry removed confounding erroneous temperature changes caused mainly by respiration, making the laser hotspot easier to observe.
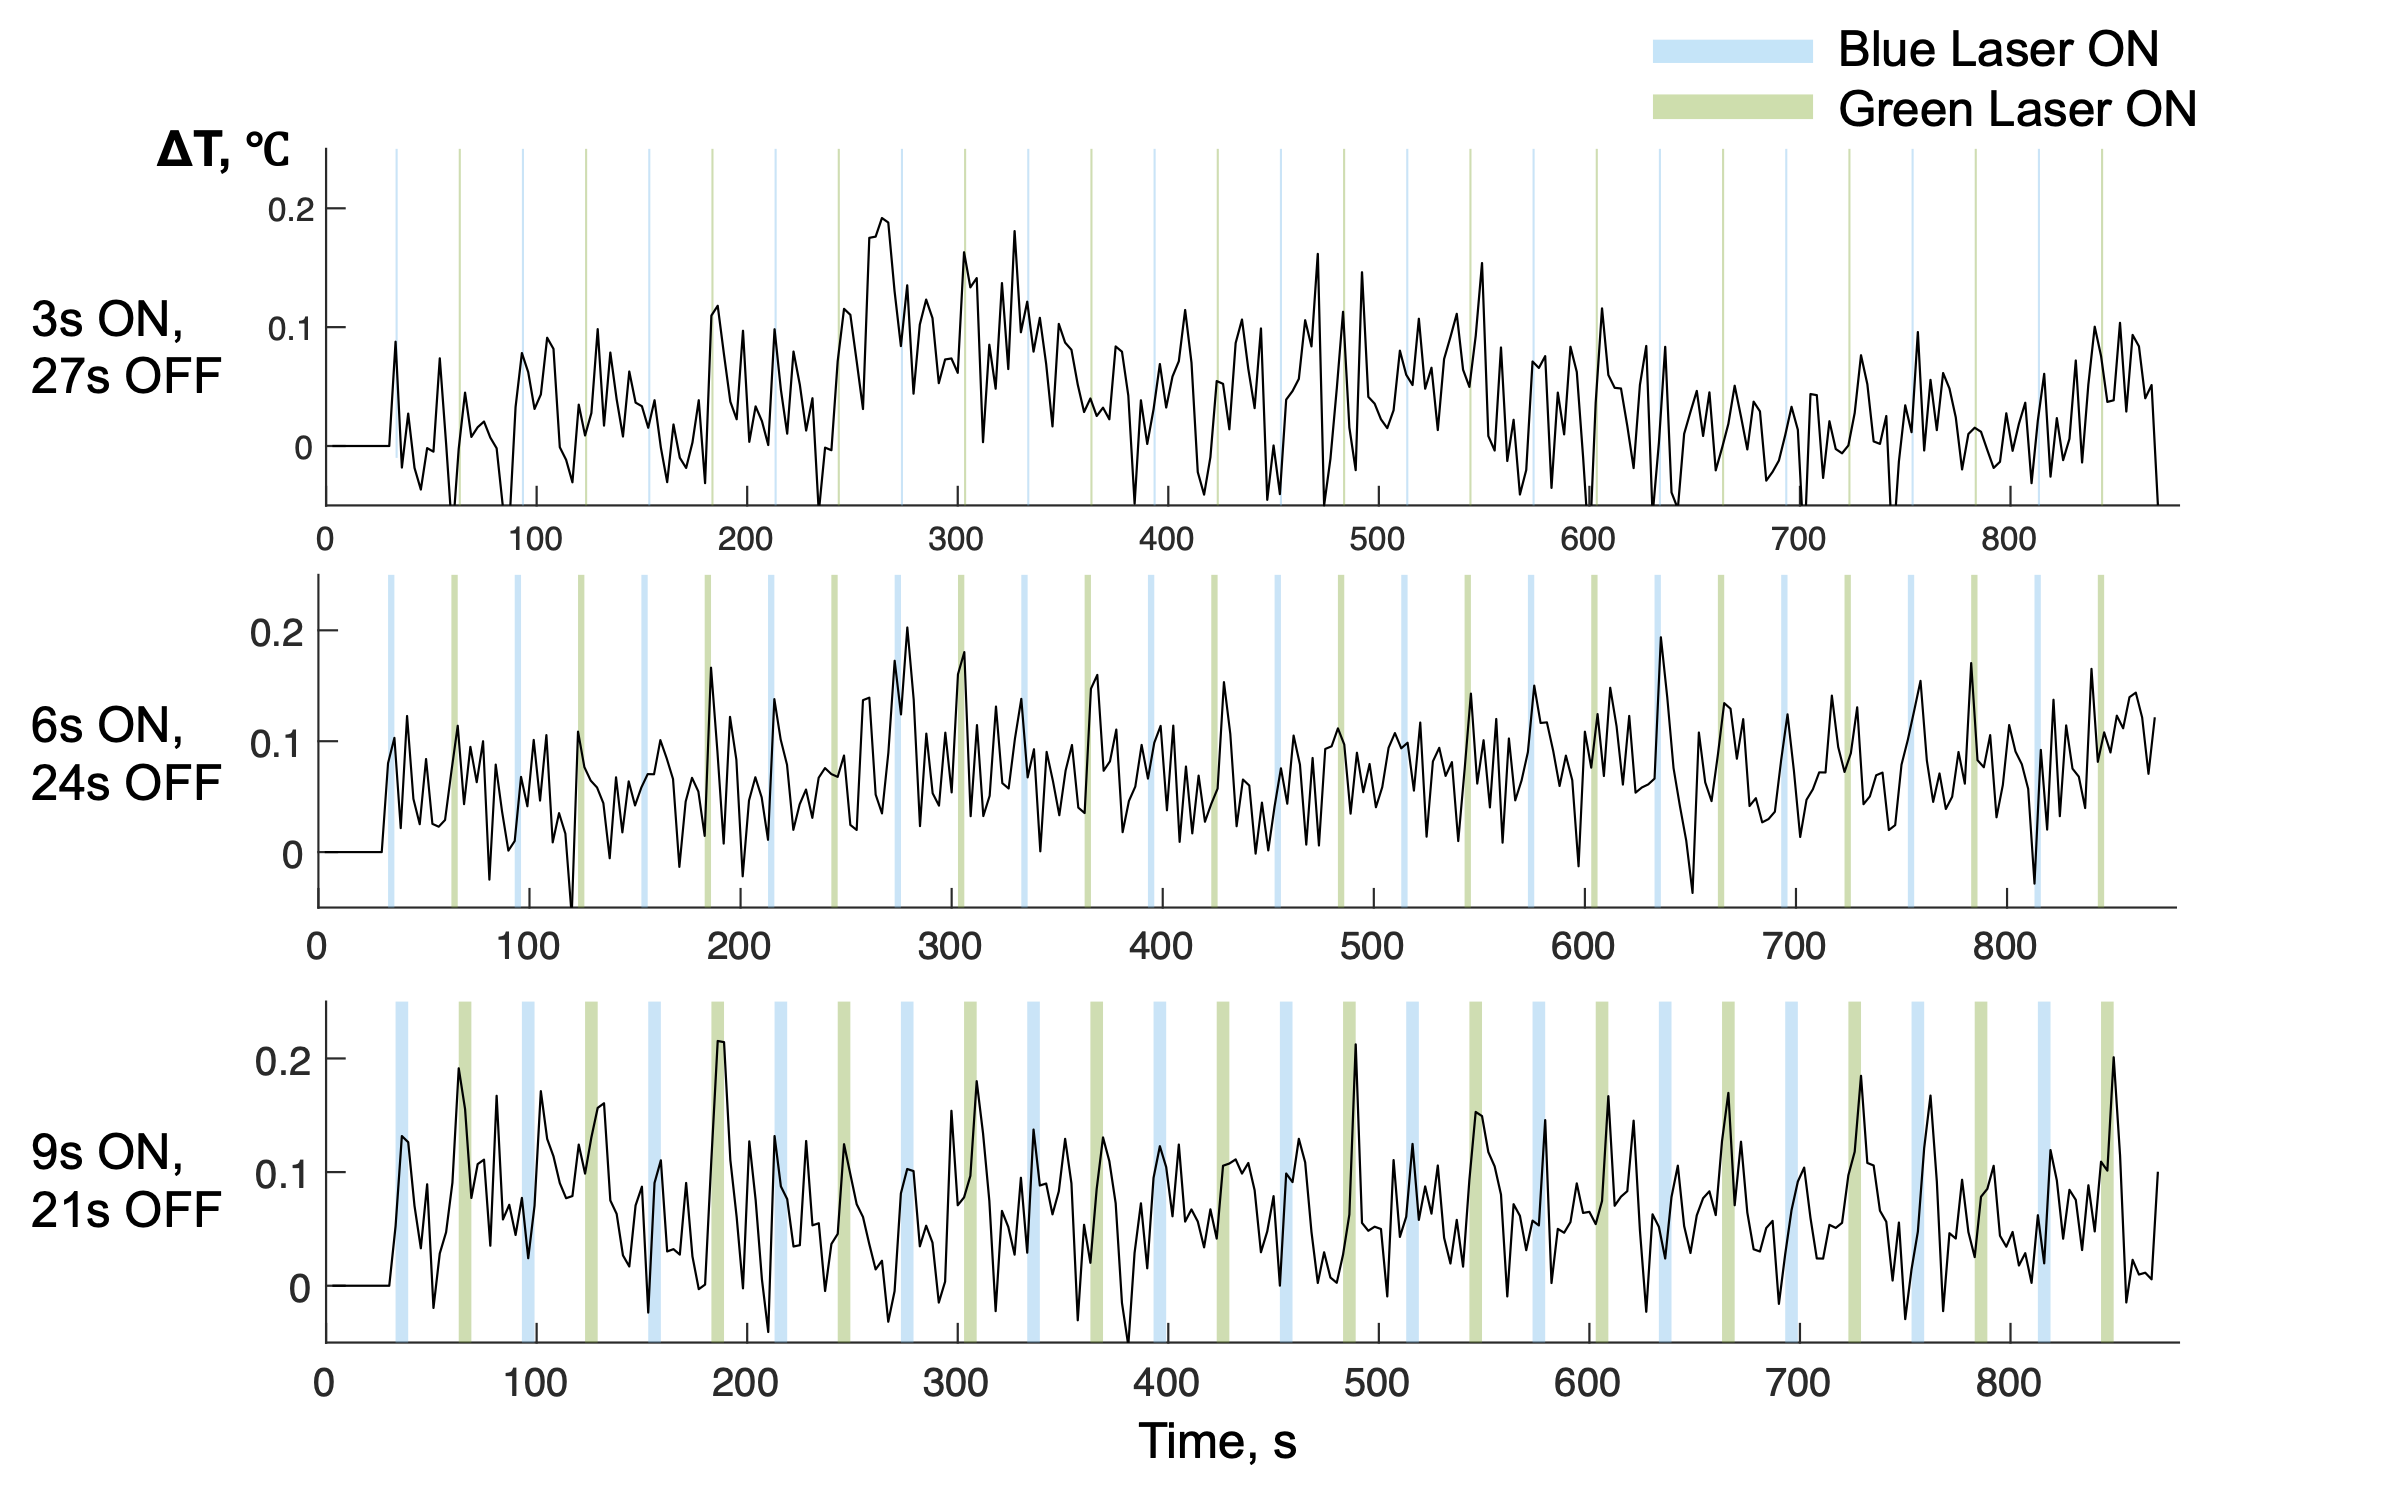
Figure 4. Mean temperature change versus time in an ROI of dimensions 1.718 x 1.718 mm2 (2 x 2 voxels) around the laser probe. The blue and green columns represent time blocks when blue and green lasers were turned on, and each row shows a different duty cycle. Temperature peaks during laser illumination are increasingly apparent with increasing duty cycle.
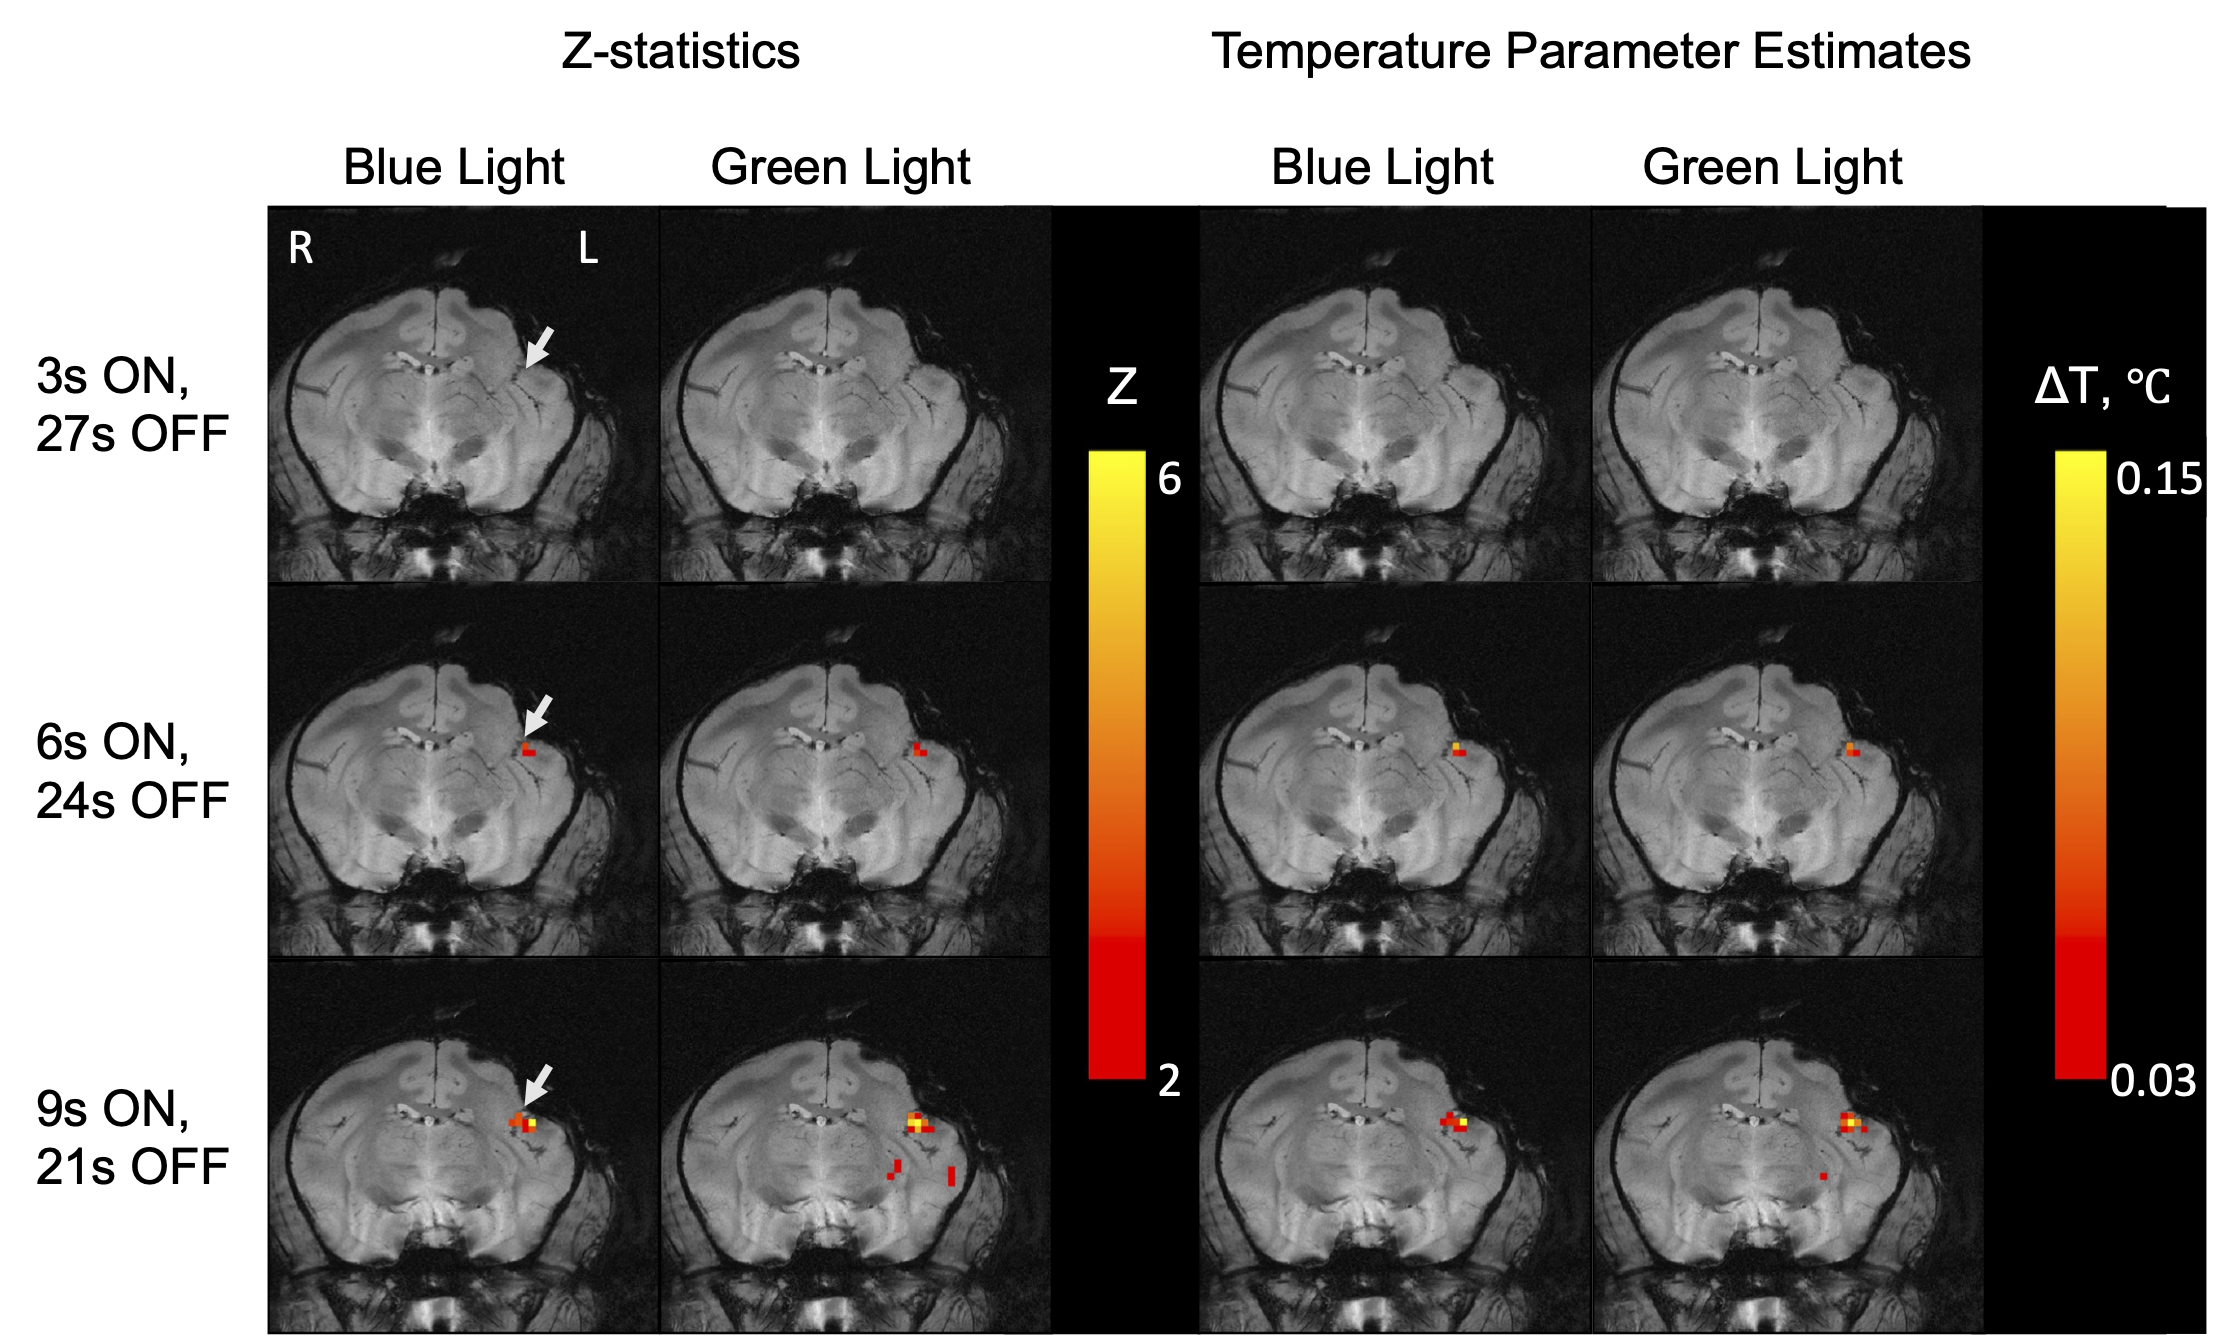
Figure 5. Z-statistic temperature ‘activation’ maps and quantitative parametric temperature change maps obtained from general linear modeling. The white arrows point to the position of laser probes. Detectable temperature rises were seen with 20% and higher laser duty cycle with both blue and green lasers.