0701
High-precision MR thermometry of RF heating in the upper thigh at 7T using a multi-echo water-fat separation model1Biomedical Engineering - Medical Imaging Analysis, Eindhoven University of Technology, Eindhoven, Netherlands, 2Center for Image Sciences - Computational Imaging Group, University Medical Center Utrecht, Utrecht, Netherlands
Synopsis
A multi-echo MRT approach is presented for application in RF safety assessment and validation of thermal simulations. By water-fat separation, more accurate determination of the drift field is possible. The method was tested in the thigh at 7T, using multi-transmit coils. Precision and accuracy were improved considerably compared to a previous single-echo fat-referenced method (precision: 0.09 vs 0.19 °C). Comparison of measured temperature distributions to simulated counterparts show good relative agreement in three subjects for multiple RF shim settings. Strikingly, simulated heating magnitudes mostly underestimated the observed heating with varying extent, suggesting a role for subject-specific parameters, such as perfusion.
Introduction
Current guidelines1 on RF safety in MRI are based on specific absorption rates (SAR); which does not necessarily correlate with local temperature increase2-4. Therefore, more insight into local temperature elevations would be highly desirable. Similar to SAR, temperature rise in MRI can be simulated. Unfortunately, these simulation models still lack solid validation5. MRI is capable of measuring the spatial distribution of temperature rise (MR thermometry, MRT). However, most studies on MRT show application for thermal treatments. Here, the temperature rise is considerable and often localized. Validation of thermal simulations of RF exposure requires much more precise and accurate MRT methods. First of all, compensation is required for the slow variation in field strength over time (drift field). These can be measured using field cameras6, but this requires considerable investment. Alternatively, a fat-referenced approach7 for drift field correction using the subcutaneous fat layer and near-harmonic 2D reconstruction8 has been presented. However, this method (single-echo model) is highly sensitive to fat layer thickness. Ideally, not only the subcutaneous fat layer but all fat signal within the image should be used. This was demonstrated for focused ultrasound MRT, using multiple echoes to separate the water and fat signal to consequently retrieve drift fields and temperature rise9,10. The aim of this study is to apply the same method for measurement of RF heating. For this purpose, the method was adapted to include the Salomir method8 within the iterative optimization (adapted multi-echo model). The resulting method was tested for the ability of measuring temperature rise in the thigh at 7T.Methods
The method as presented by Poorman et al.10 is based on the acquisition of multi-echo images and a signal model (figure 1a). For our purpose, we replaced the basis of polynomials for the drift field by a basis of spherical harmonics. Additionally, adaptations were made to the initialization (figure 1a); where the drift field is first fitted using only regions with high fat content. Subsequently, a good initialization for the whole region of interest is acquired by applying the method of Salomir8. To test the adapted multi-echo model, MRT measurements were performed on the thigh and compared to thermal simulations.Acquisition
MR scans were performed on a 7T system (Achieva, Philips Healthcare, Best, NL). Thigh imaging was performed in 3 subjects (3 male, age 22-42, BMI 18.4-24.9) where the leg was surrounded by 4 fractionated dipole antennas with receive loops (figure 1c)11. A subject-specific simulation model was generated for every subject and antennas were labeled with vitamin markers and placed in a plexiglass holder. For temperature measurement, spoiled 13-echo gradient echo MRT scans (TE1 13.48 ms, TEspacing 0.66 ms, TR 30 ms, 2.1x2.1x8 mm3 resolution, 170x170x8 mm3 FOV, flip angle 11°, single-shot, cardiac triggered) were acquired for 300 dynamics (296-399 seconds): a baseline scan without heating and a heating scan, constituting a 10 kHz off-resonance block pulse to acquire an average power of 5.3 W per channel12.
Simulations
After MRT, electromagnetic and thermal simulations (Sim4Life, ZMT, Zurich, CH) were performed on the Duke model13. The right thigh was replaced by a patient-specific model (figure 1d). Power and phase settings of individual channels were numerically optimized to ensure matching of measured and simulated |B1+|.
Results
In the MRT images acquired without heating (figure 2), the lower temporal standard deviation over the slice demonstrates a considerably higher precision (0.09 vs 0.19 °C, averaged over all volunteers) for the adapted multi-echo model compared to the single-echo model. A similar comparison between both approaches is provided in figure 3, where reconstructed temperature and field drift distributions are shown after 300 dynamics with heating. A graph diagram of heating over time is provided for 4 voxel locations (figure 3b). Again, the precision for the adapted multi-echo model is superior. Also, the method is more accurate because of its superior drift field reconstruction; MRT scans in volunteer 3 without heating and volunteer 2 with heating clearly show a residual drift field for the single-echo correction. The results of subject-specific electromagnetic simulations show that simulated |B1+| distributions are in excellent agreement with measurements (figure 4a). Locations of heating hotspots (figures 4b/c) in measurements match with simulations in most slices and volunteers. However, the simulated heating magnitude mostly underestimates the observed heating, with the degree of underestimation varying between volunteers. The animated multi-slice heating over time (figure 5) shows the occurrence of hotspots in the bottom and top right leg regions.Discussion and conclusion
We have adapted the multi-echo MRT methodology as presented by Poorman et al.10 for measuring RF induced heating in MRI. The proposed method reaches higher precision and accuracy in comparison to a previous method7,12. This is achieved by multi-echo water-fat separation, enabling the method to assess drift field correction using the fat signal in every voxel which severely reduced the sensitivity to fat layer thickness. Future work will focus on application in other imaging targets such as brain or prostate. Also, the effect of gradient imperfections on local TE14 and accounting for motion will be considered, which will most likely further improve precision. Finally, patient-specific perfusion properties will be explored in thermal simulations to find an explanation for the deviation in heating magnitude.Acknowledgements
No acknowledgement found.References
1. IEC. Medical electrical equipment. Part 2-33: particular requirements for the safety of magnetic resonance equipment for medical diagnosis. IEC 60601-2-33. 2015.
2. Murbach, M., Neufeld, E., Capstick, M., Kainz, W., Brunner, D. O., Samaras, T., ... & Kuster, N. (2014). Thermal tissue damage model analyzed for different whole‐body SAR and scan durations for standard MR body coils. Magnetic resonance in medicine, 71(1), 421-431.
3. Simonis, F. F. J., Raaijmakers, A. J. E., Lagendijk, J. J. W., & van den Berg, C. A. T. (2017). Validating subject‐specific RF and thermal simulations in the calf muscle using MR‐based temperature measurements. Magnetic resonance in medicine, 77(4), 1691-1700.
4. Van Rhoon, G. C., Samaras, T., Yarmolenko, P. S., Dewhirst, M. W., Neufeld, E., & Kuster, N. (2013). CEM43° C thermal dose thresholds: a potential guide for magnetic resonance radiofrequency exposure levels?. European radiology, 23(8), 2215-2227.
5. Van den Brink, J. S. (2019). Thermal effects associated with RF exposures in diagnostic MRI: overview of existing and emerging concepts of protection. Concepts in magnetic resonance part b, 2019.
6. Le Ster, C., Mauconduit, F., Mirkes, C., Bottlaender, M., Boumezbeur, F., Djemai, B., ... & Boulant, N. (2021). RF heating measurement using MR thermometry and field monitoring: Methodological considerations and first in vivo results. Magnetic Resonance in Medicine, 85(3), 1282-1293.
7. Simonis, F. F., Petersen, E. T., Lagendijk, J. J., & van den Berg, C. A. (2016). Feasibility of measuring thermoregulation during RF heating of the human calf muscle using MR based methods. Magnetic resonance in medicine, 75(4), 1743-1751.
8. Salomir, R., Viallon, M., Kickhefel, A., Roland, J., Morel, D. R., Petrusca, L., ... & Gross, P. (2011). Reference-free PRFS MR-thermometry using near-harmonic 2-D reconstruction of the background phase. IEEE transactions on medical imaging, 31(2), 287-301.
9. Grissom, W. A., Rieke, V., Santos, J., Swaminathan, A., Pauly, J., Pauly, K. B., & McConnell, M. (2010). Hybrid referenceless and multi-baseline subtraction thermometry for monitoring thermal therapies in the heart. Journal of Cardiovascular Magnetic Resonance, 12(1), 1-2.
10. Poorman, M. E., Braškutė, I., Bartels, L. W., & Grissom, W. A. (2019). Multi‐echo MR thermometry using iterative separation of baseline water and fat images. Magnetic resonance in medicine, 81(4), 2385-2398.
11. Steensma, B. R., Voogt, I. J., Leiner, T., Luijten, P. R., Habets, J., Klomp, D. W., ... & Raaijmakers, A. J. (2018). An 8-channel Tx/Rx dipole array combined with 16 Rx loops for high-resolution functional cardiac imaging at 7 T. Magnetic Resonance Materials in Physics, Biology and Medicine, 31(1), 7-18.
12. Steensma, B. R., van den Berg, C. A., and Raaijmakers, A. J., “Towards high precision thermal based RF safety assessment with cardiac triggered MR thermometry.”
13. Christ, A., Kainz, W., Hahn, E. G., Honegger, K., Zefferer, M., Neufeld, E., ... & Kuster, N. (2009). The Virtual Family—development of surface-based anatomical models of two adults and two children for dosimetric simulations. Physics in Medicine & Biology, 55(2), N23.
14. Simonis, F. F., Petersen, E. T., Bartels, L. W., Lagendijk, J. J., & van den Berg, C. A. (2015). Compensating for magnetic field inhomogeneity in multigradient‐echo‐based MR thermometry. Magnetic resonance in medicine, 73(3), 1184-1189.
Figures
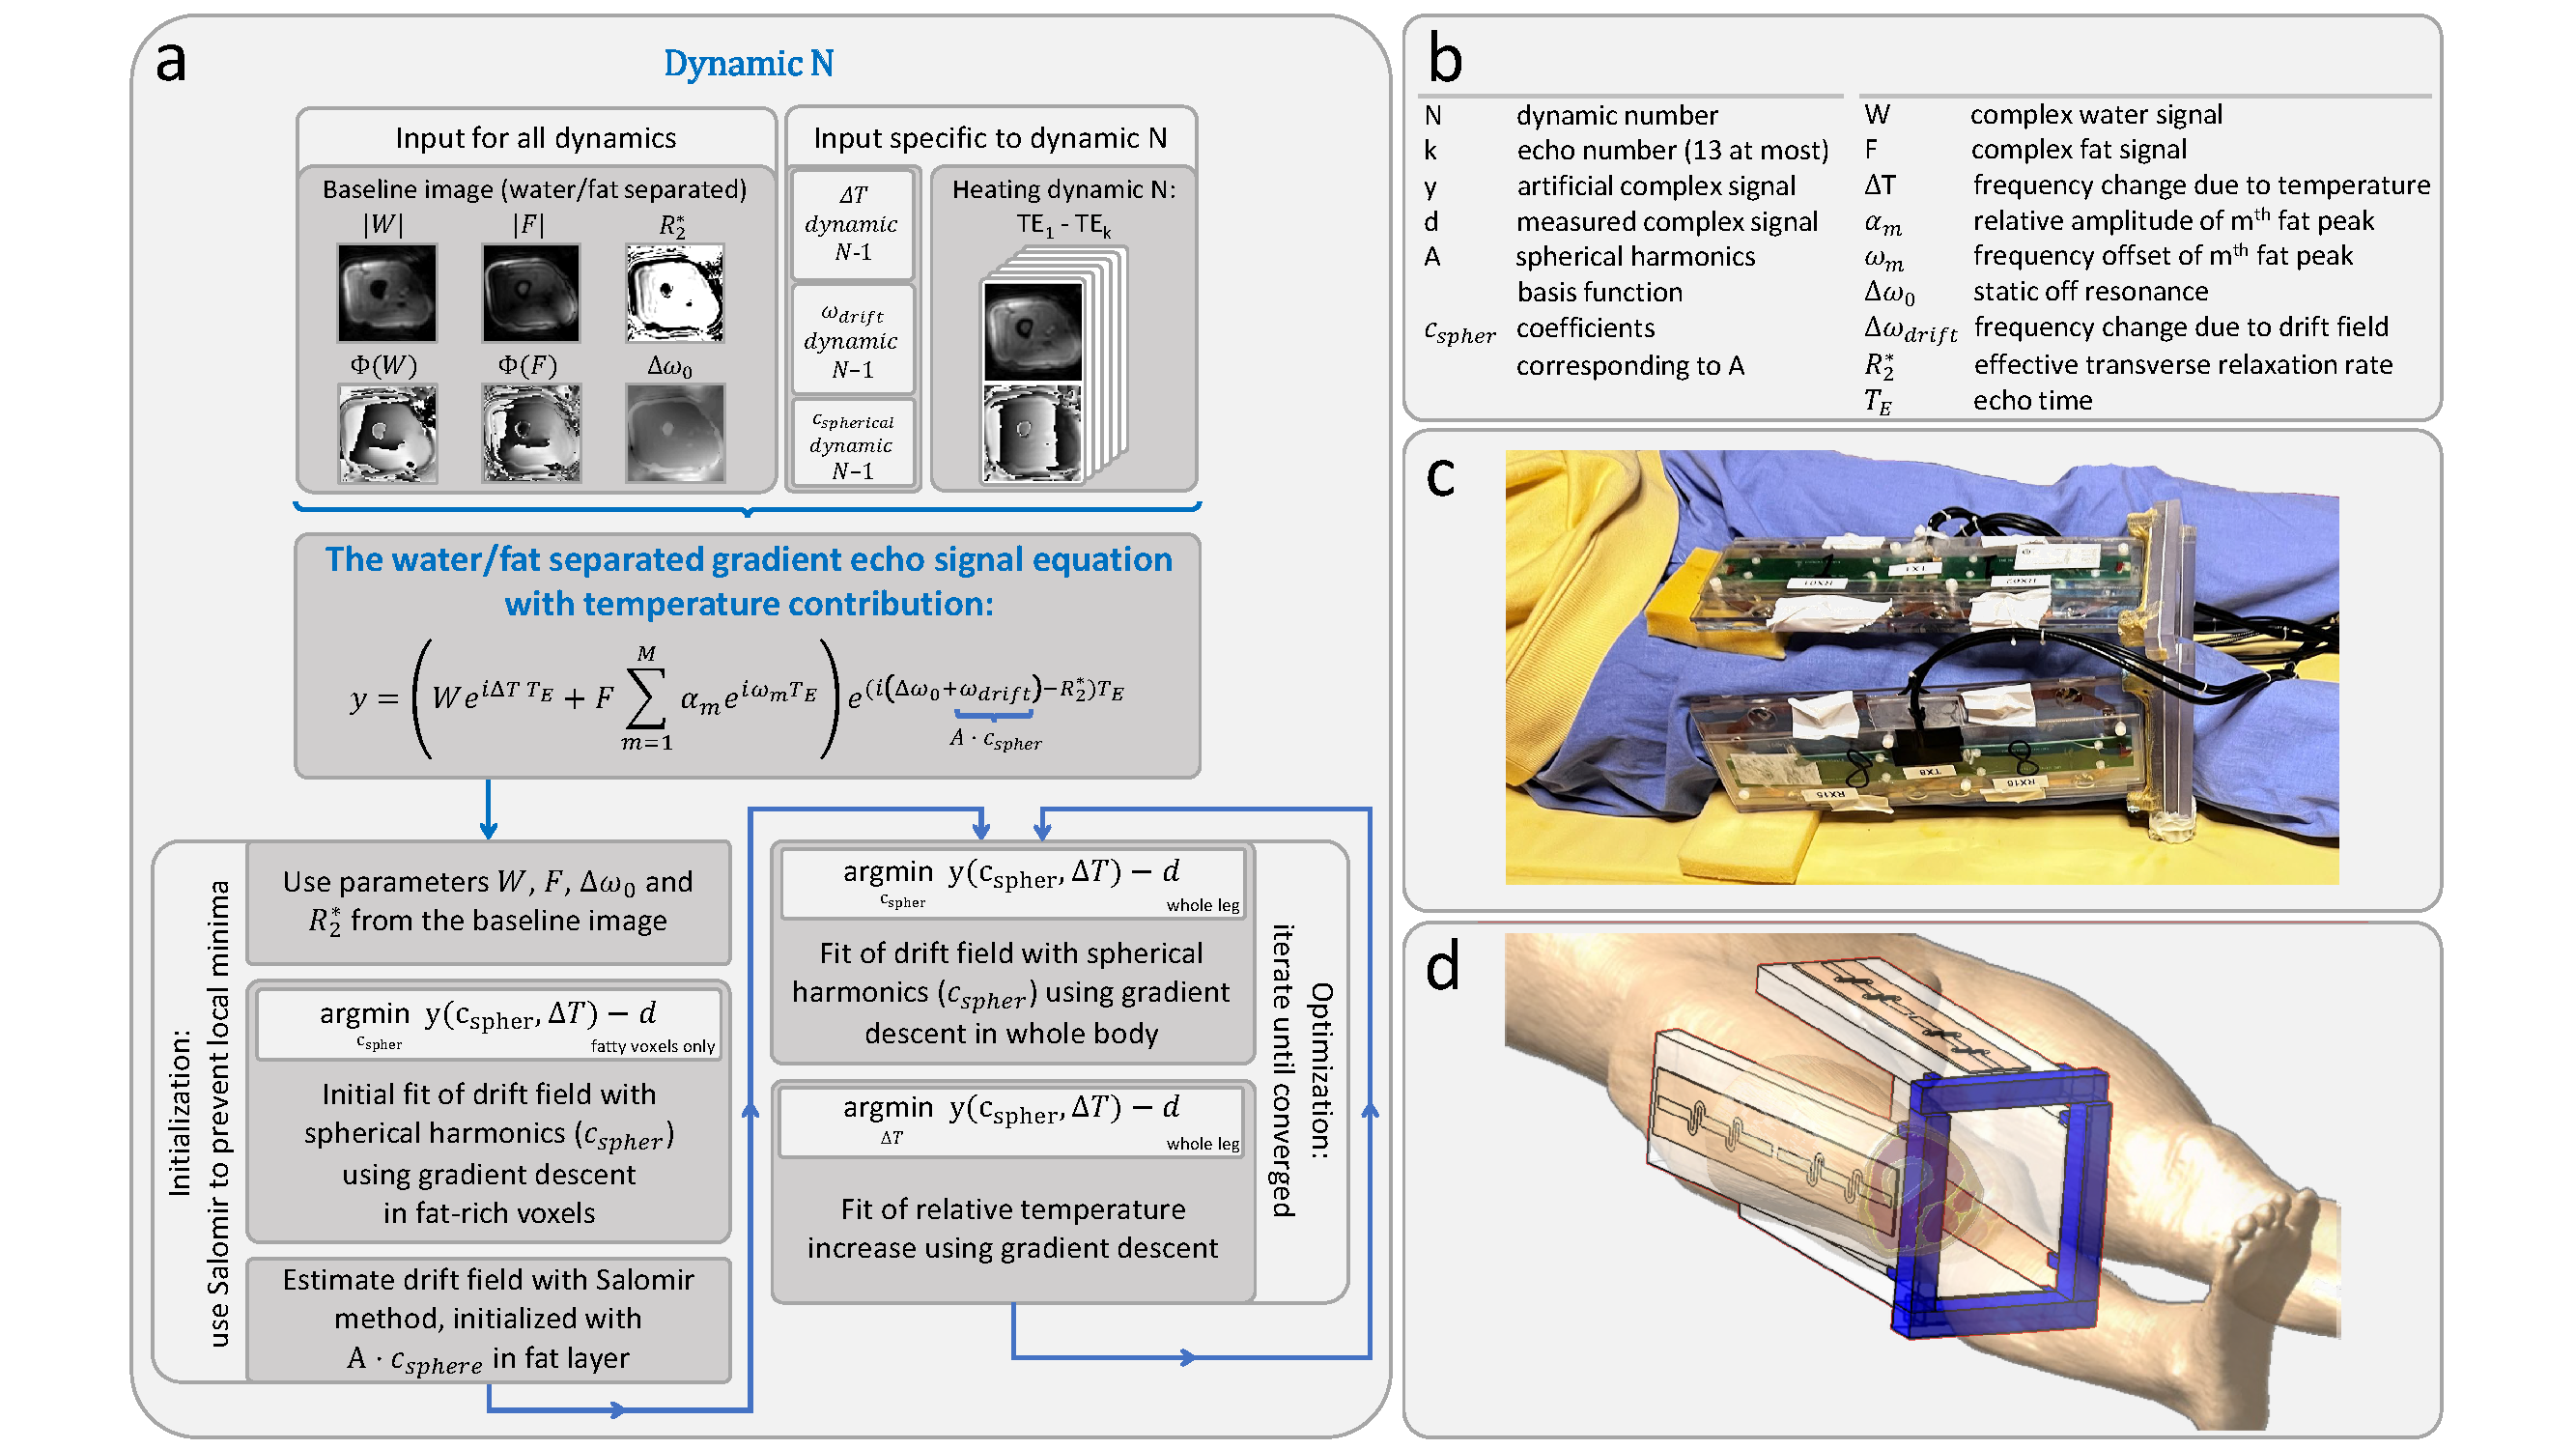
Figure 1: Schematic representation of the method to iteratively solve temperature and drift components from the gradient echo signal equation (a). Parameter definitions are provided in (b). Essential adaptation with respect to the original method10 is that Salomir’s algorithm8 is applied during initialization to prevent local minima caused by diffusive RF heating. Experimental imaging setup (c) where the antennas are placed in the plexiglass holder, and corresponding setup in the simulation environment (d) where the patient-specific model is merged with the Duke model.
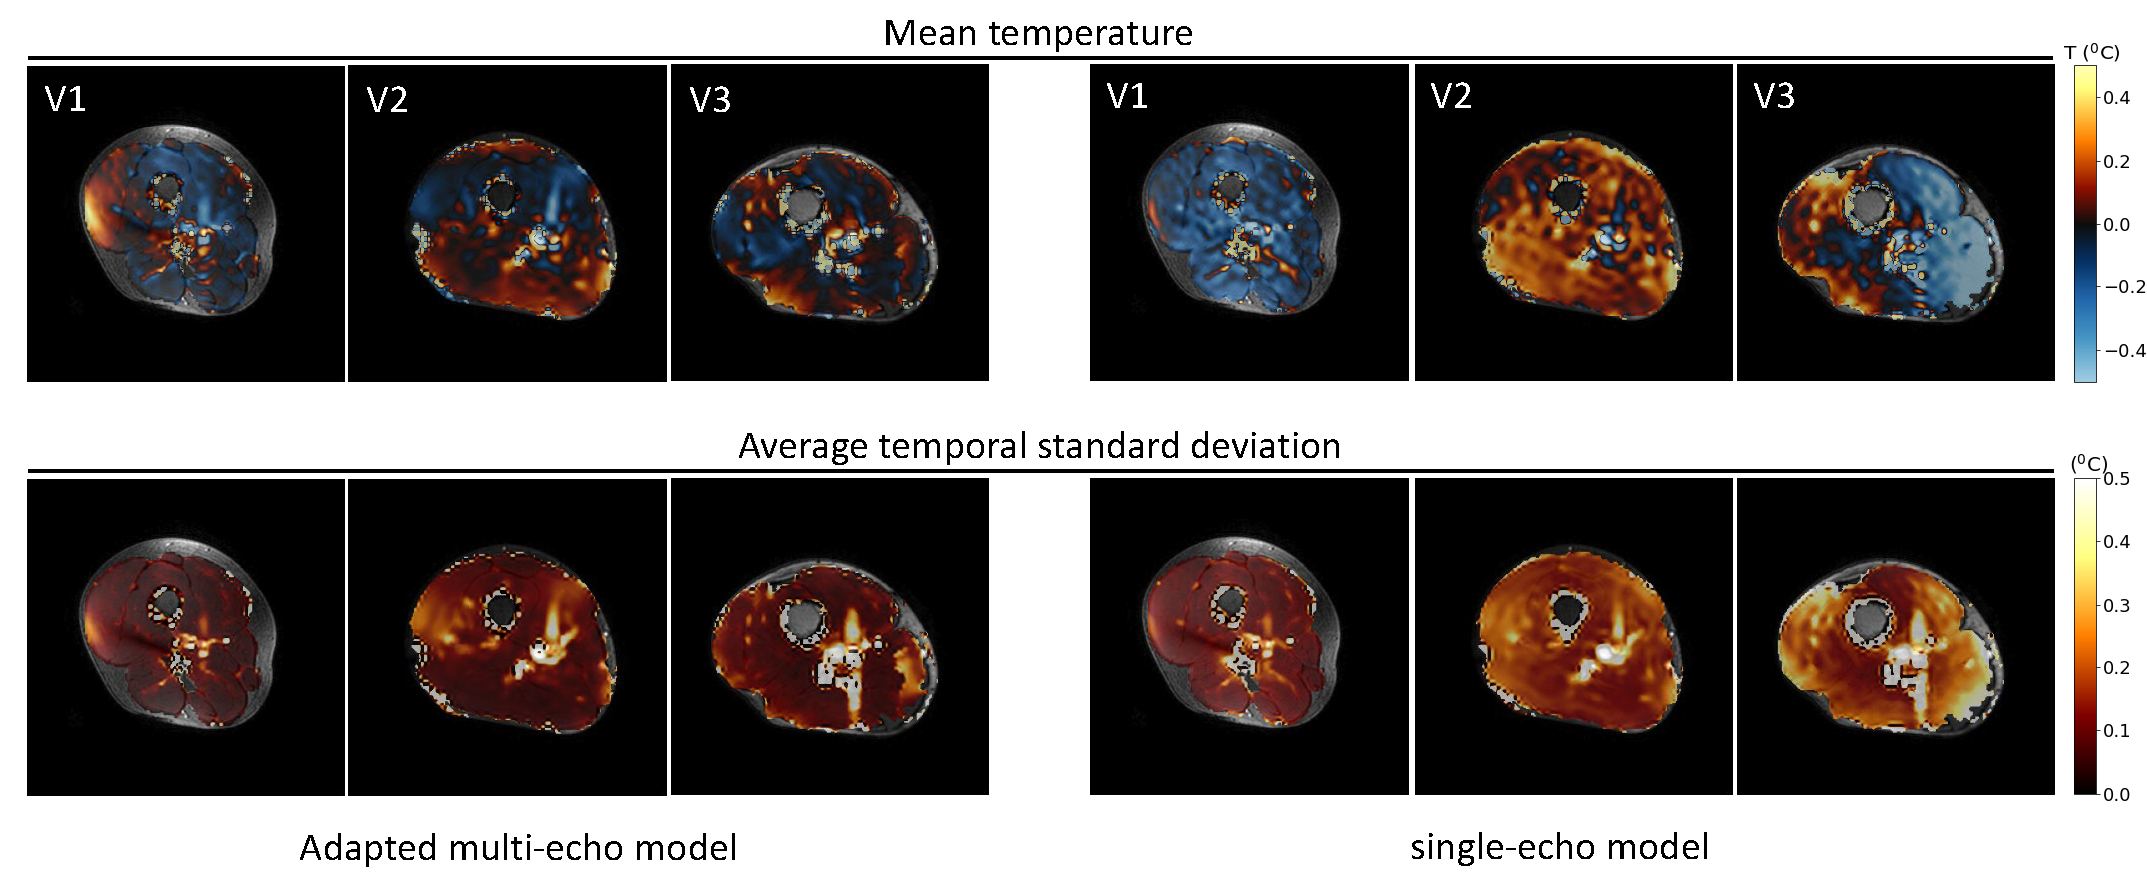
Figure 2: Spatial temperature maps without heating averaged over 300 dynamics in 3 volunteers (V1, V2 and V3) with various fat layer thicknesses; relative temperature maps were calculated both with the adapted multi-echo and the single-echo model. For each volunteer and model, a corresponding spatial map of temporal standard deviation is provided.
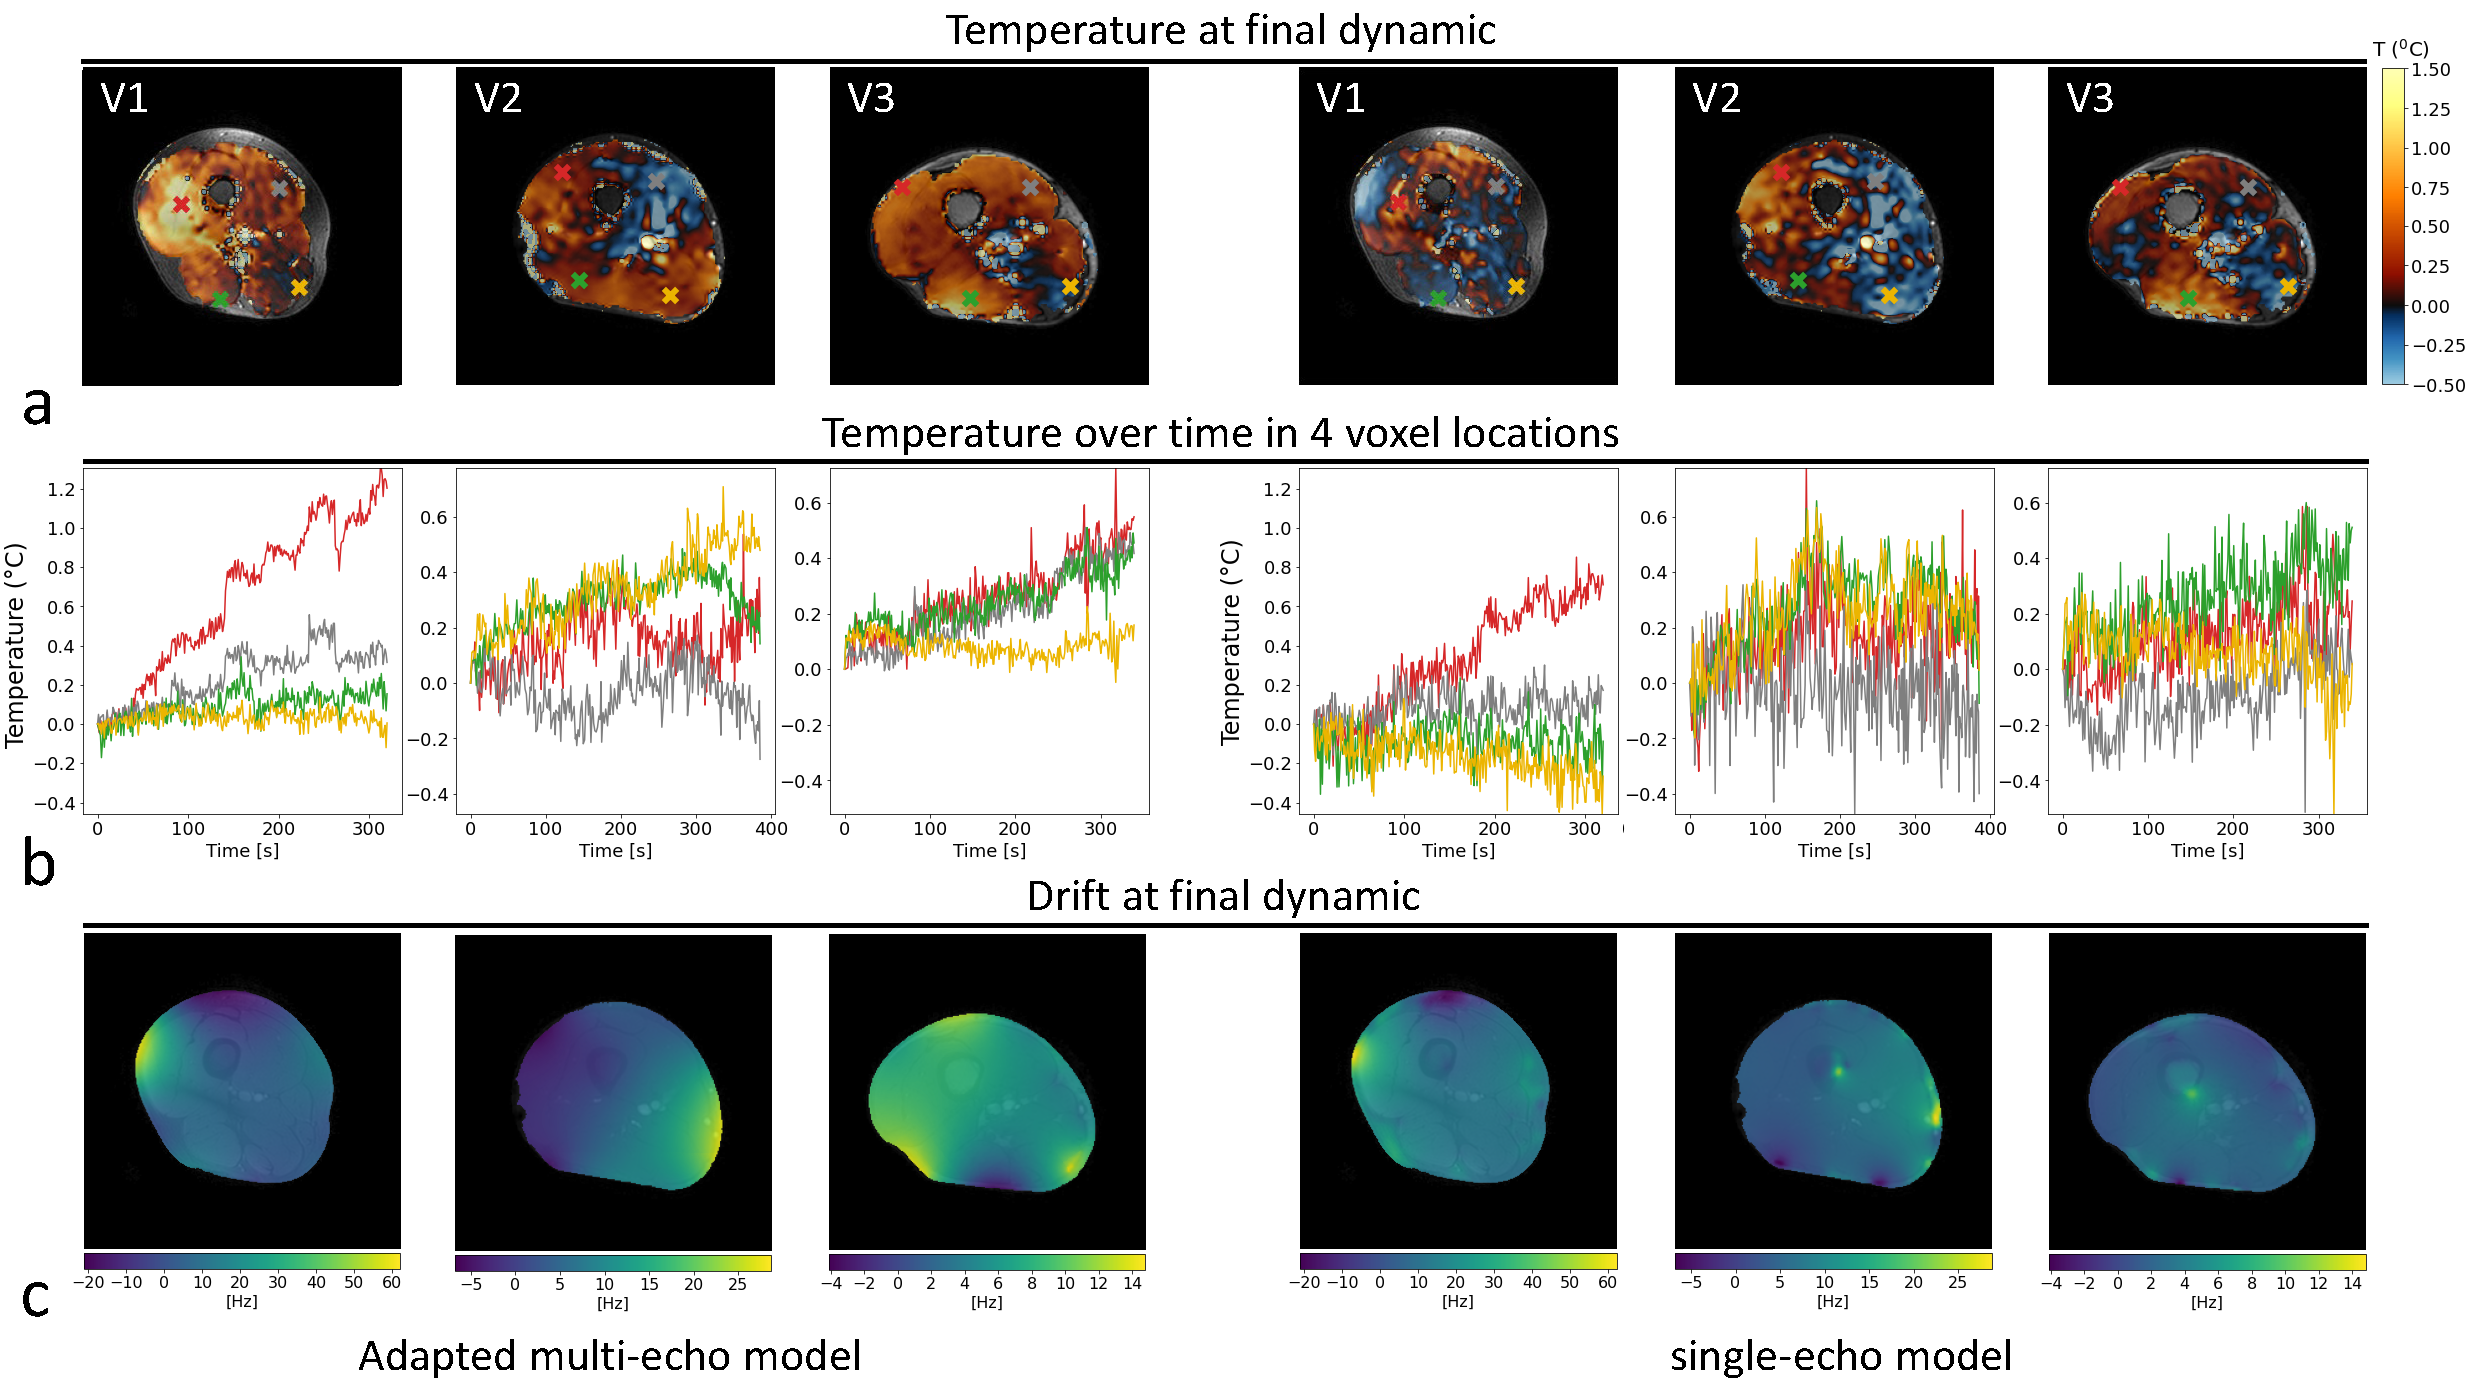
Figure 3: Spatial temperature maps after 319-385 seconds of heating with 5.3 W per channel in 3 volunteers (V1, V2 and V3) (a); relative heating maps were calculated both with the adapted multi-echo and single-echo model. A corresponding time series (b) is provided for the indicated voxel locations. The calculated drift field at the end of the series is indicated in (c).
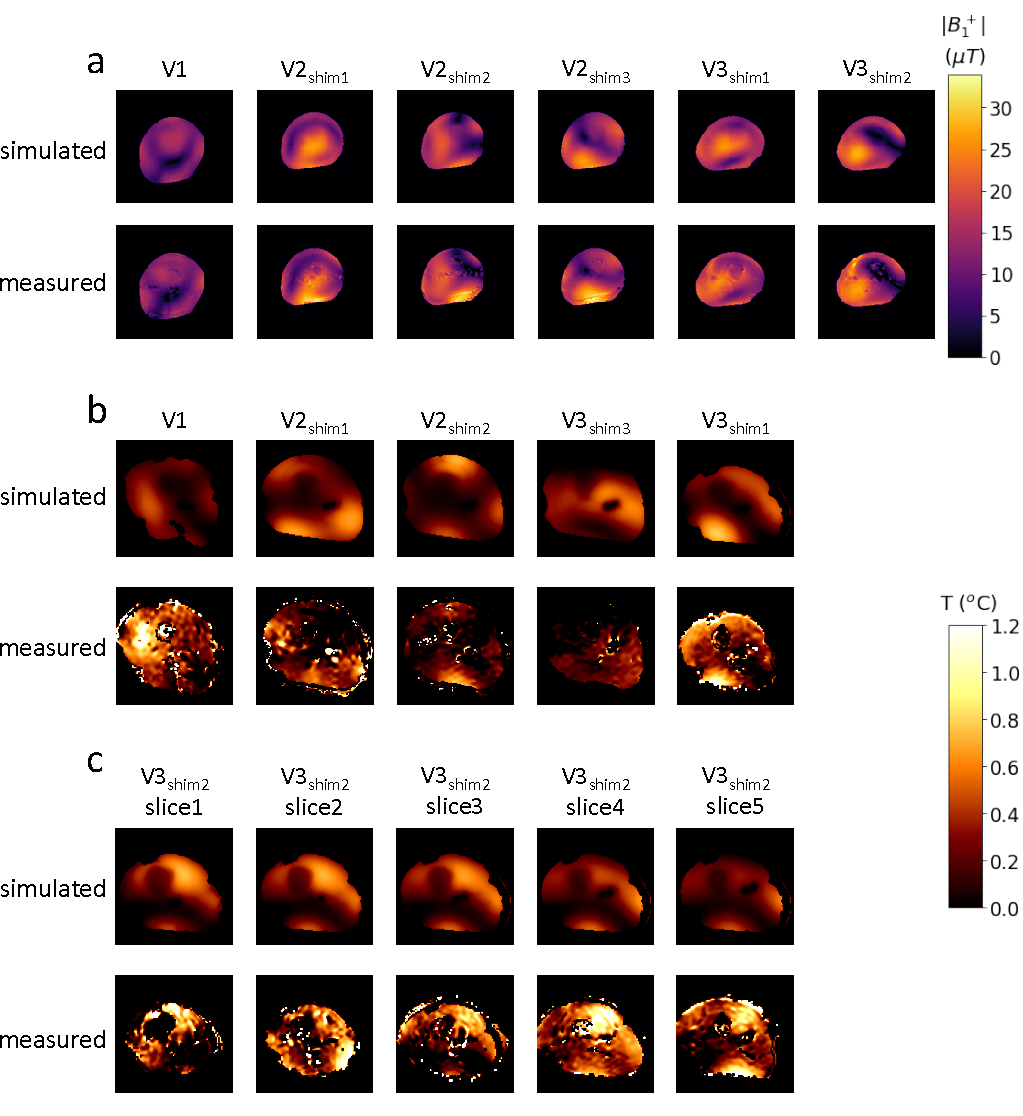
Figure 4: Measured |B1+| distributions and simulated counterparts in the central slice of 3 volunteers (a). Measured spatial heating distribution after 300 dynamics and their simulated counterparts in the central slice (b). Heating scan in volunteers 2 and 3 were performed with three and two different shim settings, respectively. For volunteer 3, the data of shim 2 was recorded with a multi-slice acquisition, for which simulated heating distributions are also provided in the corresponding slices (c).
Figure 5: Animated gif representing heating distributions over a time period of 340 seconds in five 8 mm slices (slice gap of 10 mm). Heating hotspots are clearly visible in the top right and bottom region of the leg. The central slice shows the most gradual temperature increase, which is where the algorithm is most confident.