0700
Measuring RF field-induced temperature variations in brain MRI exams with motion compensated MRT and field monitoring.
Caroline Le Ster1, Franck Mauconduit1, Christian Mirkes2, Alexandre Vignaud1, and Nicoal Boulant1
1Université Paris-Saclay, CNRS, BAOBAB, Neurospin, CEA, Gif-sur-Yvette, France, 2Skope MRT, Zurich, Switzerland
1Université Paris-Saclay, CNRS, BAOBAB, Neurospin, CEA, Gif-sur-Yvette, France, 2Skope MRT, Zurich, Switzerland
Synopsis
Sub-degree brain temperature rise occurring through RF power deposition during the MR exam was measured with MR thermometry at 7T using a multi-slice EPI sequence and concurrent field monitoring. This sequence was first tested in vitro with field perturbations, an optical probe being used for ground truth measurements, and the accuracy of the method reached 0.02°C. In vivo, this methodology was complemented by a motion compensation step and precision reached 0.05°C. After 20-min of scanning at maximal SAR, temperature rise induced by RF power deposition throughout the inner brain reached 0-0.2°C, well below the values predicted by thermal models.
Introduction
Thermal models predict a peak temperature rise of ~0.5 °C for head volume coils in the brain when exposed at maximal SAR (1,2). The aim of the current study was to dynamically measure temperature changes in the human brain exposed to RF power deposition during an MR exam at 7T with MR Thermometry (MRT). To reach the necessary sub-degree precision with a good spatiotemporal resolution, temperature rise was measured using the PRFS method (3) with retrospective field sensor correction (4), along with a motion compensation step (5).Methods
MRT experiments were performed on a Magnetom 7T scanner (Siemens Healthineers, Erlangen, Germany) equipped with the Nova 1Tx-32Rx head coil (Nova Medical, Wilmington, MA, USA) and a field sensors setup (clip-on camera, Skope MRT, Zurich, Switzerland) consisting in 16 19F NMR field probes. Experiments were first tested in vitro (agar-gel phantom) with deliberate field disturbances to mimic the effect of breathing or limb motion, an optical probe being used for ground truth measurements, and then in vivo on n=8 volunteers (27±7 years, 3 females/5 males).An MPRAGE scan, used for registration, as well as a 2D-GRE scan (20 interleaved sagittal slices of 5 mm thickness, 3x3 mm² in plane resolution, FOV 192 mm, volume TR 1200 ms, TE1/TE2/TE3/TE4 2.67/3.41/4.15/4.89 ms, flip angle 4°, bandwidth 2000Hz/px), used for B0 mapping and sensitivity profile estimation, were first acquired.
The MRT sequence was a multi-slice EPI (same resolution, bandwidth and volume TR as the 2D-GRE scan, TE 20 ms, flip angle 30°). A rectangular heating pulse of 3.6 ms with 100 kHz offset was added in this sequence (6) to reach the maximal SAR allowed by IEC in the normal mode of operation (7). This pulse could be disabled to run the sequence in a low SAR regime (<10% of the maximal SAR). In vitro, this sequence was run continuously during 25 minutes, with 5 minutes played at low SAR followed by 20 minutes at maximal SAR. In vivo, four MRT scans were acquired: a dictionary pre-scan used for motion compensation (5 min at low SAR during which the volunteers were instructed to move their heads), a stability scan (5 min at low SAR) and two heating scans (21-min with low SAR during the first minute and maximal SAR afterwards) separated by 10 minutes to allow brain cooling.
Complex combined images were reconstructed using the skope-i software with a correction to the second order of the spherical harmonics decomposition. Magnitude images were then registered with 6 motion regressors (8). Images of the dictionary were used to estimate the influence of motion on the phase: during this scan, phase changes were assumed to originate solely from motion, so that a linear regression allowed estimating the influence of each motion regressor on the phase. The resulting coefficients were then used to regress the effect of motion of the phase images in the stability and heating scans. A correction for background gradients was also performed on these scans (9). Temperature rise was finally computed with ΔT=Δφ/(2πανTE), where Δφ is the phase difference, α the PRFS coefficient and γ the Larmor frequency.
Results
In vitro (Figure 1), the field sensor correction allowed retrieving ΔT as measured by the optical probe despite the high sensitivity of the EPI sequence to off-resonance effects, even in the presence of field disturbances (RMSE = 0.02 °C). In the SAR hotspot, located in the rear of the coil, maximal ΔT reached ~0.8°C. In vivo, the dictionary-based motion compensation scheme allowed reducing the temporal standard deviation in a large portion of the brain (Figure 2). The low SAR scan (Figure 3a) returned a precision in temperature change measurement of 0.05 °C and, as expected, no temperature rise was observed over the brain during this scan. Due to the long acquisition times of the maximal SAR scans (Figure 3b), only voxels for which the time-course signals after motion compensation were not correlated to the scan motion regressors (R<0.5) were kept in the analysis. After 20 minutes of RF exposure at maximal SAR, the median ΔT averaged over the brain reached 0.1°C, while it reached ~0.2°C in the inner brain where the SAR hotspot was expected. Statistically, ΔT resulting from the 20-min exposure at maximal SAR was higher than ΔT reached after 5-min scanning at low SAR in the voxel indicated by a cross in Figure 3 (two-sided paired t-test, p=0.04). Brain periphery remained too sensitive with respect to motion to lead to equally conclusive results.Conclusion
The results obtained on the phantom showed the robustness of this methodology to accurately measure small temperature changes with field sensor correction. In vivo, the motion compensation scheme was found mandatory to retrieve the temperature rise induced by RF power deposition. With this approach, sub-degree temperature rise in the inner human brain was characterized experimentally throughout RF exposure and the temperature rise measured after 20-min scanning at maximal SAR led to a lower increase than expected from thermal models. These results would thus suggest more heat dissipation in awake humans than anticipated.Acknowledgements
This work received financial support from Leducq Foundation (large equipment Equipement de Recherche et Plateformes Technologiques program, NEUROVASC7T project), and from the European Union Horizon 2020 Research and Innovation program under grant agreements no. 736937 (M-Cube) and 885876 (AROMA).References
1. Collins CM, Liu W, Wang J, et al. Temperature and SAR calculations for a human head within volume and surface coils at 64 and 300 MHz. Journal of Magnetic Resonance Imaging 2004;19:650–656 doi: 10.1002/jmri.20041.2. Wang Z, Lin JC, Mao W, Liu W, Smith MB, Collins CM. SAR and temperature: Simulations and comparison to regulatory limits for MRI. Journal of Magnetic Resonance Imaging 2007;26:437–441 doi: https://doi.org/10.1002/jmri.20977.
3. Hindman JC. Proton Resonance Shift of Water in the Gas and Liquid States. The Journal of Chemical Physics 1966;44:4582–4592 doi: 10.1063/1.1726676.
4. Barmet C, Zanche ND, Pruessmann KP. Spatiotemporal magnetic field monitoring for MR. Magnetic Resonance in Medicine 2008;60:187–197 doi: 10.1002/mrm.21603.
5. Le Ster C, Mauconduit F, Mirkes C, et al. RF heating measurement using MR thermometry and field monitoring: Methodological considerations and first in vivo results. Magnetic Resonance in Medicine 2021;85:1282–1293 doi: https://doi.org/10.1002/mrm.28501.
6. Ehses P, Fidler F, Nordbeck P, et al. MRI thermometry: Fast mapping of RF-induced heating along conductive wires. Magnetic Resonance in Medicine 2008;60:457–461 doi: 10.1002/mrm.21417.
7. IEC. Medical electrical equipment-Part 2-33: Particular requirements for the basic safety and essential performance of magnetic resonance equipment for medical diagnosis. 2015;Edition 3.2.
8. Jenkinson M, Bannister P, Brady M, Smith S. Improved Optimization for the Robust and Accurate Linear Registration and Motion Correction of Brain Images. NeuroImage 2002;17:825–841 doi: 10.1006/nimg.2002.1132.
9. Simonis FFJ, Petersen ET, Bartels LW, Lagendijk JJW, Berg CAT van den. Compensating for magnetic field inhomogeneity in multigradient-echo-based MR thermometry. Magnetic Resonance in Medicine 2015;73:1184–1189 doi: https://doi.org/10.1002/mrm.25207.
Figures
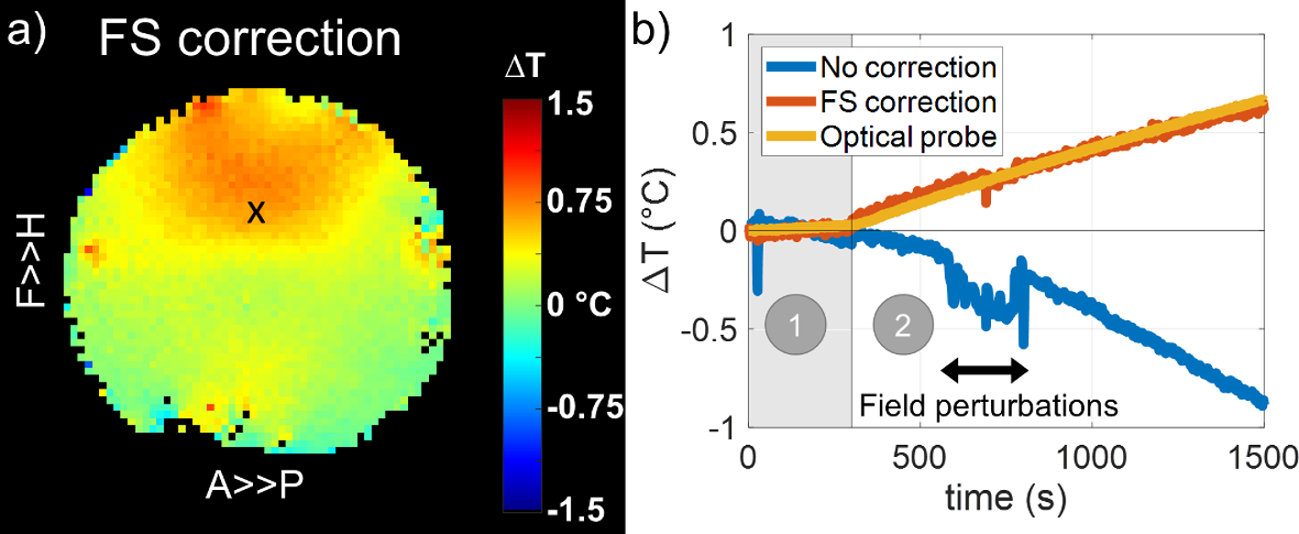
Figure 1: In vitro results for a 25-min MRT scan with a pre-heating period of 5 minutes played at low SAR (Figure 1b, zone 1) and followed by a heating period of 20 minutes played at maximal SAR (Figure 1b, zone 2). The field was deliberately disturbed between minutes 10 and 15 of the scan. a) Sagittal map of the temperature rise (ΔT) measured after 20 min of scanning at maximal SAR. b) ΔT time course measured at probe location (black cross in Figure 1a) without and with field sensors correction.
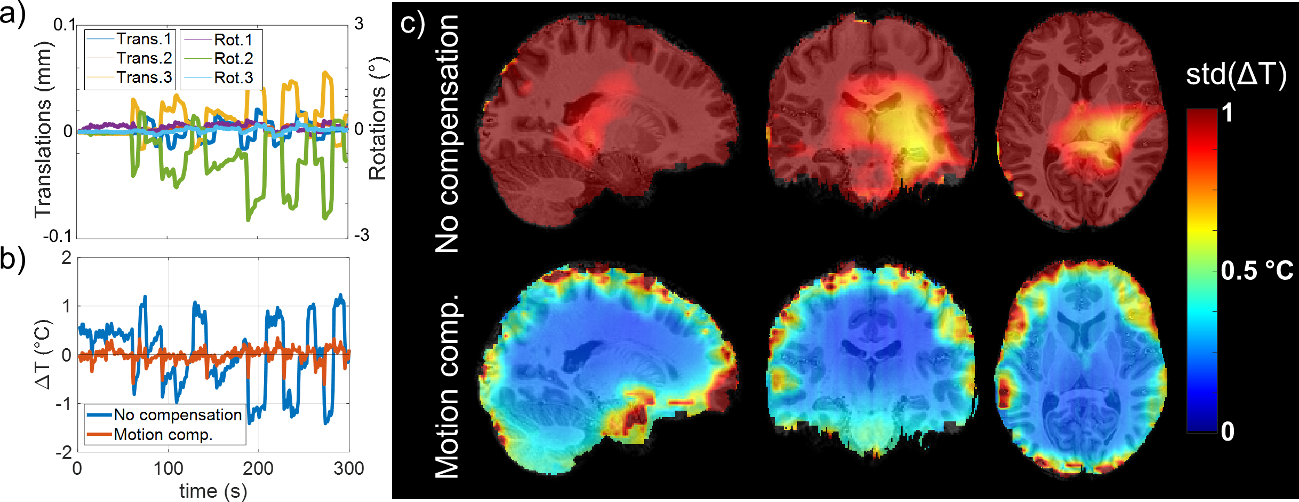
Figure 2: Results of the dictionary pre-scan. a) Example of motion regressors (3 translations and 3 rotations) measured in one subject. b) Corresponding ΔT time course computed in a voxel in the same subject without and with motion compensation. c) Sagittal, coronal and axial maps of the temporal standard deviation measured on every subject without (top row) and with (bottom row) motion compensation and averaged over the population after smoothing and normalisation to the MNI.
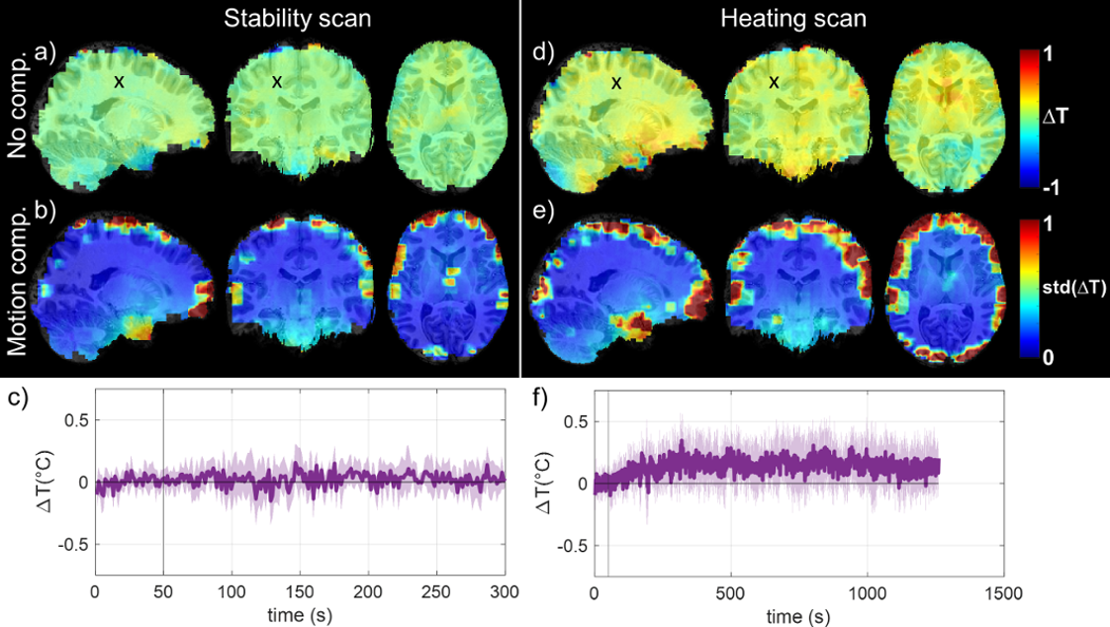
Figure 3: In vivo results over the population for the stability scan (a to c) and the heating scans (d to f) that were normalised to the MNI 3 mm brain template. a) and d) Median ΔT measured over the population for the last 4 minutes of the scans. b) and e) Temporal standard deviation averaged over the subjects for the same period. c) and f) ΔT time course measured over the population (median value) in the voxel represented by a black cross (standard deviation represented in light colour).
DOI: https://doi.org/10.58530/2022/0700