0698
Sensitivity of dMRI with TBSS analysis to WM pathology in SLE: influence of field strength, acquisition approach and post-processing strategy1Diagnostic Radiology, Lund University, Lund, Sweden, 2Division of Anaesthesia, University of Cambridge, Cambridge, United Kingdom, 3Computing, Imperial College London, London, United Kingdom, 4Lund University, Lund, Sweden, 5Johns Hopkins University, Baltimore, MD, United States, 6Kennedy Krieger Institute, Baltimore, MD, United States, 7MRC Cognition and Brain Sciences Unit, University of Cambridge, Cambridge, United Kingdom, 8Skane University Hospital, Lund, Sweden, 9BioImaging Center, Lund University, Lund, Sweden
Synopsis
We examined whether more advanced dMRI increase the sensitivity to white matter pathology in systemic lupus erythematosus. Specifically, we examined whether more advanced acquisitions (DKI versus DTI, 7T versus 3T) and more complex processing (e.g. denoising, Gibbs-ringing removal) provide increased sensitivity. Tract-based spatial statistical analysis was applied, and the fraction of significant voxels in the white matter skeleton was used as the sensitivity metric. Results showed that the choice of the acquisition protocol had a greater impact on sensitivity than the choice of the post-processing strategy. 3T-DTI was more sensitive than 3T-DKI and 7T-DTI, regardless of the applied post-processing pipeline.
Introduction
Scientists designing diffusion MRI protocols and pipelines face a plethora of choices such as whether to use diffusion tensor imaging (DTI) or diffusion kurtosis imaging (DKI), what field strength to scan at, and which post-processing to include. The choice should be informed by how these factors influence the sensitivity to pathology. In this study, we evaluated two dMRI protocols (DTI versus DKI) and two field strengths (3T versus 7T), along with various combinations of state-of-the-art post-processing steps. The goal was to assess whether the more resource-intensive approaches such as DKI, 7T, or computationally expensive processing increase sensitivity to white matter (WM) pathology patients with systemic lupus erytheumatosus (SLE) and human controls (HC). Tract-based spatial statistical (TBSS) analysis [1] was used to test for group differences, and the fraction of significant voxels in WM skeleton was used as the sensitivity metric.Methods
64 SLE patients and 20 healthy controls were scanned on a 3T Siemens Skyra, while 54 SLE patients and 21 HC were scanned at a 7T Philips Achieva system. The 3T data were acquired with two protocols (3T-DTI and 3T-DKI) while the 7T data were acquired with one protocol (7T-DTI). The 3T-DTI acquisition was performed with TR/TE=7300/73 ms/ms, a resolution of 2x2x2 mm3 and diffusion encoding with a b-value of 0 and 1000 in eight and 64 directions, respectively. The 3T-DKI acquisition was performed with TR/TE=7500/103 ms/ms, a resolution of 2.3x2.3x2.3 mm3, and diffusion encoding with b-values of 0, 250, 500, 1000, and 2750 s/mm2 applied in 3, 6, 6, 20, and 30 directions, respectively. The 7T-DTI acquisition was performed with TR/TE=8816/62 ms/ms, a resolution of 2x2x2 mm3, and diffusion encoding with a b-value of 0 and 1000 in three and 30 directions, respectively.$$$$$$
To test the impact of post-processing choices, three different modules (MPPCA for the denoising method in [2], Gibbs for Gibbs-ringing removal method in [3] and Eddy for the eddy-current and motion correction in [4]) were applied in seven different combinations. An overview of the workflow is shown in Figure 1. TBSS analysis was performed using FSL [1] on the fractional anisotropy (FA) as well as on the mean, axial and radial diffusivity (MD, AD and RD respectively) and for 3T-DKI only also on the mean, axial and radial kurtosis (MK, AK and RK respectively). Statistical analysis was carried out by performing permutation tests (5000 times) [5]. Multiple comparison correction was done using threshold-free cluster enhancement (TFCE) [6]. A family-wise error corrected P value was ascribed to each cluster of voxels comprising the WM skeleton. The significance threshold was set to P < 0.05.
Results
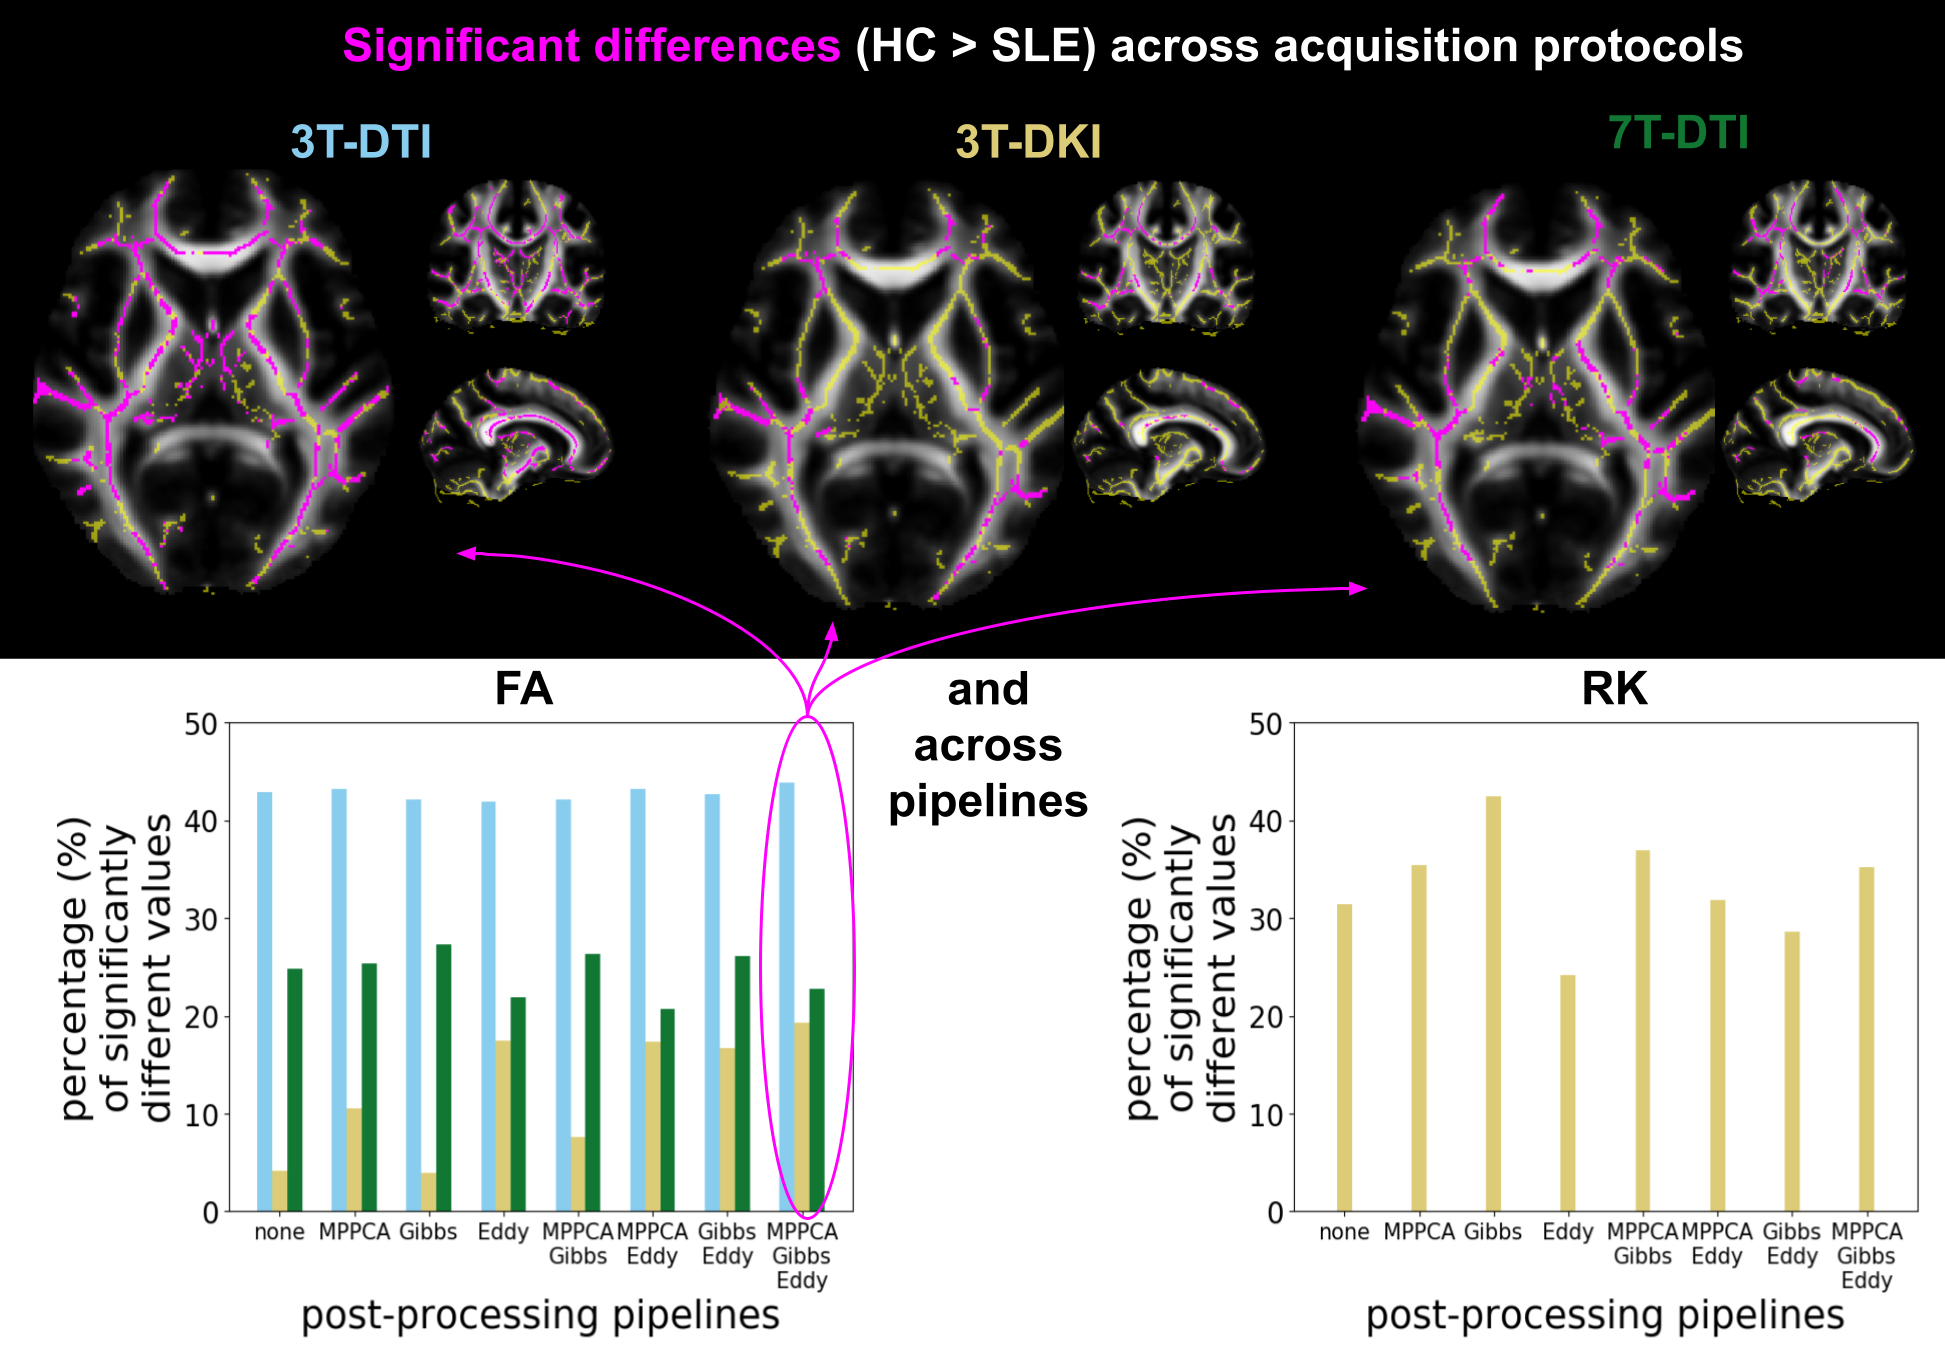
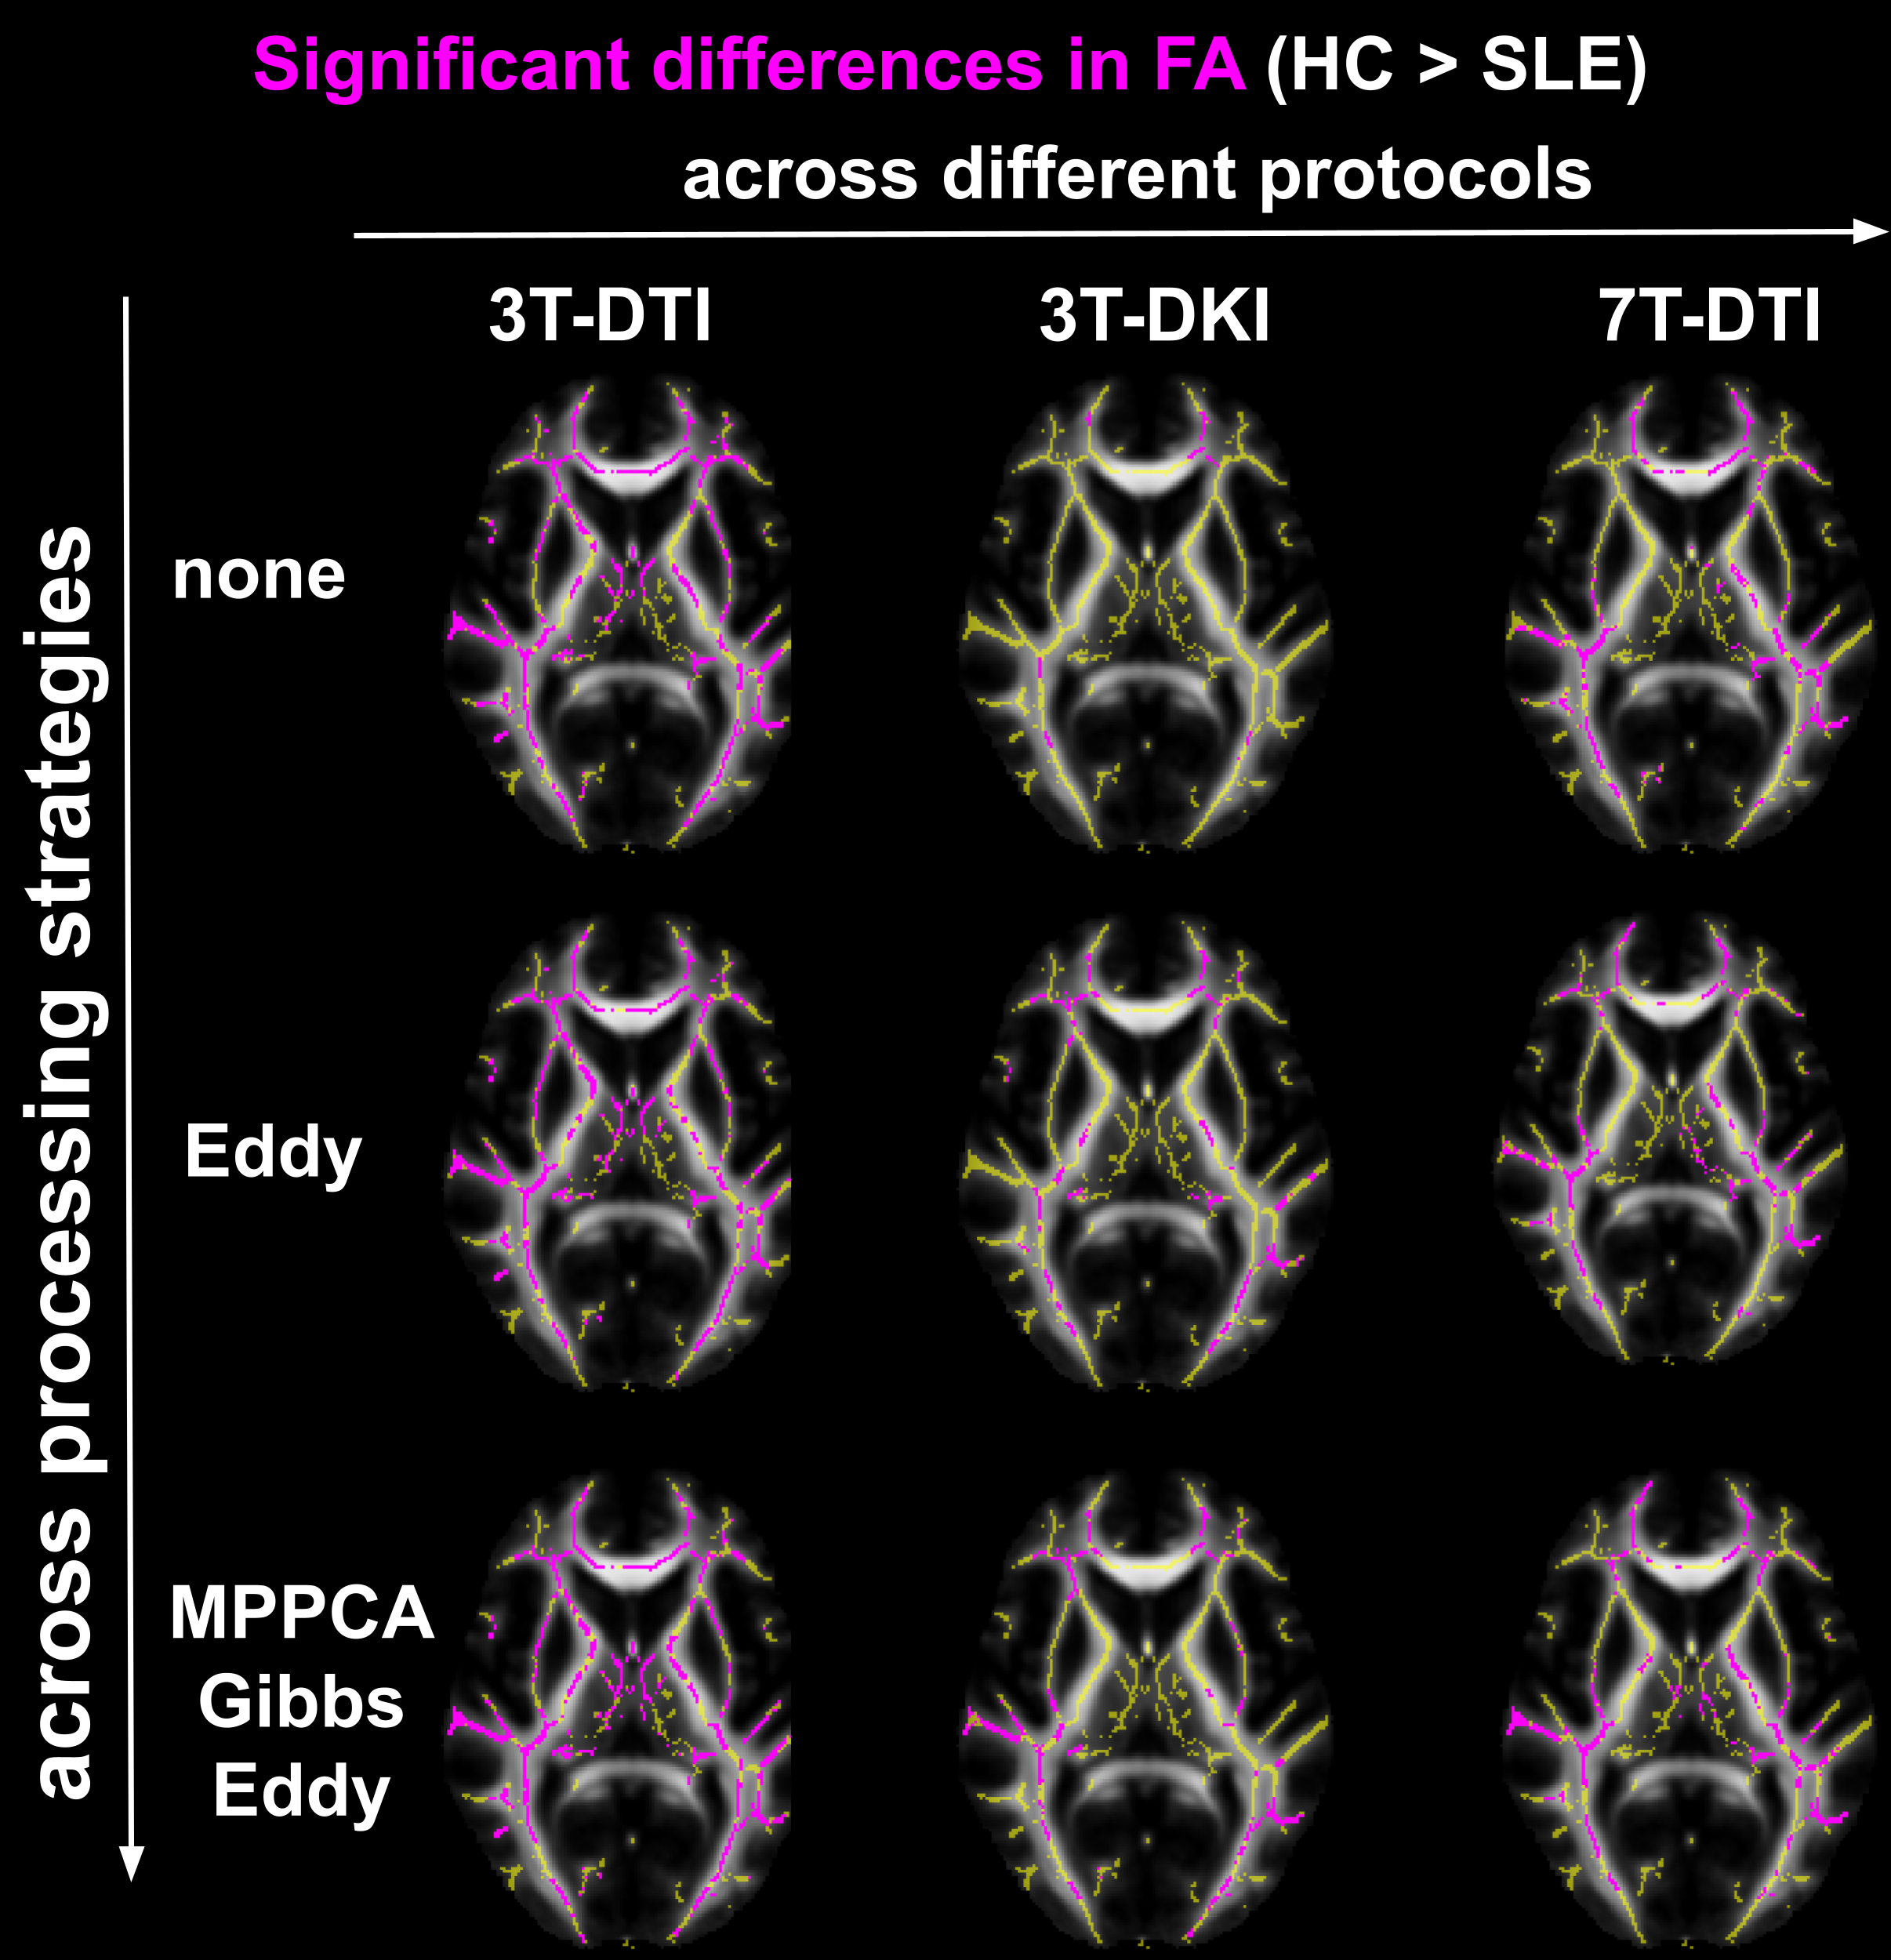
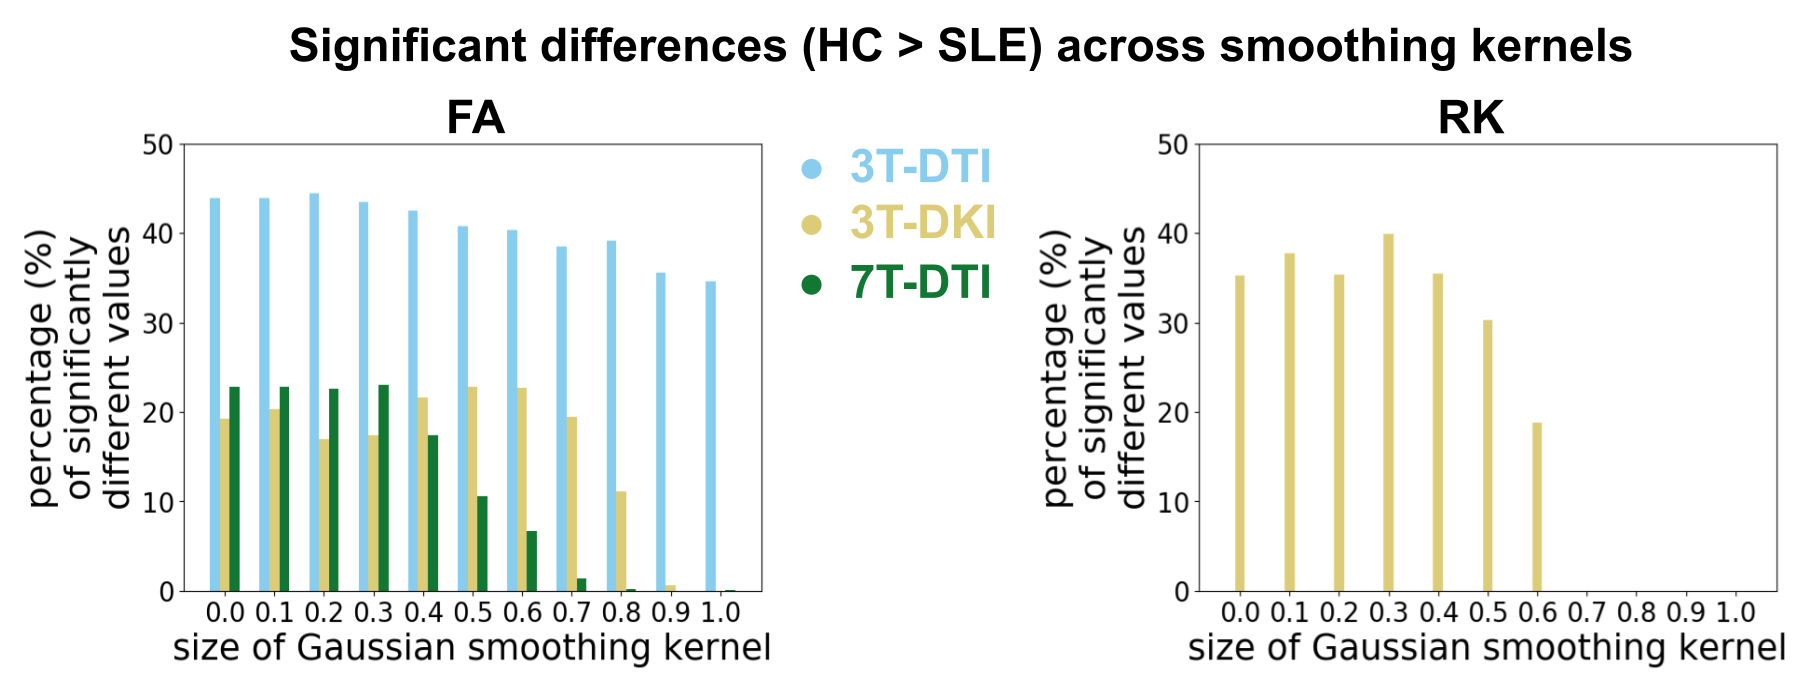
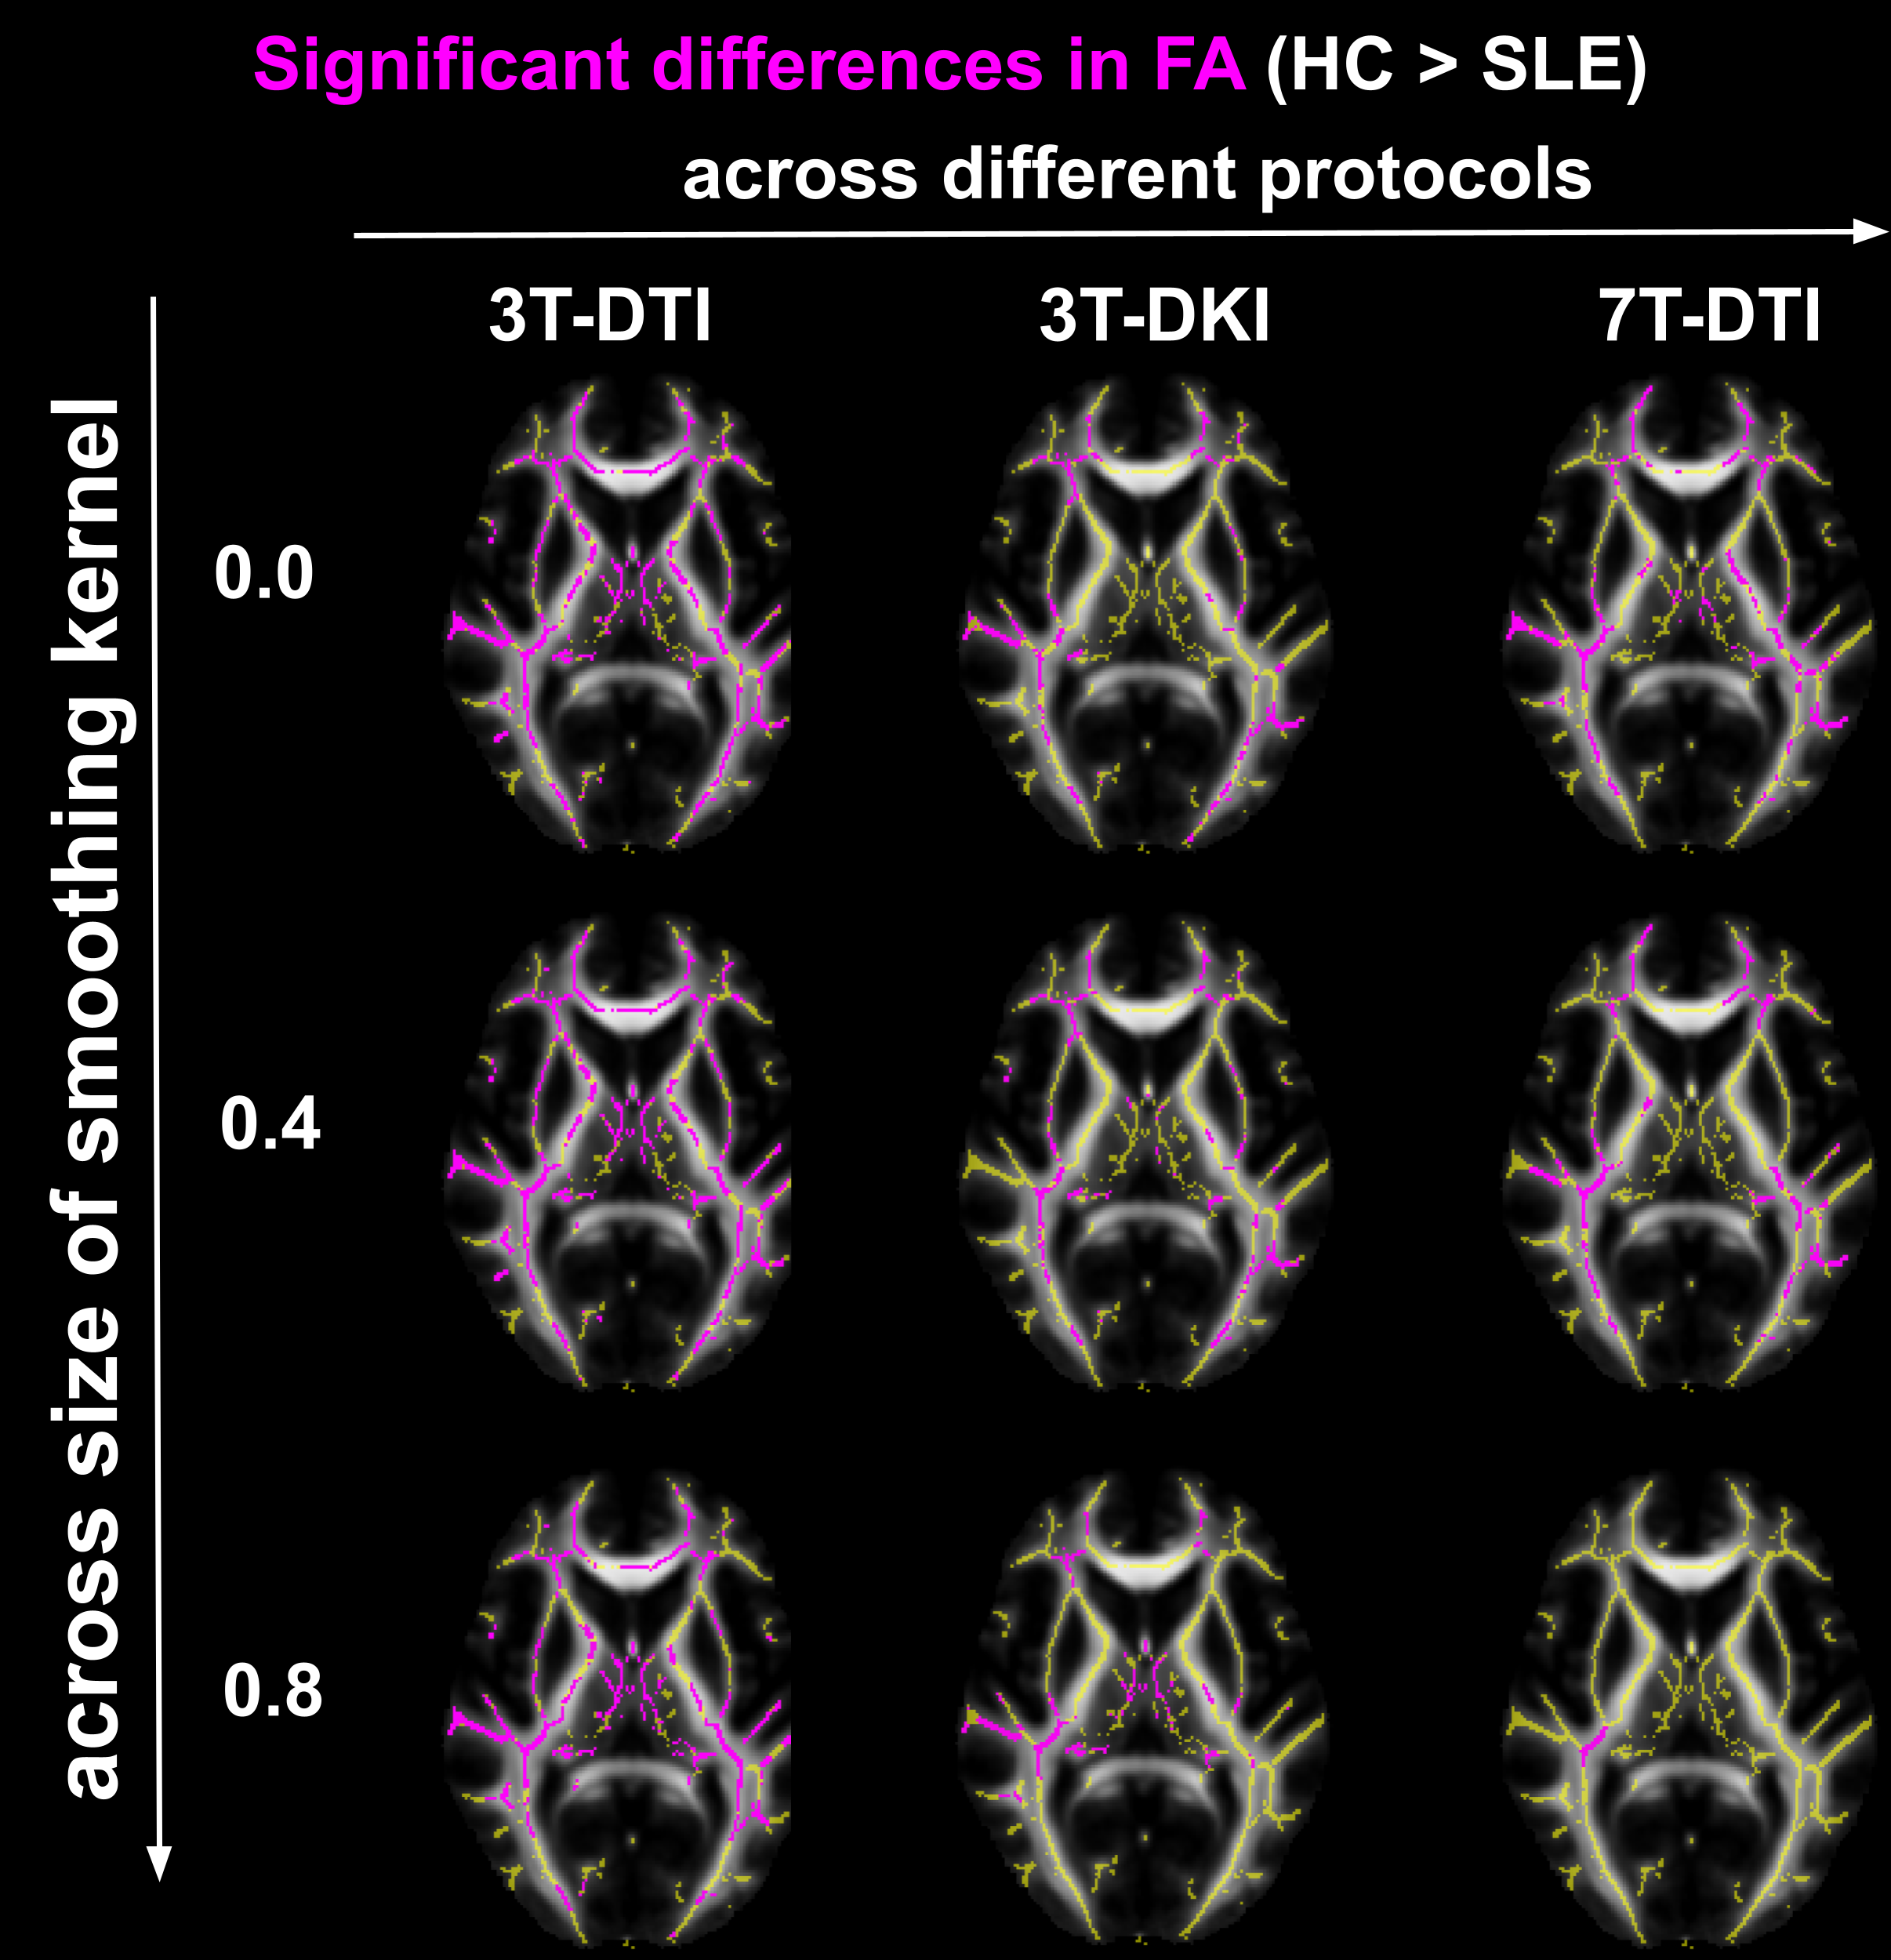
FA, RD and RK were the only parameters that demonstrated significant differences between healthy controls and SLE patients. Controls had consistently higher values of FA and RK compared to SLE patients, while the opposite was observed for RD. Different acquisition protocols yielded different maps of significant difference between the two groups (Fig 2). For 3T-DKI we found that Eddy substantially increased the sensitivity to SLE WM pathology respectively (i.e. fraction of significant voxels in WM skeleton, see bottom plots of Figure 2 and Figure 3). This was also observed for RD, while Gibbs positively impacted RK and the FA derived by 7T-DTI too. On the other hand, the impact of the post-processing pipeline on TBSS results was minimal for either FA or RD derived by 3T-DTI (see Figure 2 and 3). Figures 4 and 5 show the effect of smoothing data prior to TBSS analysis. Smoothing reduced the sensitivity for all diffusion parameters. Overall, FA derived by 3T-DTI was the parameter with the highest sensitivity, regardless of the post-processing strategy followed.Discussion
3T-DTI yielded higher sensitivity WM pathology in SLE than both 7T-DTI and 3T-DKI. FA derived by 3T-DTI was the most sensitive parameter. Future experiments will investigate whether our observation also holds true for other pathologies. A different observation when comparing DTI with DKI was reported in TBSS analysis comparing HC with patients with Alzheimer's disease [7] and bipolar patients [8]. In both those studies FA values estimated by 3T-DKI revealed more regions of the between-group differences than 3T-DTI did. The lower resolution by which 3T-DKI was acquired may explain why it was less sensitive to SLE than 3T-DTI. Artificially reducing the resolution by smoothing led to reduced sensitivity, which underlines this argument.Conclusion
The choice of the diffusion protocol had a greater impact on sensitivity to SLE WM pathology than that of the magnetic field strength or the post-processing strategy. The use of more demanding acquisitions (DKI, 7T) did not yield any substantial increase in sensitivity. Except for Eddy applied in DKI, none of the other processing modules provided any substantial improvement on the sensitivity, which may be a consequence of inherent smoothing of the signal (e.g. denoising lowers variance in general).Acknowledgements
The study was supported by funding by Regional Research Funds (RegSkane-824651) (PSCS), SUS Foundation and Donations funds (PSCS), Alfred \"{O}sterlund Foundation (PCS), Swedish Rheumatism Association R-568371 (PCS), King Gustaf V's 80-year Foundation (FAI-2019-0559) (PCS).References
[1] S. M. Smith, M. Jenkinson, H. Johansen-Berg, D. Rueckert, T. E. Nichols,C. E. Mackay, K. E. Watkins, O. Ciccarelli, M. Z. Cader, P. M. Matthews,et al., “Tract-based spatial statistics: voxelwise analysis of multi-subjectdiffusion data,” Neuroimage, vol. 31, no. 4, pp. 1487–1505, 2006.
[2] J. Veraart, D. S. Novikov, D. Christiaens, B. Ades-Aron, J. Sijbers, andE. Fieremans, “Denoising of diffusion mri using random matrix theory,” Neuroimage,vol. 142, pp. 394–406, 2016.
[3] E. Kellner, B. Dhital, V. G. Kiselev, and M. Reisert, “Gibbs-ringing artifactremoval based on local subvoxel-shifts,” Magnetic resonance in medicine,vol. 76, no. 5, pp. 1574–1581, 2016.
[4] J. L. Andersson and S. N. Sotiropoulos, “An integrated approach to correctionfor off-resonance effects and subject movement in diffusion mr imaging,”Neuroimage, vol. 125, pp. 1063–1078, 2016.
[5] A. M. Winkler, G. R. Ridgway, M. A. Webster, S. M. Smith, and T. E.Nichols, “Permutation inference for the general linear model,” Neuroimage,vol. 92, pp. 381–397, 2014.4.
[6] S. M. Smith and T. E. Nichols, “Threshold-free cluster enhancement: addressingproblems of smoothing, threshold dependence and localisation incluster inference,” Neuroimage, vol. 44, no. 1, pp. 83–98, 2009.
[7] H. Q. Li, B. Yin, C. Quan, D. Y. Geng, H. Yu, Y. F. Bao, J. Liu, andY. X. Li, “Evaluation of patients with relapsing-remitting multiple sclerosisusing tract-based spatial statistics analysis: diffusion kurtosis imaging,”BMC neurology, vol. 18, no. 1, pp. 1–6, 2018.
[8] J. Yang, X. Jiang, S. Wei, X. Deng, Y. Zhu, M. Chang, Z. Yin, H. Geng,Y. Tang, and X. Dai, “White matter tracts in bipolar disorder patients: acomparative study based on diffusion kurtosis and tensor imaging,” Journalof Affective Disorders, 2021.
Figures
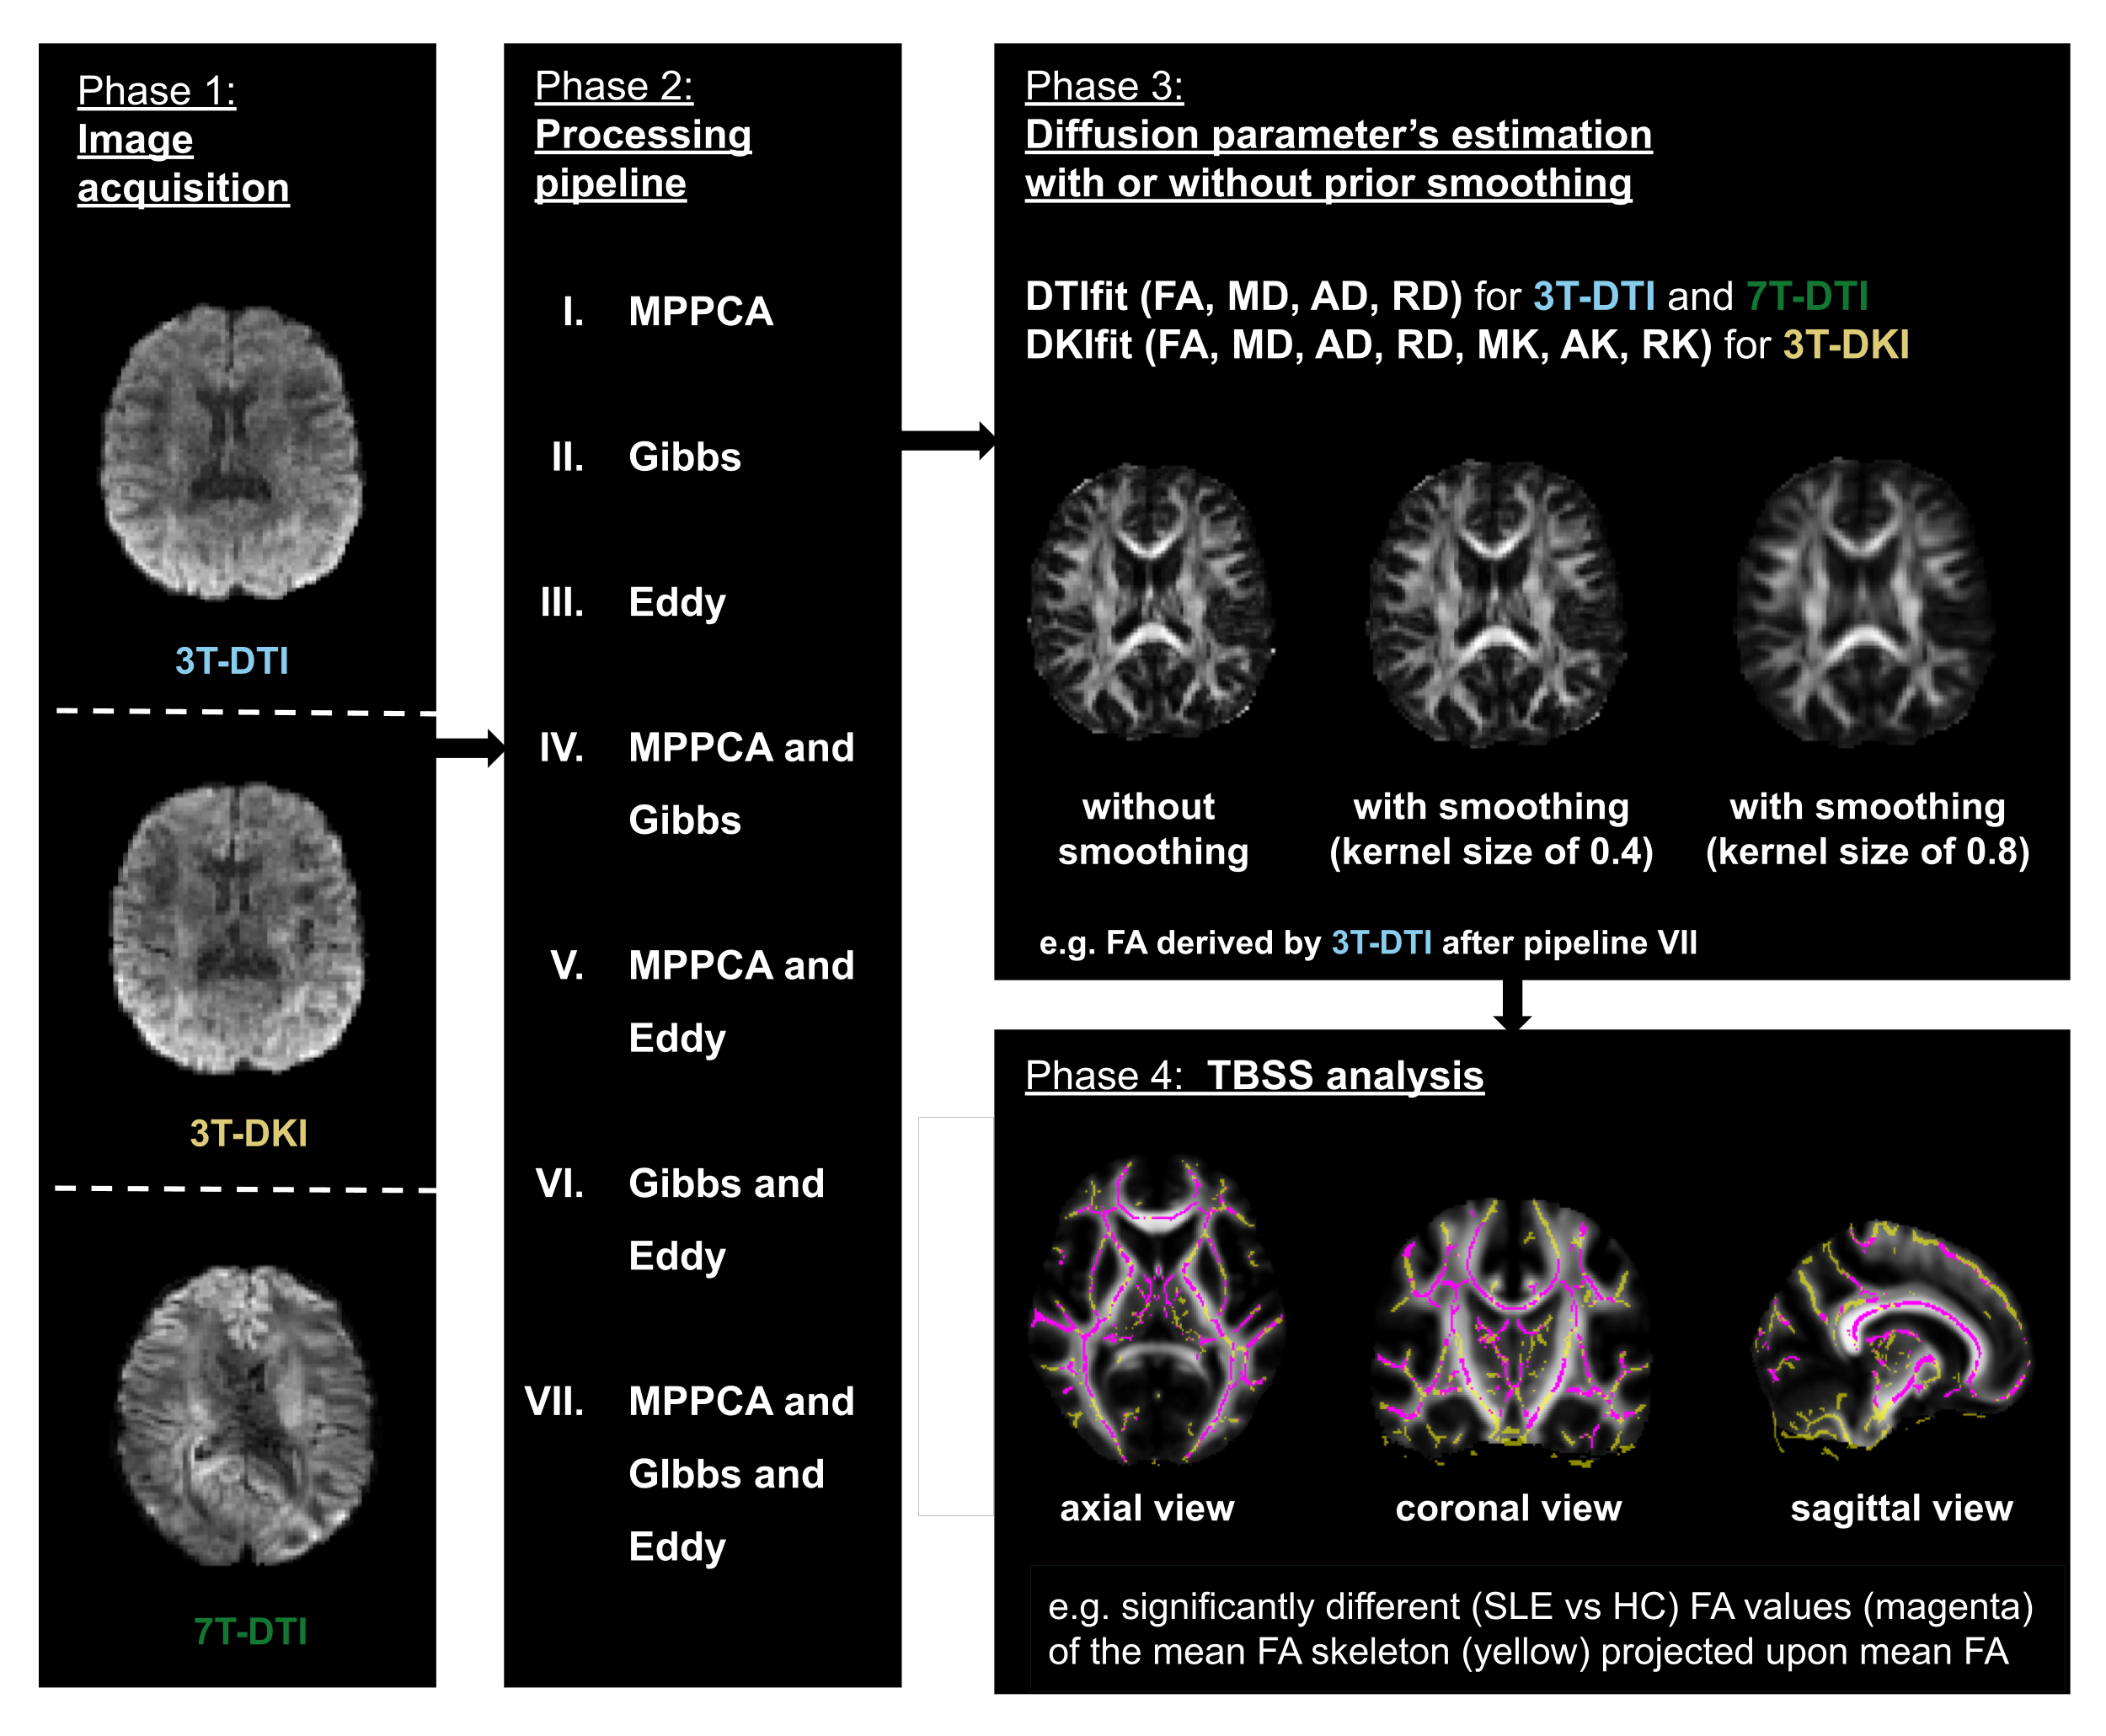
Figure 1 - The workflow. dMRI was performed using three different protocols: 3T-DTI, 3T-DKI and 7T-DTI (left-most block). Processing was performed by seven different pipelines (second block from the left). The processed data were fitted using either DTI or DKI and dMRI parameters were extracted. The fitting step was performed with different degrees of smoothing, ranging from no smoothing to substantial smoothing (top block from the right). Finally, TBSS analysis was performed for each diffusion parameter and each processing pipeline (bottom block from the right).