0693
Quantitative validation of MRI mapping of cerebral venous oxygenation with direct blood sampling: a graded-O2 study in piglets1Department of Radiology, Johns Hopkins University School of Medicine, Baltimore, MD, United States, 2Department of Anesthesiology and Critical Care Medicine, Johns Hopkins University School of Medicine, Baltimore, MD, United States, 3Department of Biomedical Engineering, Johns Hopkins University School of Medicine, Baltimore, MD, United States, 4F.M. Kirby Research Center for Functional Brain Imaging, Kennedy Krieger Research Institute, Baltimore, MD, United States
Synopsis
The neonatal brain relies primarily on oxygen metabolism to meet its enormous energy demands. Cerebral venous oxygenation (Yv) is an important parameter of the brain’s oxygen utilization, and has been demonstrated to be a potential biomarker in various neonatal diseases. We previously developed two non-invasive MRI techniques, TRUPC and accelerated-TRUPC, to measure Yv in the neonatal brain. In this work, we validated the accuracy of these two techniques by comparing their Yv measurements with gold-standard blood gas oximetry on a piglet model, and demonstrated that TRUPC and accelerated-TRUPC can provide accurate quantifications of Yv.
INTRODUCTION
The neonatal brain relies primarily on oxygen metabolism to meet its enormous energy demand for the complex structural and functional maturational processes1,2. Therefore, cerebral venous oxygenation (Yv), which indicates the balance between oxygen demand and supply, is an important index of neonatal brain function3, and has been demonstrated to be a potential biomarker in various neonatal diseases such as hypoxic-ischemic-encephalopathy4-6. T2-relaxation-under-phase-contrast (TRUPC)7 and its shorter version, accelerated TRUPC (aTRUPC)8, are two MRI techniques for quantification of neonatal Yv. TRUPC simultaneously measures Yv in major cerebral veins such as superior-sagittal-sinus (SSS) and internal-cerebral-veins (ICVs), thus can provide Yv information of both cortical and deep brain regions7. aTRUPC has a relatively lower signal-to-noise-ratio (SNR), but can be used for rapid global Yv measurement in applications where subjects cannot stay still for long8. In this work, we aimed to validate the accuracy of TRUPC and aTRUPC by comparing their Yv estimations with the gold-standard blood gas oximetry measured in the SSS. Since blood gas oximetry requires invasive blood sampling, in vivo experiments were performed on a piglet model9.METHODS
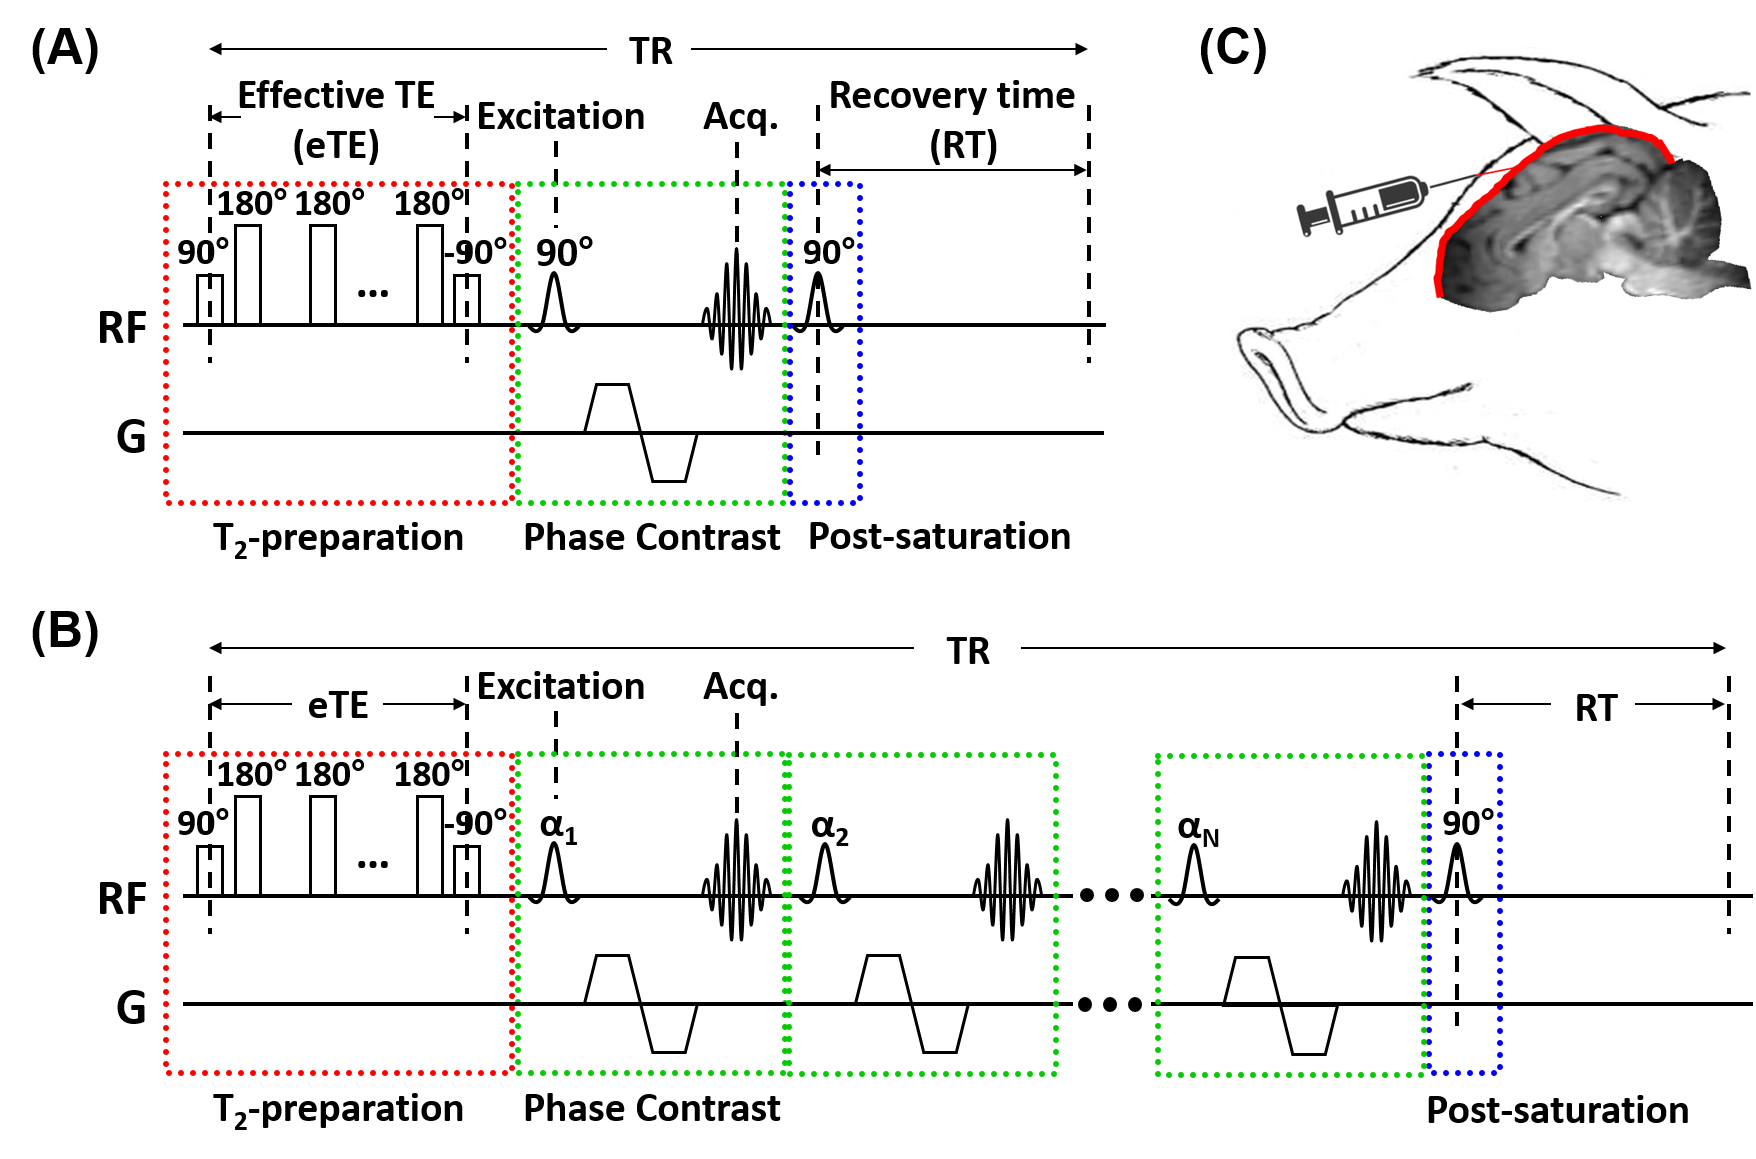
Pulse sequences: The TRUPC MRI sequence (Figure 1A) utilizes phase-contrast complex subtraction to isolate pure venous blood signal and uses T2-preparation with varying effective TEs (eTEs) to quantify the blood T2, which can be converted to Yv through a calibration model7,10. TRUPC acquires only one k-line per TR, leading to a relatively long scan time. The aTRUPC technique (Figure 1B) overcomes this drawback by employing a turbo-field-echo (TFE) scheme to acquire multiple k-lines per TR, thus substantially reduces the scan time at the cost of reduced SNR8.Animal preparation: Seven healthy neonatal piglets (males, 5-8 days old, 1.8-2.7kg) were studied. Each piglet was anesthetized and intubated for mechanical ventilation. A burr hole of 1-1.5cm2 was drilled just in front of bregma suture, and a catheter was inserted 1cm in the posterior direction in the SSS to obtain venous blood samples, as illustrated in Figure 1C.
MRI experiments: All MRI experiments were performed on a 3T Siemens Prisma scanner. During the MRI scans, the piglets were anesthetized and mechanically ventilated. For each piglet, 3-5 oxygenation levels were examined by manipulating the inhaled gas mixture and breathing rate. The oxygen concentration of the inhaled gas ranged from 16% to 100%, and the breathing rate varied from 4 to 24 breaths-per-minute. After changing the inhaled gas and/or breathing rate, we waited for 10min for the piglet’s physiology to reach a steady state. Then, one TRUPC scan and two aTRUPC scans were performed for MRI-based Yv measurements. End-tidal-carbon-dioxide (EtCO2) of the piglet during the MRI scans was recorded. Venous blood samples (~0.6ml) were drawn from the SSS after the aTRUPC scans, and the Yv and hematocrit were immediately measured using a Radiometer ABL830 blood gas analyzer. A total of 26 oxygenation levels were examined on the 7 piglets.
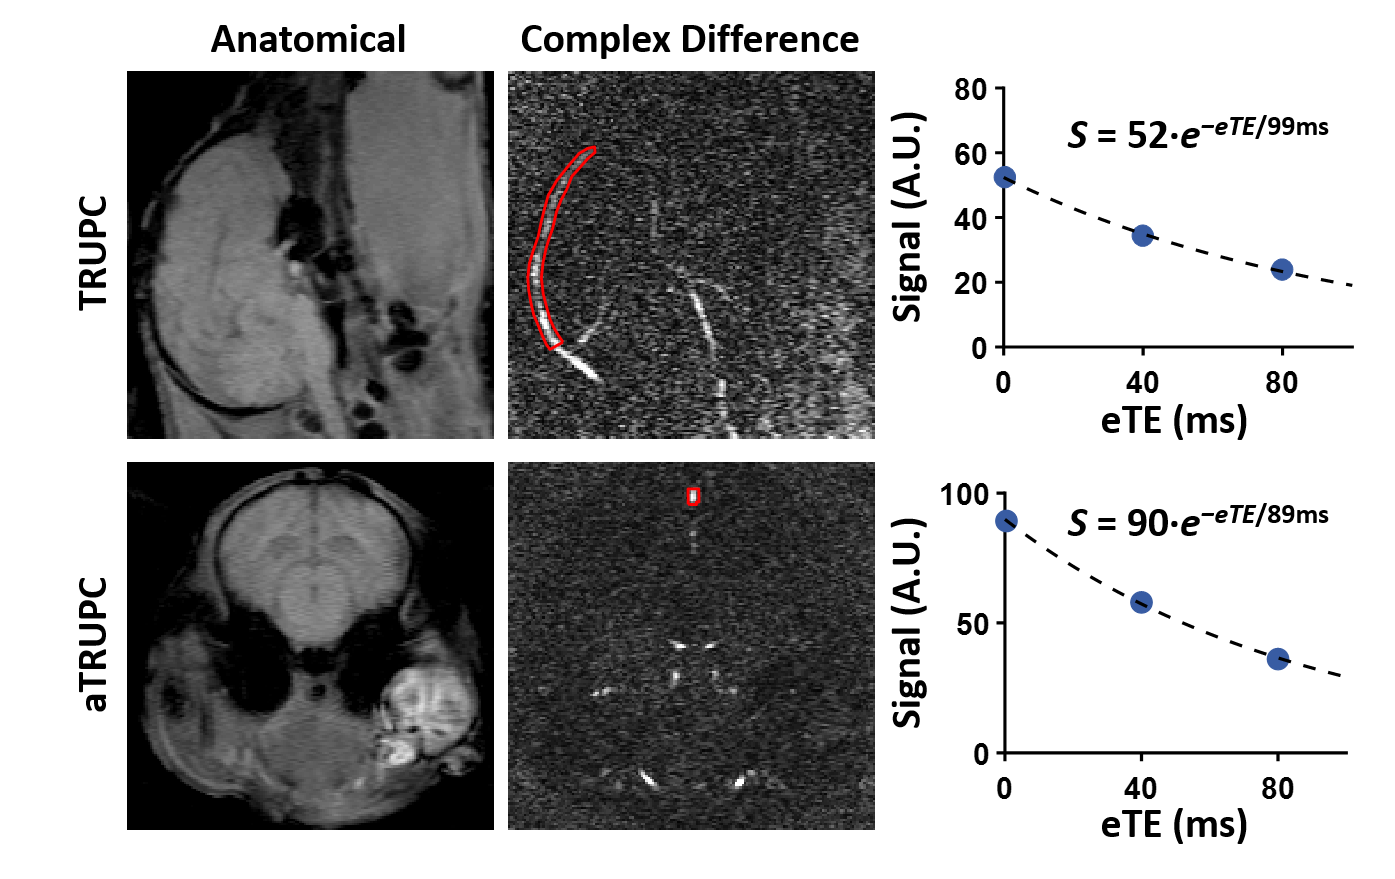
TRUPC aimed to provide a region-specific assessment of Yv and was acquired in the mid-sagittal plane (top panel, Figure 2) using8: single-slice, field-of-view (FOV)=80×80×5mm3, reconstructed voxel-size=0.5×0.5×5mm3, recovery-time (RT)=460ms, TE=10.7ms, flip-angle (FA)=90°, velocity-encoding (VENC)=5cm/s in anterior-to-posterior direction, 3 eTEs=0, 40, 80ms, and scan time=4.9min.
aTRUPC aimed to provide a rapid global Yv measurement and was acquired in a coronal plane (bottom panel, Figure 2) perpendicular to the SSS using the same parameters as TRUPC except8: TFE factor=15, RT=1000ms, TE=12.3ms, variable FA with first FA=17° and through-plane flow-encoding. Each aTRUPC scan took 1.7min.
Data analysis: The TRUPC and aTRUPC data were processed to obtain the Yv in the SSS, following procedures in the literature8. To assess the reproducibility, the coefficient-of-variation (CoV) of Yv across the two aTRUPC scans was calculated. Consistency between TRUPC and blood gas Yv was assessed in terms of intraclass-correlation-coefficient (ICC). Paired t-tests and Bland-Altman plots were used to examine the difference between the two methods. The aTRUPC Yv of the first scan was compared to blood gas Yv and TRUPC Yv, using the same statistical analyses as described above.
RESULTS AND DISCUSSION
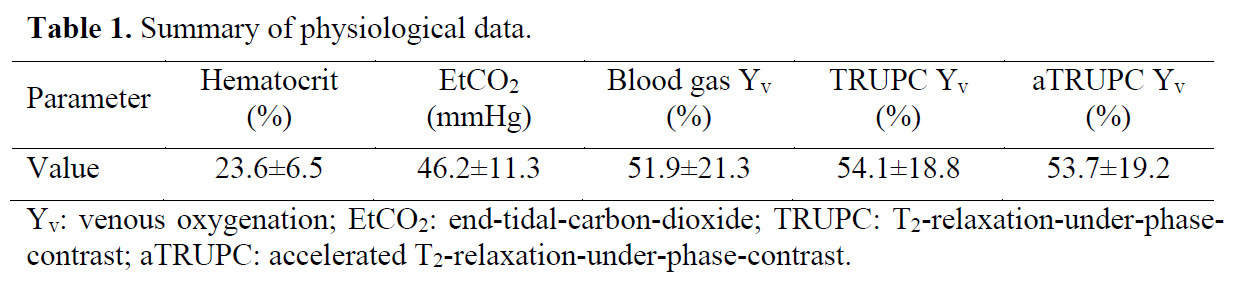
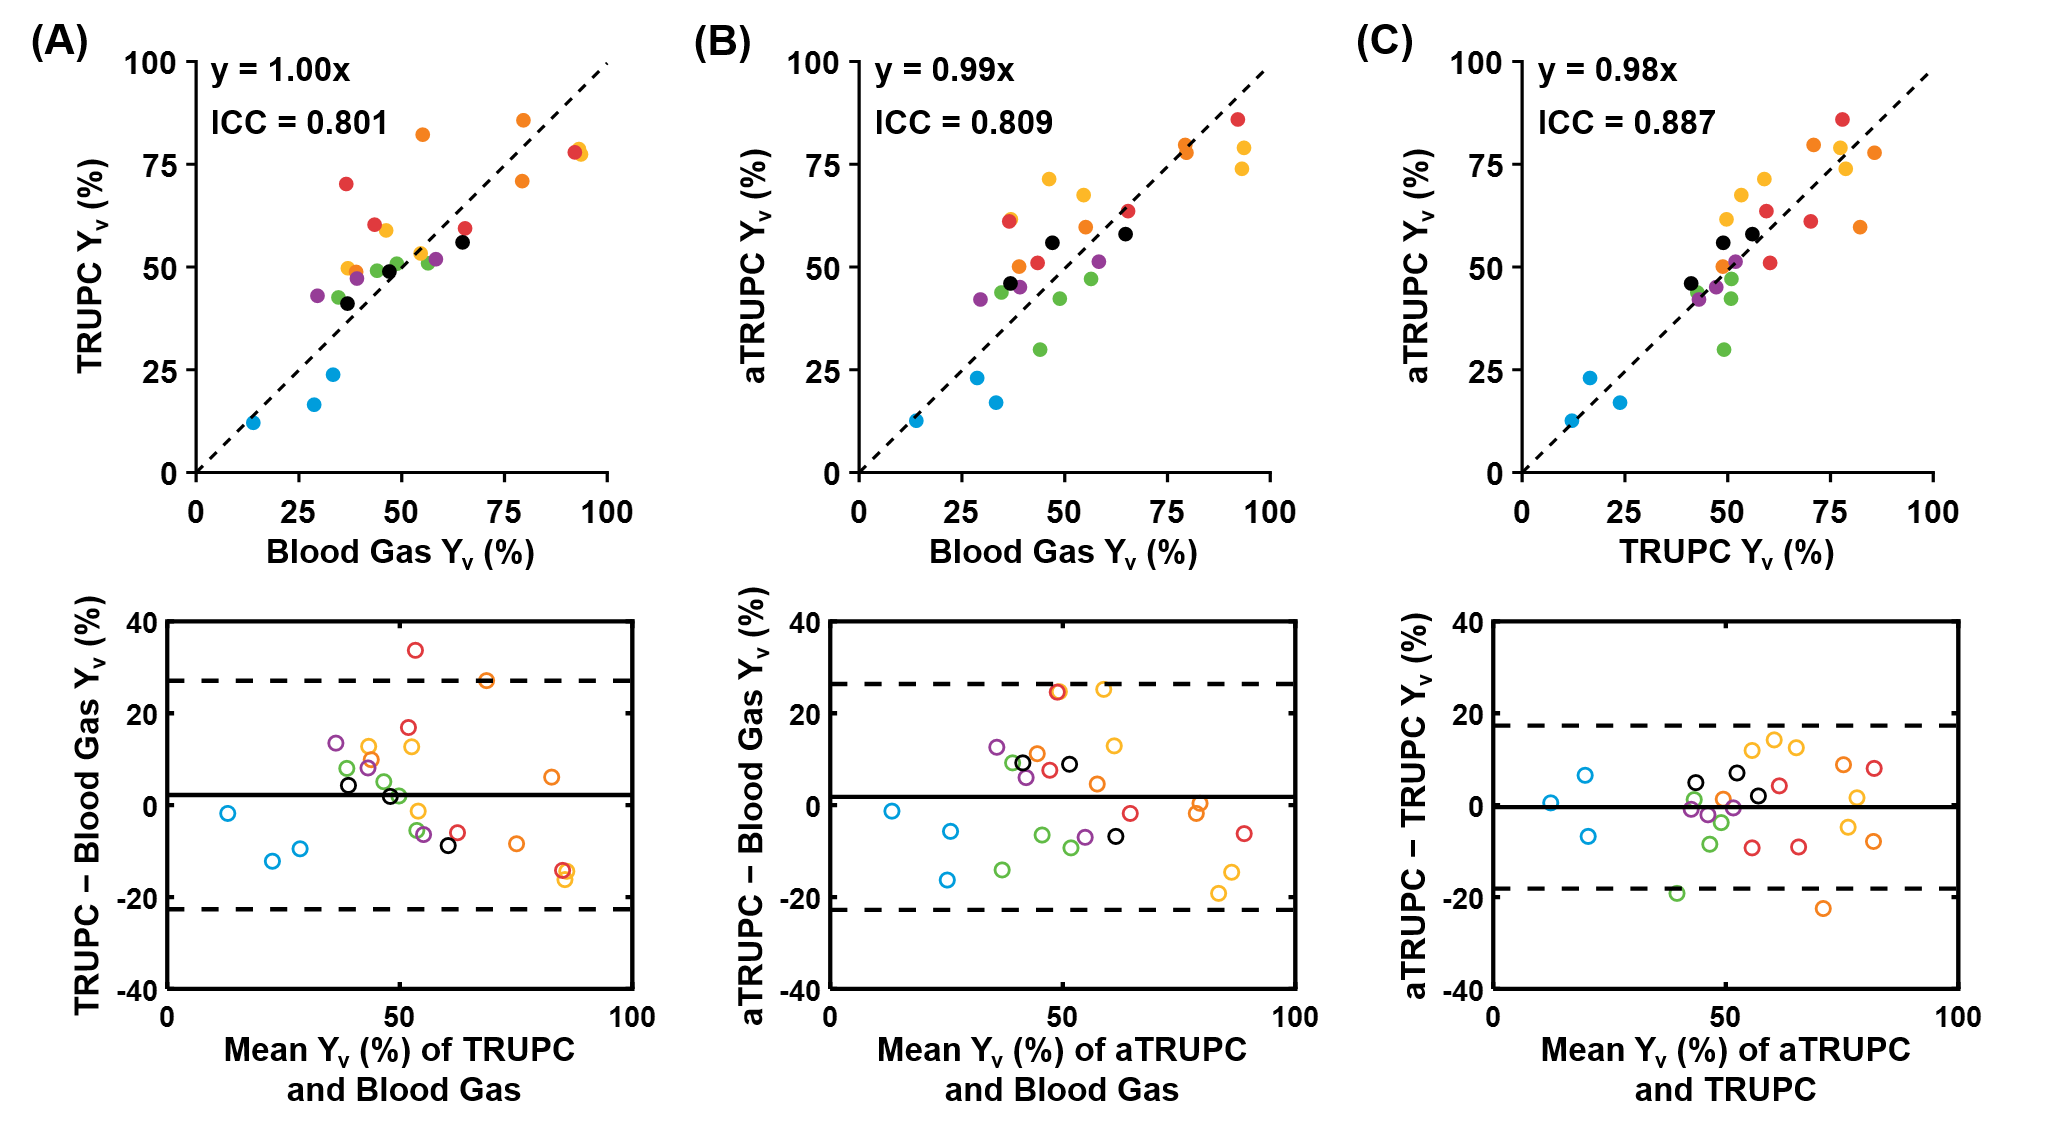
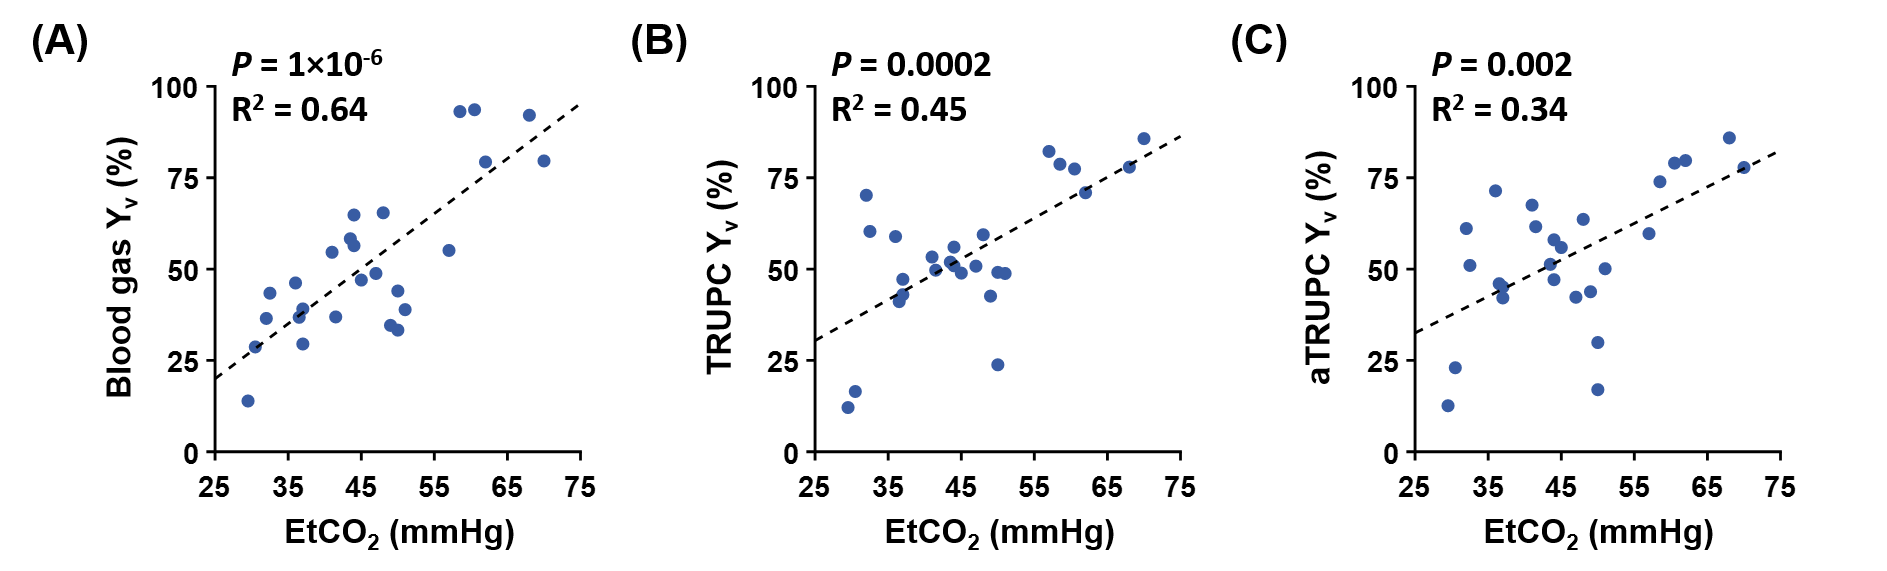
Figure 2 displays representative TRUPC and aTRUPC data. Table 1 summarizes the physiological data across the 26 oxygenation levels on the seven piglets. The mean Yv values were 51.9±21.3%, 54.1±18.8% and 53.7±19.2% for blood gas oximetry, TRUPC and aTRUPC, respectively, showing no significant difference between any two methods (P>0.3). Figure 3 shows scatter plots comparing TRUPC, aTRUPC and blood gas Yv measurements. There were good correlations between TRUPC and blood gas Yv (ICC=0.801, P<0.0001), between aTRUPC and blood gas Yv (ICC=0.809, P<0.0001) and also between aTRUPC and TRUPC Yv (ICC=0.887, P<0.0001). The Bland-Altman plots also demonstrate good agreements among the three methods. The CoV of aTRUPC Yv was 8.1±9.9%, which was comparable to other physiological measurements such as arterial-spin-labeling11,12. In addition, we found that EtCO2 correlated positively with blood gas Yv (P<0.0001), TRUPC Yv (P=0.0002) and also aTRUPC Yv (P=0.002), as shown in Figure 4. These findings reflected the vasodilatory effects of blood CO2 content and were consistent with the literature13-15.CONCLUSION
Yv measured by TRUPC and aTRUPC were in good agreement with blood gas oximetry, suggesting that TRUPC and aTRUPC can provide accurate quantifications of Yv in major cerebral veins.Acknowledgements
No acknowledgement found.References
1. Kuzawa CW, Chugani HT, Grossman LI, Lipovich L, Muzik O, Hof PR, Wildman DE, Sherwood CC, Leonard WR, Lange N. Metabolic costs and evolutionary implications of human brain development. Proc Natl Acad Sci U S A 2014;111:13010-13015.
2. Dekaban AS. Changes in brain weights during the span of human life: relation of brain weights to body heights and body weights. Ann Neurol 1978;4:345-356.
3. Liu P, Chalak LF, Lu H. Non-invasive assessment of neonatal brain oxygen metabolism: A review of newly available techniques. Early Hum Dev 2014;90:695-701.
4. De Vis JB, Petersen ET, Alderliesten T, Groenendaal F, de Vries LS, van Bel F, Benders MJ, Hendrikse J. Non-invasive MRI measurements of venous oxygenation, oxygen extraction fraction and oxygen consumption in neonates. Neuroimage 2014;95:185-192.
5. Dehaes M, Aggarwal A, Lin PY, Rosa Fortuno C, Fenoglio A, Roche-Labarbe N, Soul JS, Franceschini MA, Grant PE. Cerebral oxygen metabolism in neonatal hypoxic ischemic encephalopathy during and after therapeutic hypothermia. J Cereb Blood Flow Metab 2014;34:87-94.
6. Shetty AN, Lucke AM, Liu P, Sanz Cortes M, Hagan JL, Chu ZD, Hunter JV, Lu H, Lee W, Kaiser JR. Cerebral oxygen metabolism during and after therapeutic hypothermia in neonatal hypoxic-ischemic encephalopathy: a feasibility study using magnetic resonance imaging. Pediatr Radiol 2019;49:224-233.
7. Krishnamurthy LC, Liu P, Ge Y, Lu H. Vessel-specific quantification of blood oxygenation with T2-relaxation-under-phase-contrast MRI. Magn Reson Med 2014;71:978-989.
8. Jiang D, Lu H, Parkinson C, Su P, Wei Z, Pan L, Tekes A, Huisman T, Golden WC, Liu P. Vessel-specific quantification of neonatal cerebral venous oxygenation. Magn Reson Med 2019;82:1129-1139.
9. Lee JK, Liu D, Raven EP et al. Mean Diffusivity in Striatum Correlates With Acute Neuronal Death but Not Lesser Neuronal Injury in a Pilot Study of Neonatal Piglets With Encephalopathy. J Magn Reson Imaging 2020;52:1216-1226.
10. Lu H, Xu F, Grgac K, Liu P, Qin Q, van Zijl P. Calibration and validation of TRUST MRI for the estimation of cerebral blood oxygenation. Magn Reson Med 2012;67:42-49.
11. Mutsaerts HJ, Steketee RM, Heijtel DF, Kuijer JP, van Osch MJ, Majoie CB, Smits M, Nederveen AJ. Inter-vendor reproducibility of pseudo-continuous arterial spin labeling at 3 Tesla. PLoS One 2014;9:e104108.
12. Petersen ET, Mouridsen K, Golay X, all named co-authors of the Qt-rs. The QUASAR reproducibility study, Part II: Results from a multi-center Arterial Spin Labeling test-retest study. Neuroimage 2010;49:104-113.
13. Jain V, Langham MC, Floyd TF, Jain G, Magland JF, Wehrli FW. Rapid magnetic resonance measurement of global cerebral metabolic rate of oxygen consumption in humans during rest and hypercapnia. J Cereb Blood Flow Metab 2011;31:1504-1512.
14. Xu F, Uh J, Brier MR, Hart J, Jr., Yezhuvath US, Gu H, Yang Y, Lu H. The influence of carbon dioxide on brain activity and metabolism in conscious humans. J Cereb Blood Flow Metab 2011;31:58-67.
15. Chen JJ, Pike GB. Global cerebral oxidative metabolism during hypercapnia and hypocapnia in humans: implications for BOLD fMRI. J Cereb Blood Flow Metab 2010;30:1094-1099.
Figures