0692
High-resolution MAP-MRI reveals cortical area specific laminar patterns observed with histological staining1Eunice Kennedy Shriver National Institute of Child Health and Human Development, National Institutes of Health, Bethesda, MD, United States, 2Center for Neuroscience and Regenerative Medicine, The Henry Jackson Foundation, Bethesda, MD, United States
Synopsis
We investigate the sensitivity of high-resolution MAP-MRI to distinguish cortical architectonic features by directly comparing laminar patterns in whole-brain volumes of MAP-derived parameters to the corresponding histological sections in the same macaque monkey brain. MAP parameters, in particular PA, NG, RTAP, DEC, and fODF maps, show cortical area-specific lamination patterns with excellent conspicuity in the mid-cortical layers, matching, and sometimes complementing, the contrast observed in the immuno- or histochemically stained sections. Delineating cortical areas with distinct cytoarchitectonic features non-invasively based on diffusion propagators could transform our ability to study brain networks and diagnose subtle microstructural changes in many clinical applications.
Introduction
The variations in cell bodies and neuropil in different cortical laminae revealed by histological analysis provide the biological basis for cytoarchitectonic parcellation of cortical areas. High-resolution diffusion MRI (dMRI) is a promising method for assessing cortical cytoarchitectonic features non-invasively in fixed1-5 and live6-12 brain tissues. Mean apparent propagator (MAP) MRI13, is a comprehensive, clinically feasible14 dMRI method that explicitly measures the distributions of net 3D displacements of diffusing water molecules interacting with the underlying tissue microstructure, i.e., the diffusion propagators.We investigate the sensitivity of high-resolution MAP-MRI to distinguish cortical cytoarchitectonic features by directly comparing laminar patterns of MAP-derived parameters to the corresponding histological sections from the same macaque monkey brain specimen. Identifying boundaries between cortical areas based on tissue architectural patterns imaged non-invasively with MAP-MRI could be transformative to basic and clinical brain sciences.
Methods
We scanned the brain of a perfusion-fixed male macaque monkey using a MAP-MRI protocol with 3D spin-echo EPI to achieve a 200µm isotropic resolution and TE/TR=50/650ms. We acquired 112 diffusion-weighted images (DWIs) with with δ=6ms and Δ=28ms, and multiple b-value shells (0.1,1.0,2.5,4.5,7.0, and 10.0 ms/µm2) and diffusion-encoding gradient orientations (3,9,15,21,28, and 36, respectively) uniformly sampling the unit sphere on each b-value shell.We processed all MAP-MRI DWIs to correct for image drift and EPI distortions, including gradient eddy currents and magnetic field inhomogeneities15. From the corrected DWIs we estimated the MAP propagators, computed DTI (fractional anisotropy – FA; mean, axial, and radial diffusivities – MD, AD, and RD, respectively) and MAP microstructural parameters (propagator anisotropy – PA, non-gaussianity – NG, return-to-origin probability – RTOP, return-to-axis probability – RTAP, and return-to-plane probability – RTPP), and generated fiber orientation distribution functions (fODFs)16,17.
After imaging, the entire brain was serially sectioned in the coronal plane at 50µm thickness and prepared for histological processing. Five alternating (interleaved) series of sections were processed using immunohistochemistry with antibodies against parvalbumin (PV), neurofilament protein (SMI-32), and choline acetyltransferase (ChAT), and histochemical staining with cresyl violet (CV) and Acetylcholinesterase (AchE). Coronal slices of MAP-MRI parameters were manually aligned with the matched high-resolution microscope images of the stained sections for cell bodies and their processes to allow direct comparison of architectonic features across layers in multiple cortical areas.
Results
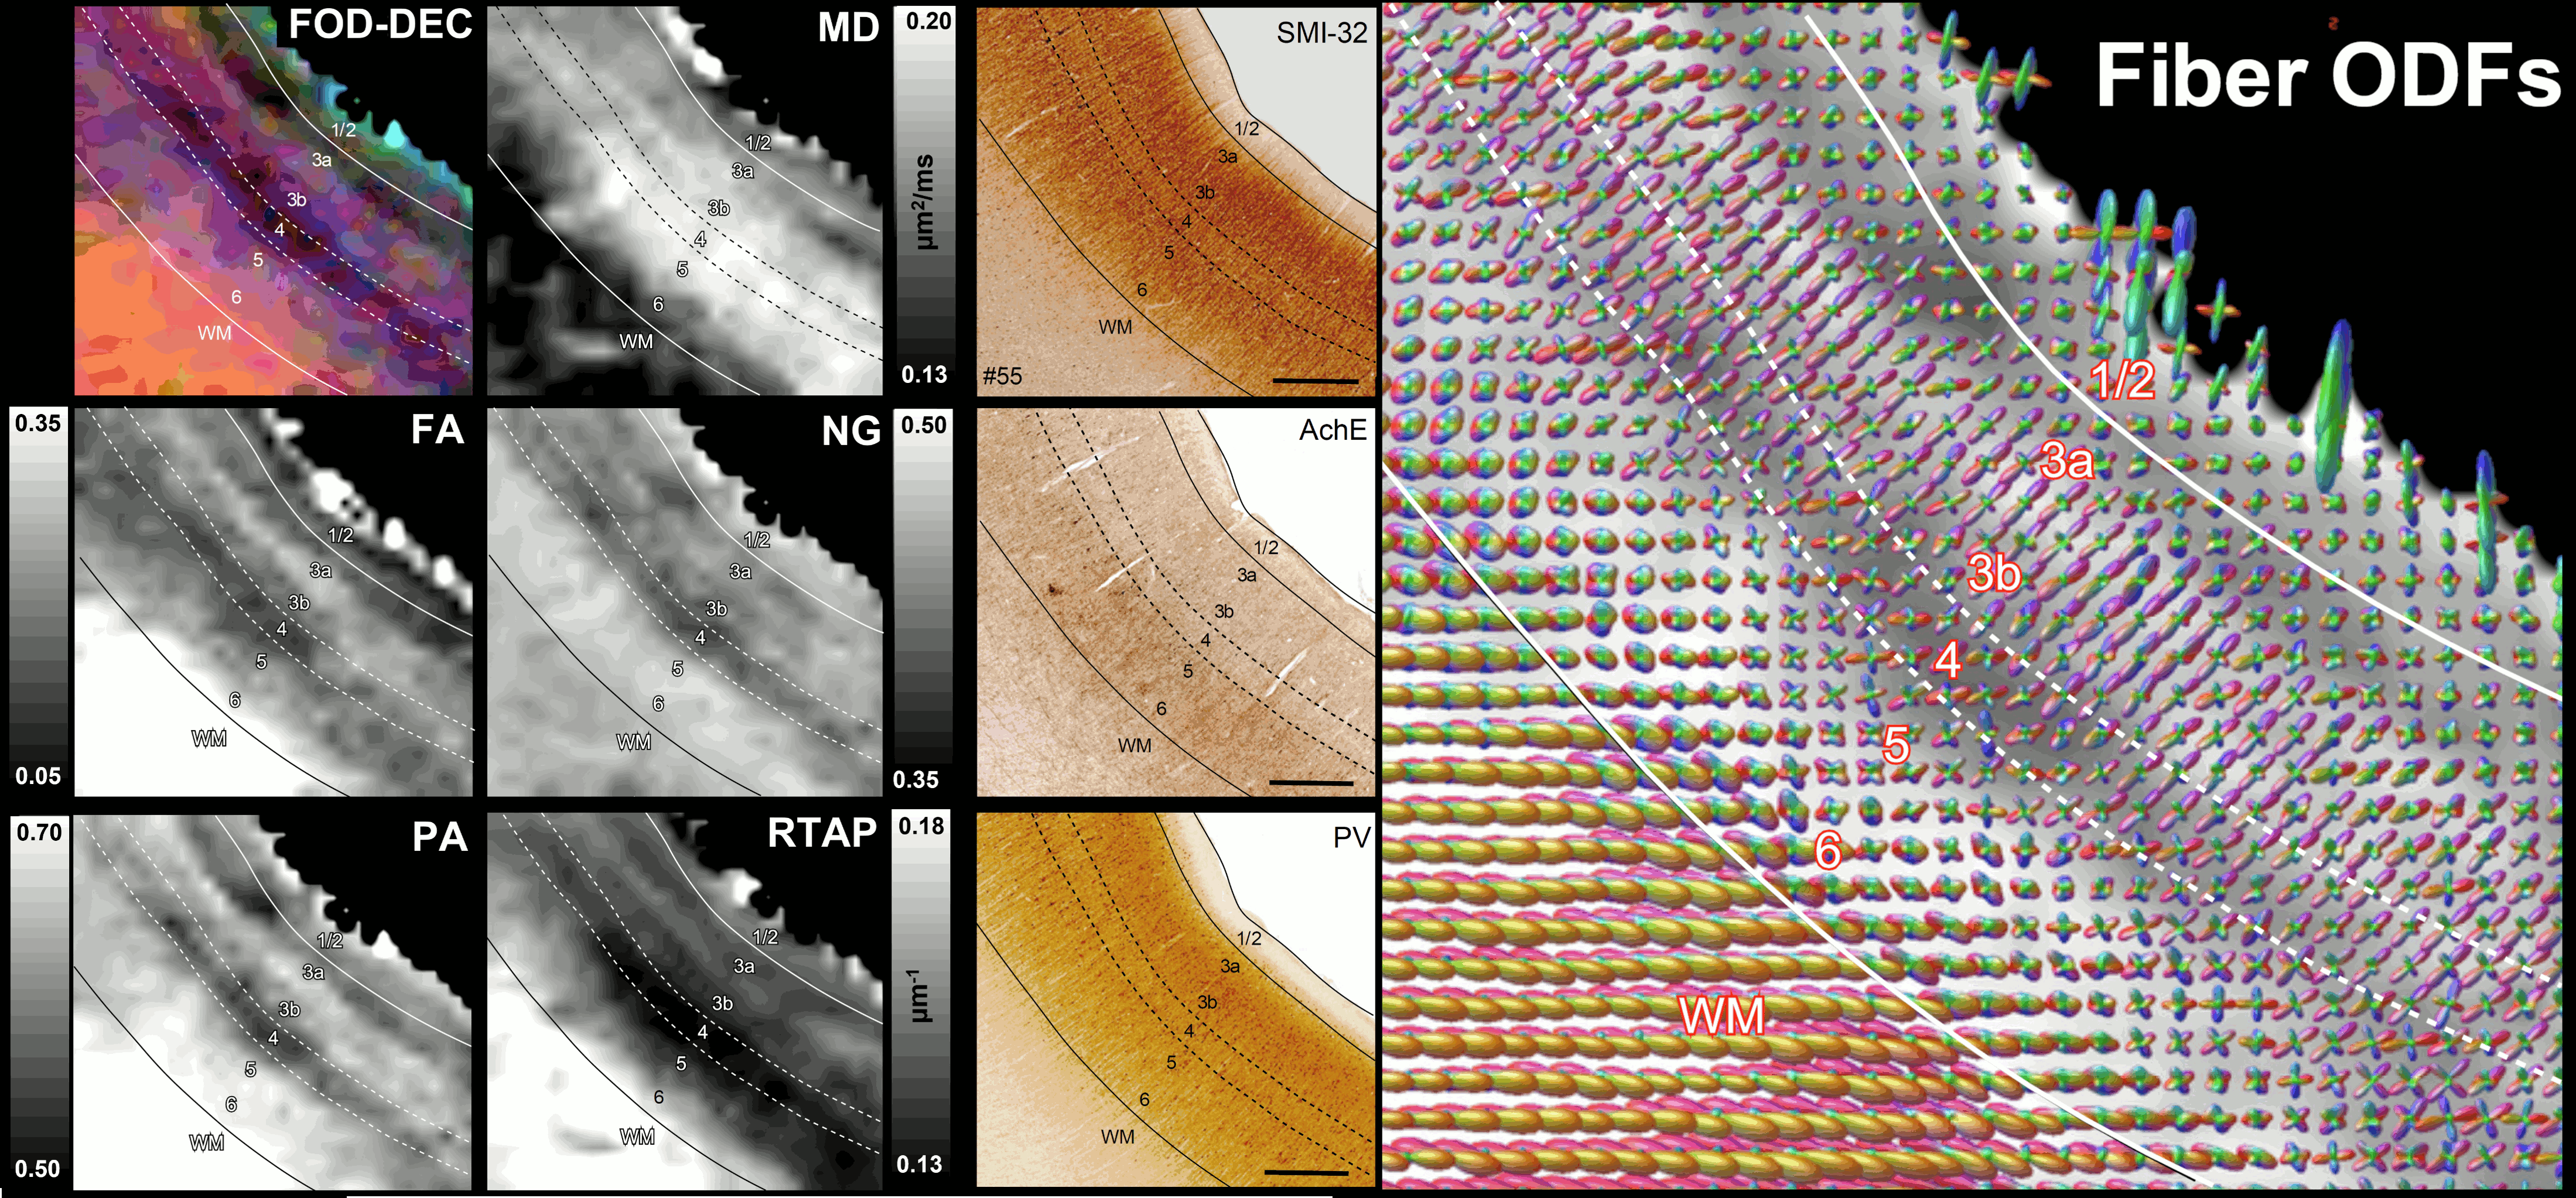
High-resolution volumes of MAP/DTI parameters revealed fine anatomical details with excellent contrast in the cortex, with bands of different intensities and thicknesses along the cortical ribbon (Fig. 1). Abrupt discontinuities in the laminar pattern along the cortical ribbon correspond well with the boundaries between cortical areas estimated using atlas-based registration18,19 and showed good symmetry between the left and right hemispheres.The cortical laminar patterns observed with MAP/DTI parameters showed areal differences in excellent agreement with the cytoarchitectonic features in the corresponding histological sections with multiple stains. In general, the most eloquent parameters were PA, NG, and RTAP. The superficial layers (1/2) showed relatively low PA and NG values correlated with light SMI-32 and PV staining, suggesting the mostly isotropic diffusion processes likely due to the presence of small neuronal and non-neuronal (glial) cells. The mid-cortical layers (3/4) showed large PA and RTAP, and intermediate NG values dominated by diffusion processes perpendicular to the cortical surface (DEC and fODF maps in Figs. 2 and 3) in good agreement with the orientation of neuronal cell bodies and their processes observed in the corresponding SMI-32-stained sections. Midcortical PA and RTAP values were remarkable, revealing cortical area-specific laminar patterns (compare Figs. 2 and 3), often with superior conspicuity compared to the corresponding histological stains. Diffusion propagators in the deep layers (5/6) showed intermediate/high PA and NG values, and lower RTAP correlating with increased AchE staining and likely due to mixtures of radial and tangential diffusion processes as indicated by the corresponding fODFs.
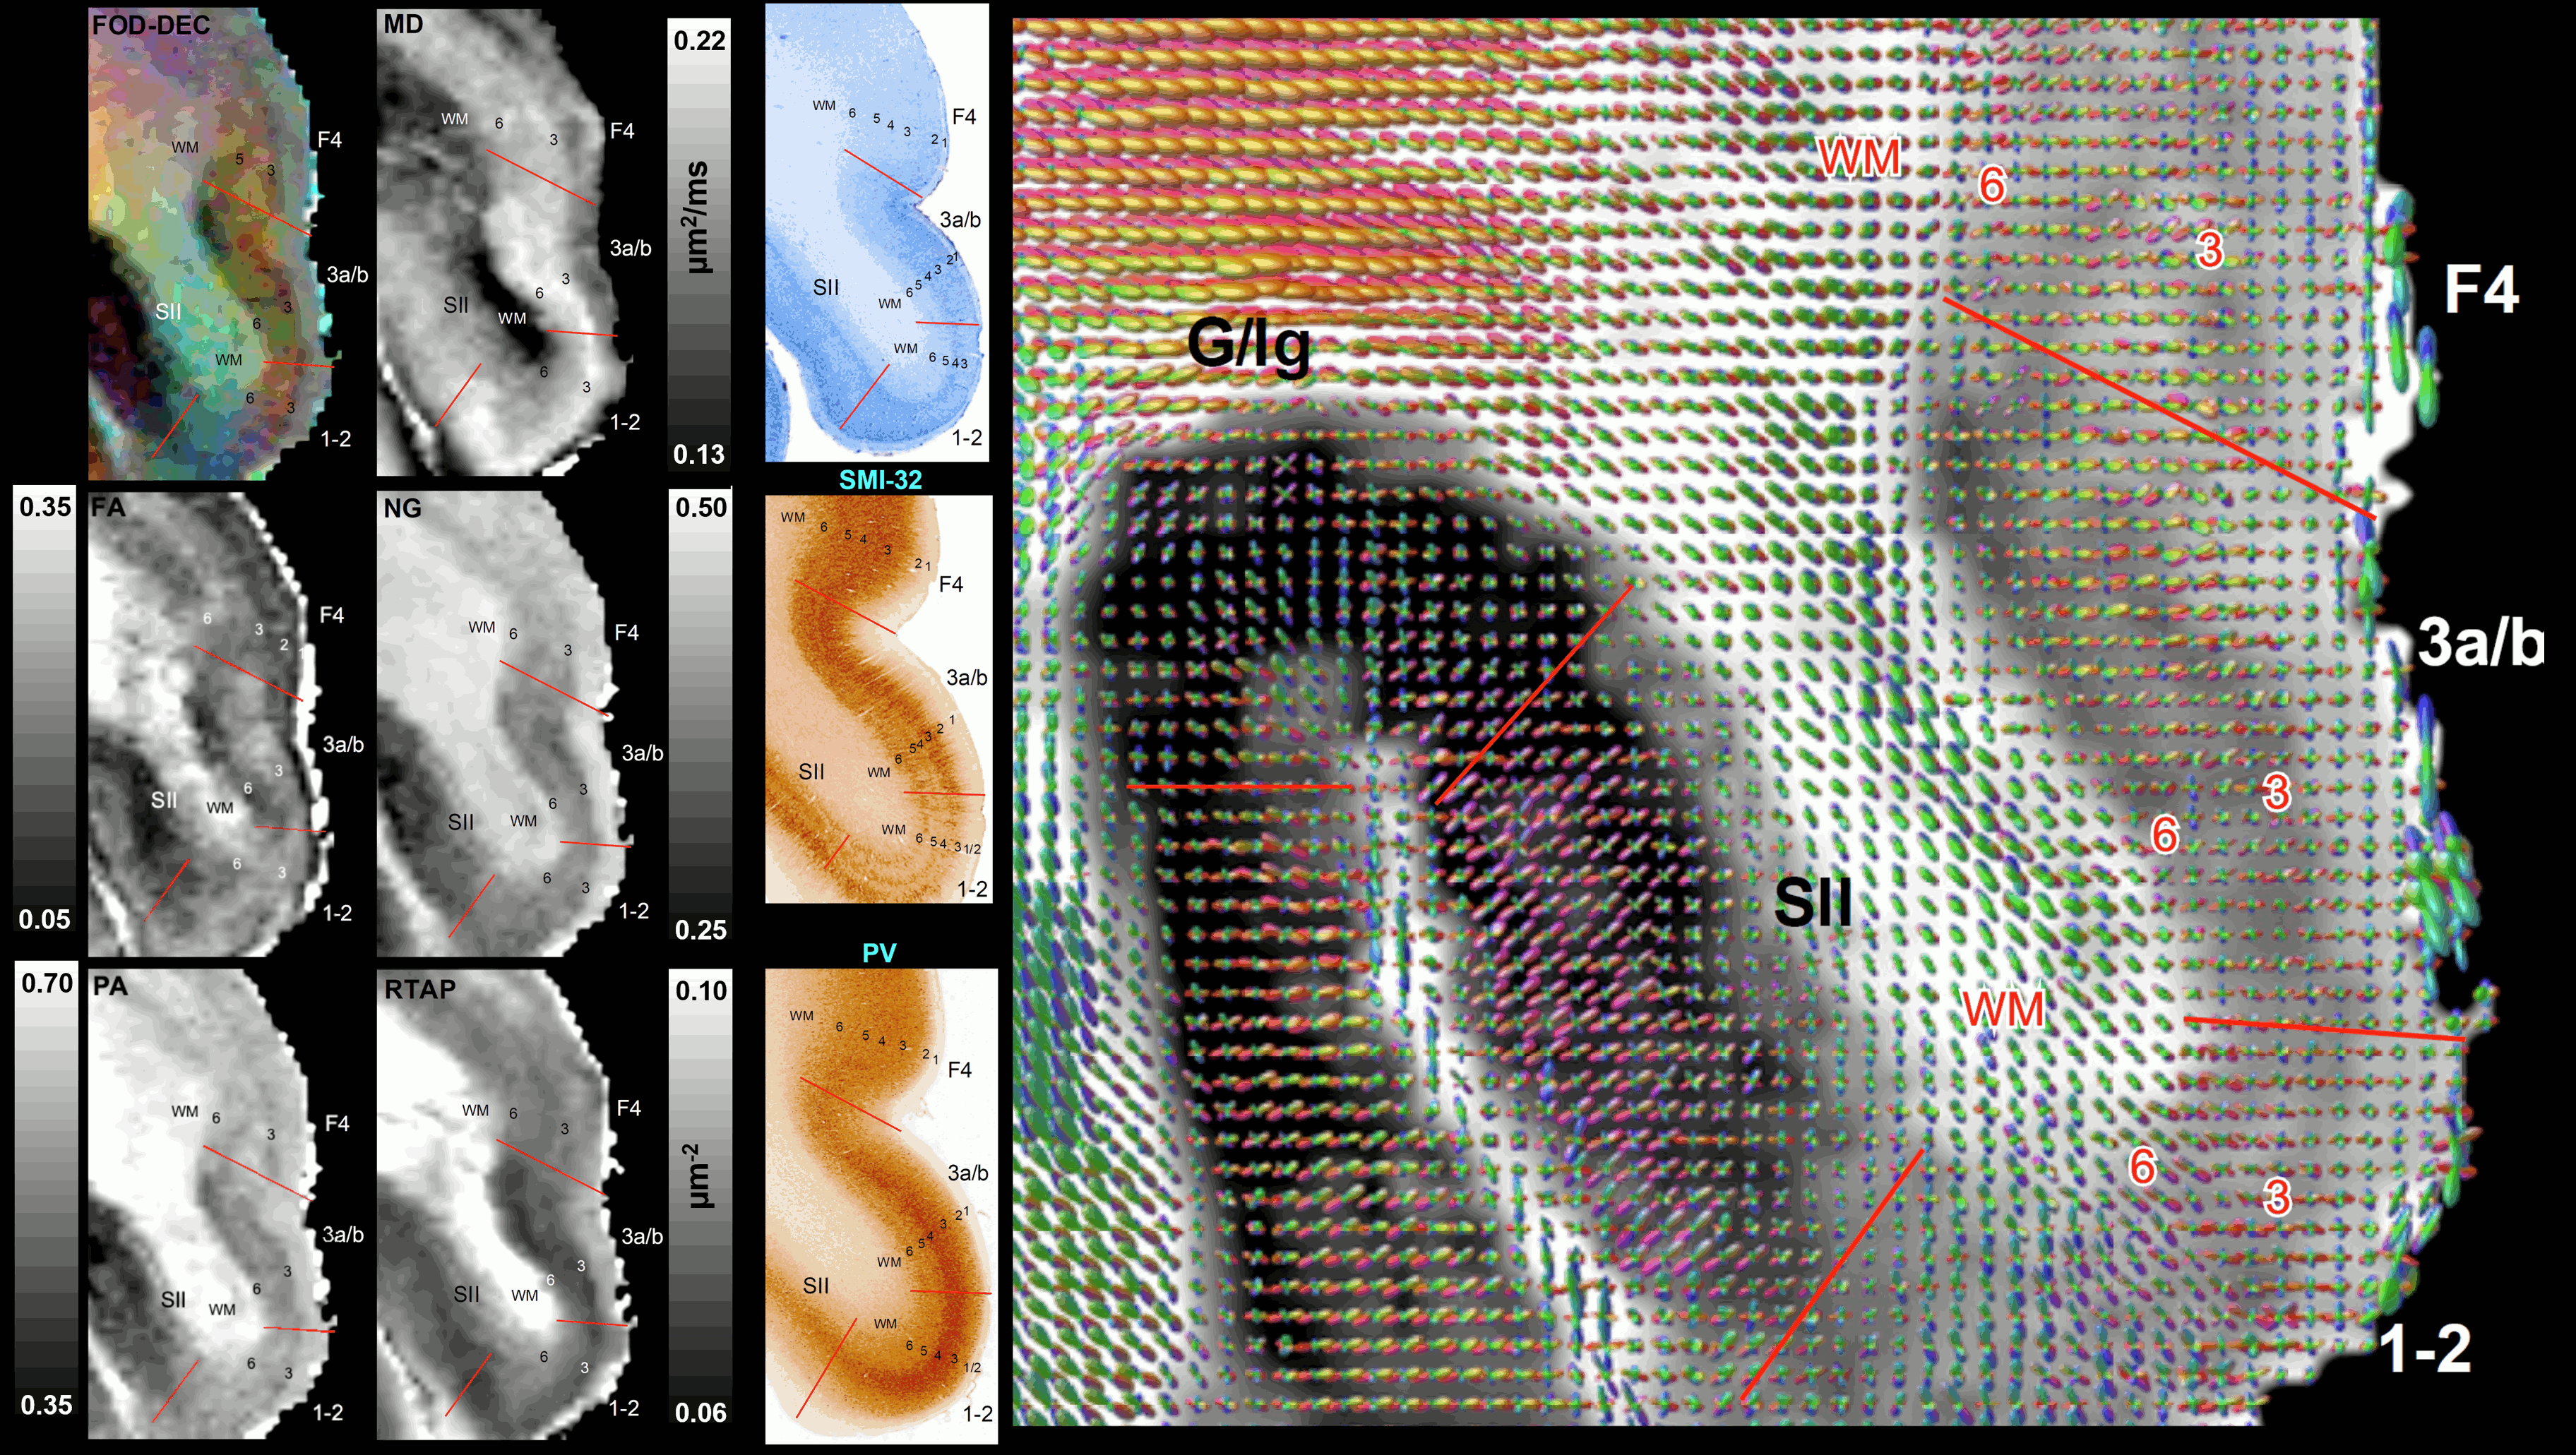
Taken together, the variation of MAP/DTI parameters along the cortical ribbon often revealed clear transition regions between adjacent cortical areas identified based on the corresponding histological stains (e.g., premotor area F4, and somatosensory areas 3a/b, 1-2, and SII in Fig. 4). Transitions between cortical areas could be accurately delineated even in thin cortical areas in the occipital region (e.g., V1/V2 border) where the laminar patterns were more difficult to resolve (Fig. 5).
Discussion and Conclusion
Via validation with multiple histological staining, we establish the sensitivity of MAP-MRI parameters to cortical architectonic features. High-resolution whole-brain MAP-MRI can delineate distinct laminar patterns in different cortical layers in good agreement with the staining intensities of neuronal cell bodies and their processes observed with histological methods. Moreover, the important features of tissue water diffusion propagators quantified by the family of MAP parameters could provide complementary information to histological methods.MAP-MRI is a non-invasive, 3D imaging method that has the potential to improve atlas-based parcellation of the entire cortex by clustering the laminar patterns based on diffusion propagator properties, including MAP parameters like PA and RTAP, as well as fODFs. Recent advances in MRI hardware20 could enable whole-brain clinical MAP-MRI14 at sufficiently high spatial resolution for in vivo human applications. Future applications may include accurate microstructure-based cortical parcellation for connectomics analysis and assessing cytoarchitectonic features for clinical applications in monitoring cortical development or detecting microstructural changes due to focal cortical dysplasia, stroke, or brain injury.
Acknowledgements
This work was supported by the Intramural Research Program (IRP) of the Eunice Kennedy Shriver National Institute of Child Health and Human Development, “Connectome 2.0: Developing the next generation human MRI scanner for bridging studies of the micro-, meso- and macro-connectome”, NIH BRAIN Initiative 1U01EB026996-01 and the CNRM Neuroradiology/Neuropathology Correlation/Integration Core, 309698-4.01-65310, (CNRM-89-9921).References
1 Aggarwal, M., Nauen, D. W., Troncoso, J. C. & Mori, S. Probing region-specific microstructure of human cortical areas using high angular and spatial resolution diffusion MRI. NeuroImage 105, 198-207, doi:10.1016/j.neuroimage.2014.10.053 (2015).
2 Dyrby, T. B. et al. An ex vivo imaging pipeline for producing high-quality and high-resolution diffusion-weighted imaging datasets. Human Brain Mapping 32, 544-563, doi:https://doi.org/10.1002/hbm.21043 (2011).
3 Kleinnijenhuis, M. et al. Layer-specific diffusion weighted imaging in human primary visual cortex in vitro. Cortex 49, 2569-2582, doi:https://doi.org/10.1016/j.cortex.2012.11.015 (2013).
4 Leuze, C. W. U. et al. Layer-specific intracortical connectivity revealed with diffusion MRI. Cerebral Cortex 24, 328-339, doi:10.1093/cercor/bhs311 (2014).
5 Miller, K. L. et al. Diffusion imaging of whole, post-mortem human brains on a clinical MRI scanner. NeuroImage 57, 167-181, doi:10.1016/j.neuroimage.2011.03.070 (2011).
6 Ganepola, T. et al. Using diffusion MRI to discriminate areas of cortical grey matter. NeuroImage 182, 456-468 (2018).
7 Gulban, O. F. et al. Cortical fibers orientation mapping using in-vivo whole brain 7 T diffusion MRI. NeuroImage 178, 104-118, doi:https://doi.org/10.1016/j.neuroimage.2018.05.010 (2018).
8 Kang, X., Herron, T. J., Turken, U. & Woods, D. L. Diffusion properties of cortical and pericortical tissue: regional variations, reliability and methodological issues. Magnetic Resonance Imaging 30, 1111-1122, doi:https://doi.org/10.1016/j.mri.2012.04.004 (2012).
9 Kleinnijenhuis, M. et al. Diffusion tensor characteristics of gyrencephaly using high resolution diffusion MRI in vivo at 7T. NeuroImage 109, 378-387, doi:10.1016/j.neuroimage.2015.01.001 (2015).
10 McNab, J. A. et al. Surface based analysis of diffusion orientation for identifying architectonic domains in the in vivo human cortex. NeuroImage 69, 87-100, doi:https://doi.org/10.1016/j.neuroimage.2012.11.065 (2013).
11 Nagy, Z., Alexander, D. C., Thomas, D. L., Weiskopf, N. & Sereno, M. I. Using High Angular Resolution Diffusion Imaging Data to Discriminate Cortical Regions. PLoS ONE 8, doi:10.1371/journal.pone.0063842 (2013).
12 Truong, T. K., Guidon, A. & Song, A. W. Cortical depth dependence of the diffusion anisotropy in the human cortical gray matter in vivo. PLoS ONE 9, doi:10.1371/journal.pone.0091424 (2014).
13 Özarslan, E. et al. Mean apparent propagator (MAP) MRI: a novel diffusion imaging method for mapping tissue microstructure. NeuroImage 78, 16-32 (2013).
14 Avram, A. V. et al. Clinical feasibility of using mean apparent propagator (MAP) MRI to characterize brain tissue microstructure. NeuroImage 127, 422-434 (2016).
15 Pierpaoli, C. et al. in 18th Scientific Meeting of the International Society for Magnetic Resonance in Medicine. 1597.
16 Tournier, J. D., Calamante, F. & Connelly, A. Robust determination of the fibre orientation distribution in diffusion MRI: Non-negativity constrained super-resolved spherical deconvolution. NeuroImage 35, 1459-1472, doi:10.1016/j.neuroimage.2007.02.016 (2007).
17 Tournier, J. D., Calamante, F. & Connelly, A. MRtrix: diffusion tractography in crossing fiber regions. International journal of imaging systems and technology 22, 53-66 (2012).
18 Saleem, K. S. & Logothetis, N. K. A combined MRI and histology atlas of the rhesus monkey brain in stereotaxic coordinates. (Academic Press, 2012).
19 Reveley, C. et al. Three-dimensional digital template atlas of the macaque brain. Cerebral Cortex 27, 4463-4477 (2016).
20 Huang, S. Y. et al. Connectome 2.0: Developing the next-generation ultra-high gradient strength human MRI scanner for bridging studies of the micro-, meso-and macro-connectome. NeuroImage 243, 118530 (2021).
Figures
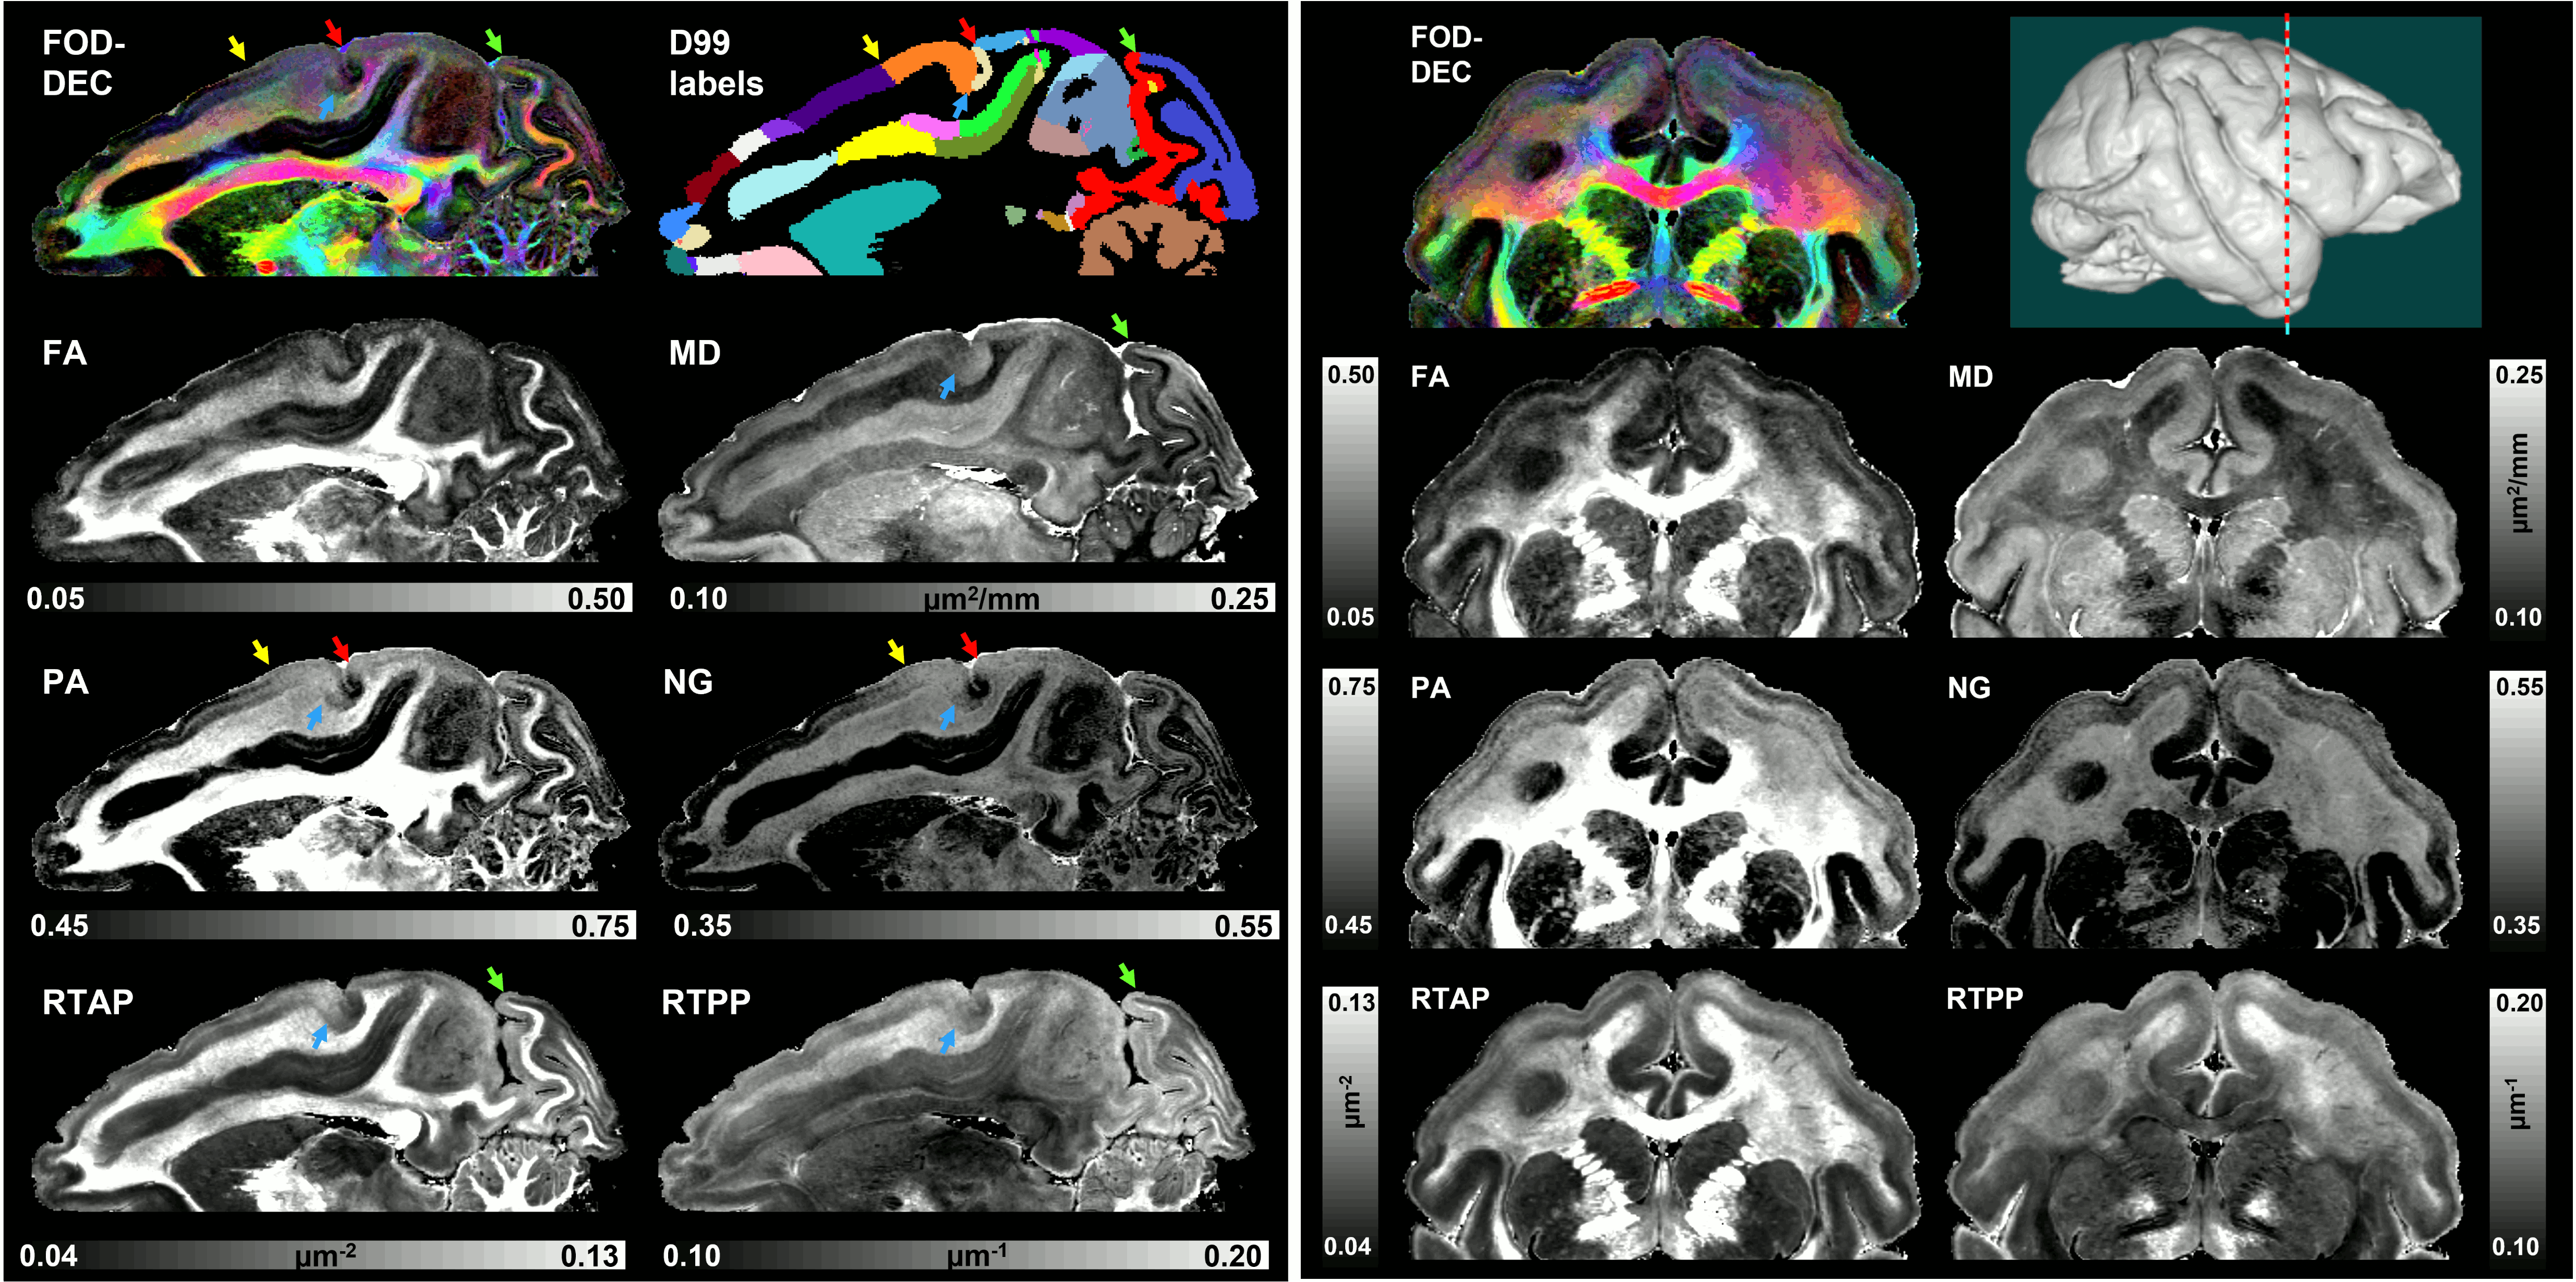
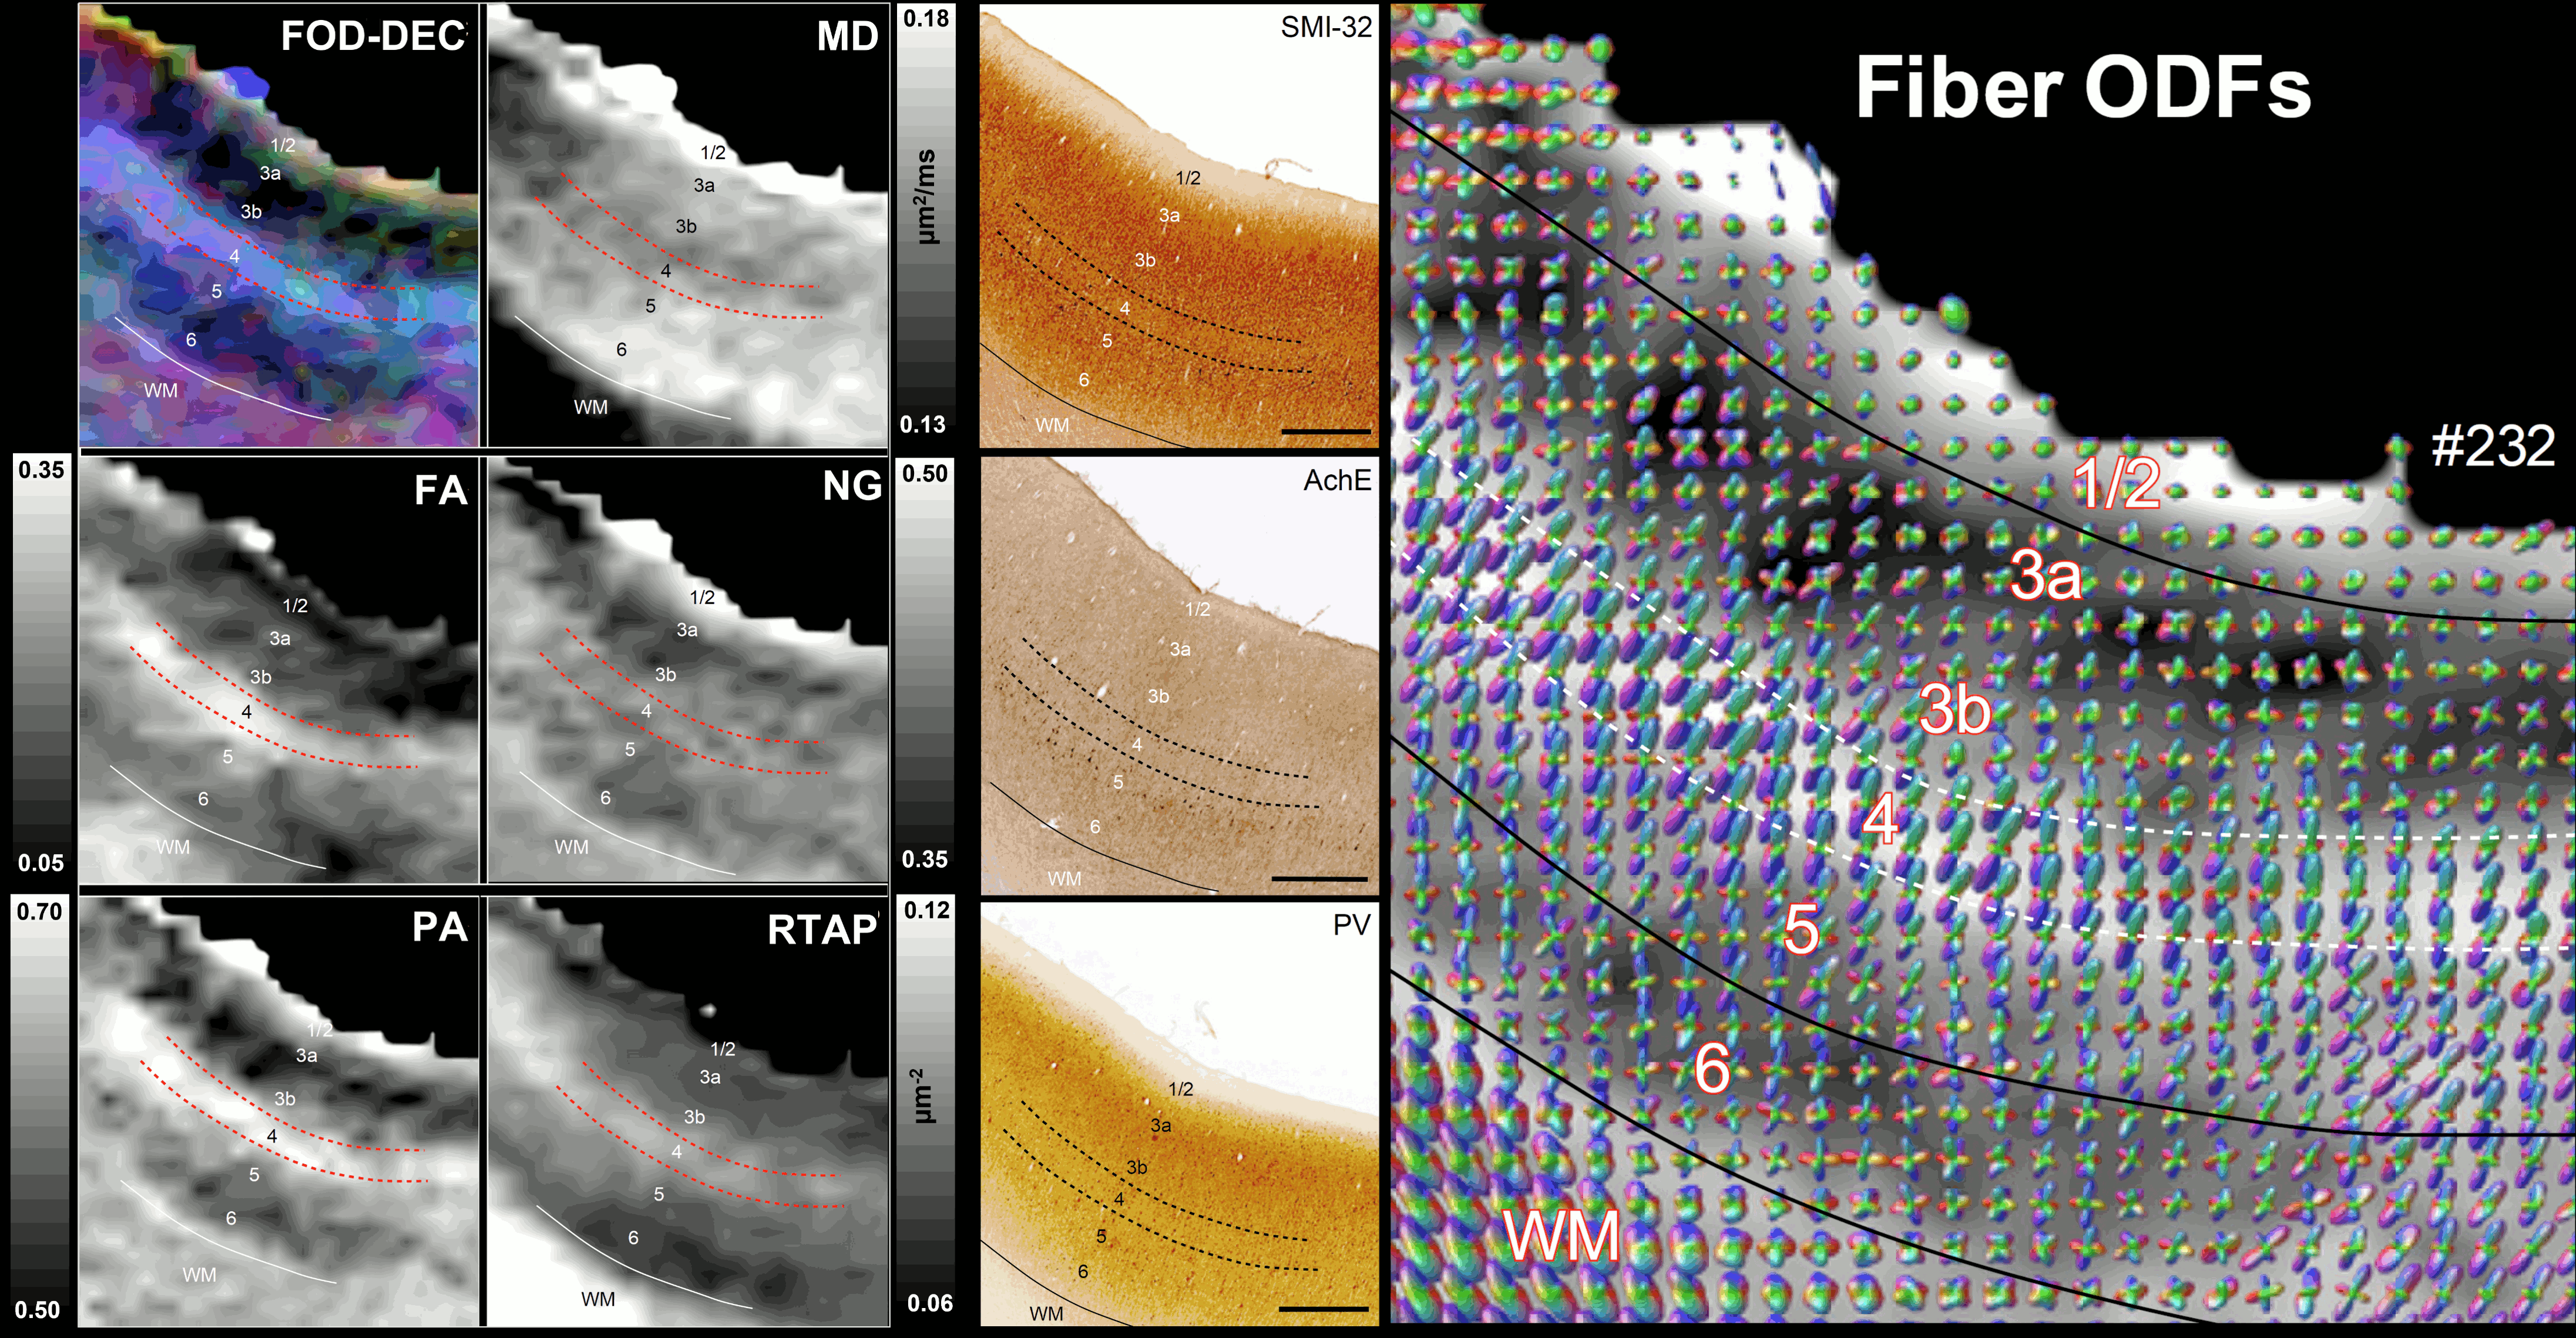
Fig. 2: The correspondence between the cortical layers in histological images (right column) and MAP parameters (left/middle columns) in the dorsal premotor area F2. Layer 4 has high diffusion anisotropy (PA and FA), making it easier to distinguish than on histological stains. The high PA is likely due to radially oriented (fODF, SMI-32) restricted diffusion processes (high RTAP). Low PA in layers 3a/3b reflects the high density of non-pyramidal neuronal cells (PV). Low RTAP and moderate PA in deep layers 5/6 suggest a mixture of radial and tangential processes. Scale bar: 1mm.