0691
Functional MRI of mice olfactory bulbs at 15.2T reveals characteristic activation patterns when stimulated by different odors1Chemical and biological physics, Weizmann institute of Science, Rehovot, Israel, 2Neurobiology, Weizmann institute of Science, Rehovot, Israel
Synopsis
Single-shot fMRI executed at ultrahigh fields can reveal valuable insight about brain function, if it successfully overcomes field inhomogeneity problems. Spatiotemporal Encoding provides a route for achieving this, enabling studies on the olfactory bulbs of mice at 15.2T. Images collected with a 125 µm in-plane resolution yielded remarkably large and well-defined responses to olfactory cues, particularly in males. These were unambiguously linked to olfaction via single-nostril experiments. The experiments highlighted specific activation regions in the external plexiform region and in glomeruli in the lateral part of the bulb, when stimulated by aversive or appetitive odors, respectively.
Introduction
Social behavior and communication in rodents, but also in other mammals, rely on olfactory cues. Mice fMRI could illuminate the brain regions involved in these. However, inherent constraints in the EPI sequences underlying fMRI –foremost among these susceptibility-derived distortions– limit the ability to tackle important regions, among them the olfactory bulb (OB). Furthermore, although the advent of high fields magnifies the BOLD signals, ultrahigh fields also compound susceptibility distortions. This study demonstrates that Spatiotemporal Encoding (SPEN) sequences [1, 2] executed at 15.2T can overcome these complications, and yield remarkably large and defined responses to olfactory cues. These activation patterns were stronger in males than females and could be unambiguously linked to olfaction via single-nostril experiments. Moreover, different activation regions were highlighted by SPEN fMRI when assaying aversive, neutral, or appetitive odors.Methods
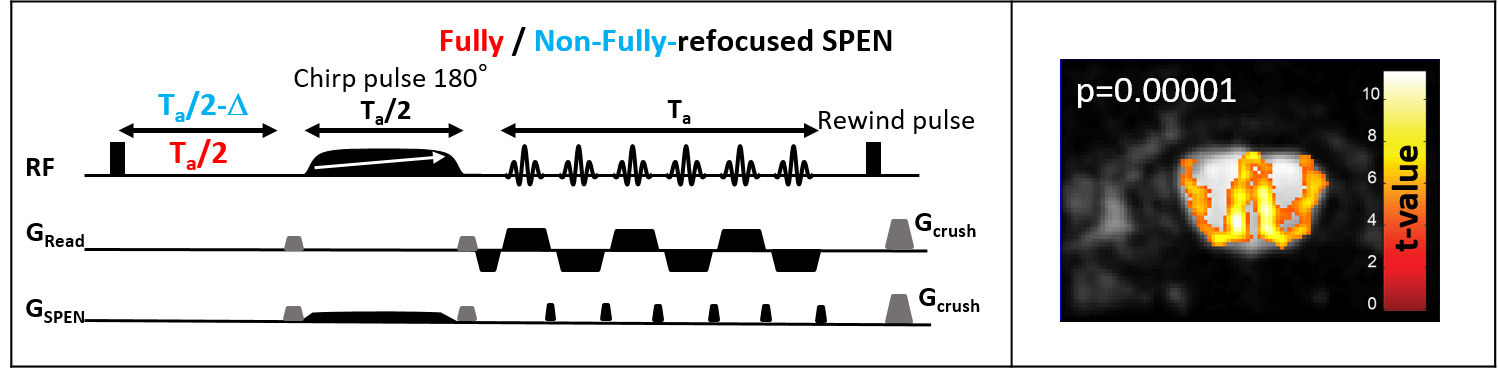
Animals and scanning conditions: 40 male and 8 female C57BL/6 adult mice were scanned with a protocol approved by a Weizmann Institute IACUC. Medical air (80% N2 and 20% O2) was used as respiratory gas, and was delivered to animals via a nosecone throughout the experiment. All mice were initially anesthetized with isoflurane (ISO) (3% for induction and 2% during set-up) and a first bolus of 0.2 mg/kg medetomidine, injected subcutaneously [3]. The animal was then secured in a prone position in a cradle, ISO was stopped, and medetomidine was continuously provided at rate of 0.6 mg/kg/h via an IV catheter. The fMRI paradigm involved different odors stimulation delivered/evacuated into the nosecone through different channels and clean tubes, using a home-built olfactometer according to the schedule (120s air - 25s odor)x10. The physiology of the animals was monitored and controlled (140±50 breaths per minute; 36±0.5 ˚C rectal temperature) throughout the study. Odor concentrations were measured with Photoionization detector PID (ppbRAE3000 system). Control experiments were performed with the same set up and block design, but without odor delivery. Additional protocols and coils were tested for optimization and quality comparison.fMRI experiments and data analysis: A 15.2T Bruker AVIII scanner equipped with a 20mm 1H quadrature transceive CryoProbe® was used for the acquisitions. Figure 1 presents the custom written 2D non-fully refocused SPEN sequence capturing T2*-weighted contrast to highlight the BOLD effect. Other parameters of the 2D fMRI sequences included TR = 1000 ms, in-plane resolution: 125x125 μm2, 0.8 mm slice thickness, single shot acquisitions, 2 averages. fMRI images were reconstructed initially in the scanner; BOLD signal changes over time were subsequently analyzed using MATLAB. fMRI activation maps were generated using SPM12.
Results
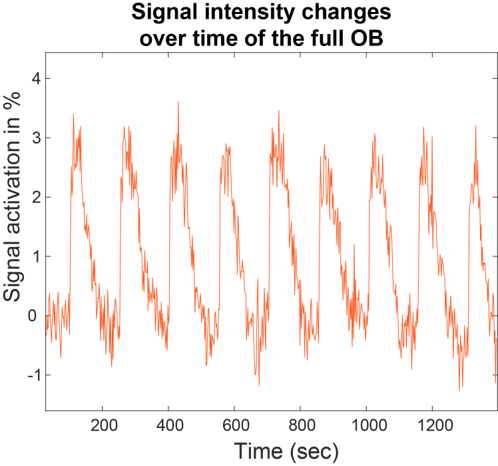
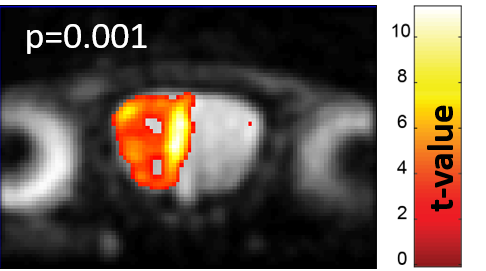
Figure 2 shows characteristic signal amplitude changes observed upon considering the full OB region as collected by 2D 15.2T SPEN images, upon applying a periodic neutral odor stimulation. Signal intensity changes of up to 10% in males and 4% in females were observed for identical stimulation paradigms.Figure 3 presents additional proof of the olfactory driven nature of these responses, with SPM activation maps arising upon sealing, respectively the left and right nostrils of a stimulated mouse: unlike what happens in humans the sense of smell in mice is bilateral, meaning that different OB regions will react to smells injected through different nostrils.
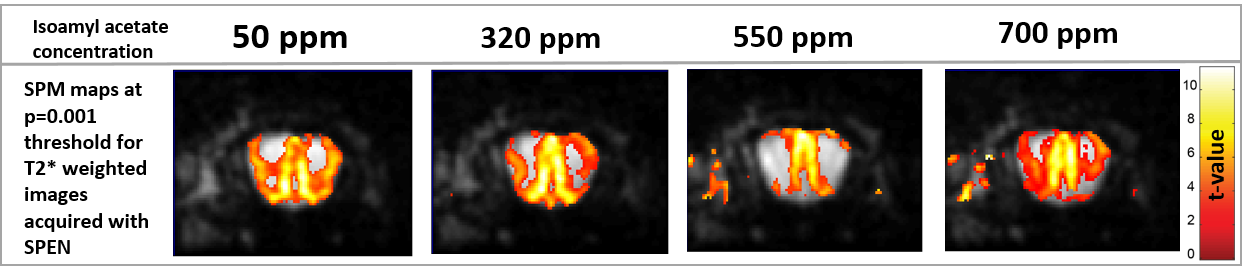
Figure 4 presents activation maps obtained at different concentrations for a neutral (isoamyl acetate) odor stimulation; it is seen that decreasing the odor concentration allows to get better-defined activation map, but – within the collected olfactory and fMRI parameters– there is nearly no dependence of the fMRI signal intensity on odor concentration.
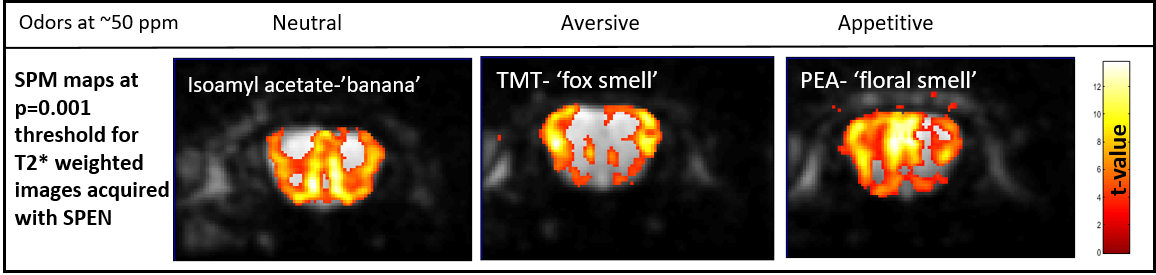
Figure 5 shows the different activations maps obtained upon stimulating OBs with identical concentrations of appetitive (palmitoylethanolamide), aversive (2,4,5-trimethyl-3-thiazoline) and neutral (isoamyl acetate) odors,[4] at a p=0.001 threshold. The patterns are clearly different, and shed light on the cells types involved in the activation mechanisms: For the appetitive (floral smell) odor the highest fMRI response is detected in the external plexiform region, for the aversive (fox, predator) odor it is the glomeruli in the lateral part of the bulb that get activated [5]. The neutral (banana smell) odor appears to elicit a superposition of the appetitive and aversive activation patterns.
Discussion and Conclusion
SPEN @15.2T delivers quality OB fMRI data, showing clear intensity differences upon cycling between air flow and odor stimulation. These changes are visible without any statistical treatment; no such signal changes were detected in control acquisitions, while different OB hemispheres could be stimulated by single-nostril experiments, confirming their connection to specific odor stimulation. The spatial and temporal resolutions allowed us to clearly distinguish and attribute the nature of the activated cells under different stimuli. This can help understand how chemosensory signals are transferred into the olfactory epithelium and into other circuits in the brain, is response to different odors and pheromones.Acknowledgements
We are grateful to Drs. Maxime Yon, Luisa Ciobanu and Tangi Roussel for valuable discussions, and to Aharon Weissbrod for technical help. Support from the Minerva Foundation (Germany), the Israel Science Foundation, and the Clore Institute for High Field Magnetic Resonance Imaging and Spectroscopy (Weizmann Institute), are acknowledged.References
[1] Tal A, Frydman L. Single-scan multidimensional magnetic resonance. Progress in Nuclear Magnetic Resonance Spectroscopy 2010; 57: 241–292.
[2] Schmidt R, Seginer A, Frydman L. Interleaved multishot imaging by spatiotemporal encoding: A fast, self-referenced method for high-definition diffusion and functional MRI. Magn Reson Med 2016; 75: 1935–1948.
[3] Zhao F, Meng X, Lu S, et al. fMRI study of olfactory processing in mice under three anesthesia protocols: Insight into the effect of ketamine on olfactory processing. Neuroimage 2020; 213: 116725.
[4] Root CM, Denny CA, Hen R, et al. The participation of cortical amygdala in innate, odor-driven behavior. Nature 2014; 515: 269.
[5] Keith F, Paxinos G. Paxinos and Franklin’s the Mouse Brain in Stereotaxic Coordinates. 3rd ed. Academic press New York, 2008.Figures