0688
On the Reliability of Connectome Harmonic Decompositions of Human Brain Structure and Function1Department of Psychiatry and Behavioral Sciences, Johns Hopkins University, Baltimore, MD, United States, 2Department of Radiology and BRIC, University of North Carolina, Chapel Hill, NC, United States, 3F.M. Kirby Research Center, Kennedy Krieger Institute, Baltimore, MD, United States, 4Department of Radiology, Johns Hopkins University, Baltimore, MD, United States
Synopsis
The connectome harmonic decomposition provides a principled approach to dimensionality reduction of human brain functional data using the eigenmodes of the graph Laplacian derived from the anatomical connectome. In the present report, test-retest data from the Human Connectome Project are used to assess the reliability of the structural harmonics, and of decompositions of resting-state functional MRI data using these harmonics. For both structure and function, reliability was higher within than between subjects, and decreased with harmonic rank.
Introduction
The connectome harmonic decomposition provides a principled approach to dimensionality reduction of human brain structure and function, using a basis set derived from brain anatomy1. In analogy to classical physics approaches to vibration modes, the anatomical connectome is used to derive a graph Laplacian, the eigenmodes of which are used as a basis set for the representation of brain activity. Since its introduction, this approach has been applied to changes in brain activity induced by psychedelic compounds2. However, no information is available on the within- or between-subject reliability of structural connectome harmonics, or on the reliability of connectome harmonic decompositions of brain activity. Accordingly, the current report uses a publicly available test/re-test data set to assess reliability of structural harmonics, and of the RMS activity of functional data analyzed using these harmonics.Methods
Minimally preprocessed data from 41 individuals in the test/re-test dataset of the Human Connectome Project (n=45 with two diffusion and T1-weighted acquisitions) were analyzed. Four subjects were excluded due to missing data3. Structural connectomes for each participant and session were estimated by combining a smoothed long-range connectivity matrix with a local connectivity matrix.The long-range connectivity matrix was defined as a graph on the HCP FS_LR_32k surface mesh. A fiber orientation distribution (FOD) for each preprocessed diffusion image was calculated using an estimated response function via the dhollander algorithm4 in MRtrix3 5. 10 million streamlines were generated using the iFOD2 probabilistic tractography algorithm (maximum streamline length = 250 mm, power = 0.33). Seeding and termination of tracks was constrained to the white matter/gray matter interface as defined by FreeSurfer segmentation.
The endpoints of each streamline were extracted; only streamlines with endpoints within a 2mm radius of their nearest surface vertex were retained. Retained endpoints were associated with their nearest neighboring surface vertex, using two incidence matrices: for starting and terminating endpoints, respectively. We then performed gaussian smoothing (with respect to geodesic distance on the cortical surface) on the connectivity at each vertex in the long-range connectivity matrix. Gaussian smoothing kernels have been shown to improve reproducibility of vertex-wise diffusion data derived structural connectomes6.
The local connectivity matrix was a binary graph created by setting to identity all neighboring vertices around each vertex. We found the union of the smoothed long-range connectivity matrix, described above, with this local connectivity matrix encoded within the FS_LR_32k surface. The resulting structural connectome is a 59,412-order binary, sparse adjacency matrix, excluding all vertices in the medial wall of each surface that are not represented in surface-mapped HCP timeseries. The first 100 eigenmodes of the graph Laplacian of this matrix were then estimated; the first (trivial) eigenmode was discarded, leaving 99 for subsequent analysis. To yield a measure of the reliability of connectome harmonics, we calculated the absolute value of the Pearson product moment correlation for the spatial distributions of each eigenmode between test and re-test sessions. Fisher-transformed correlations were averaged across subjects, and compared to the average spatial correlation of each eigenmode between the test session for a given participant and test sessions for all other participants, for the best-matching eigenmodes (i.e. the two eigenmodes with the highest correlation). Minimally-preprocessed functional data for 38 HCP subjects during REST1 and REST2 scans (7 subjects excluded due to missing data) were normalized and projected onto eigenmodes; the Pearson correlation between the RMS activity of functional data from test and re-test sessions for each eigenmode was calculated within and between subjects.
Results
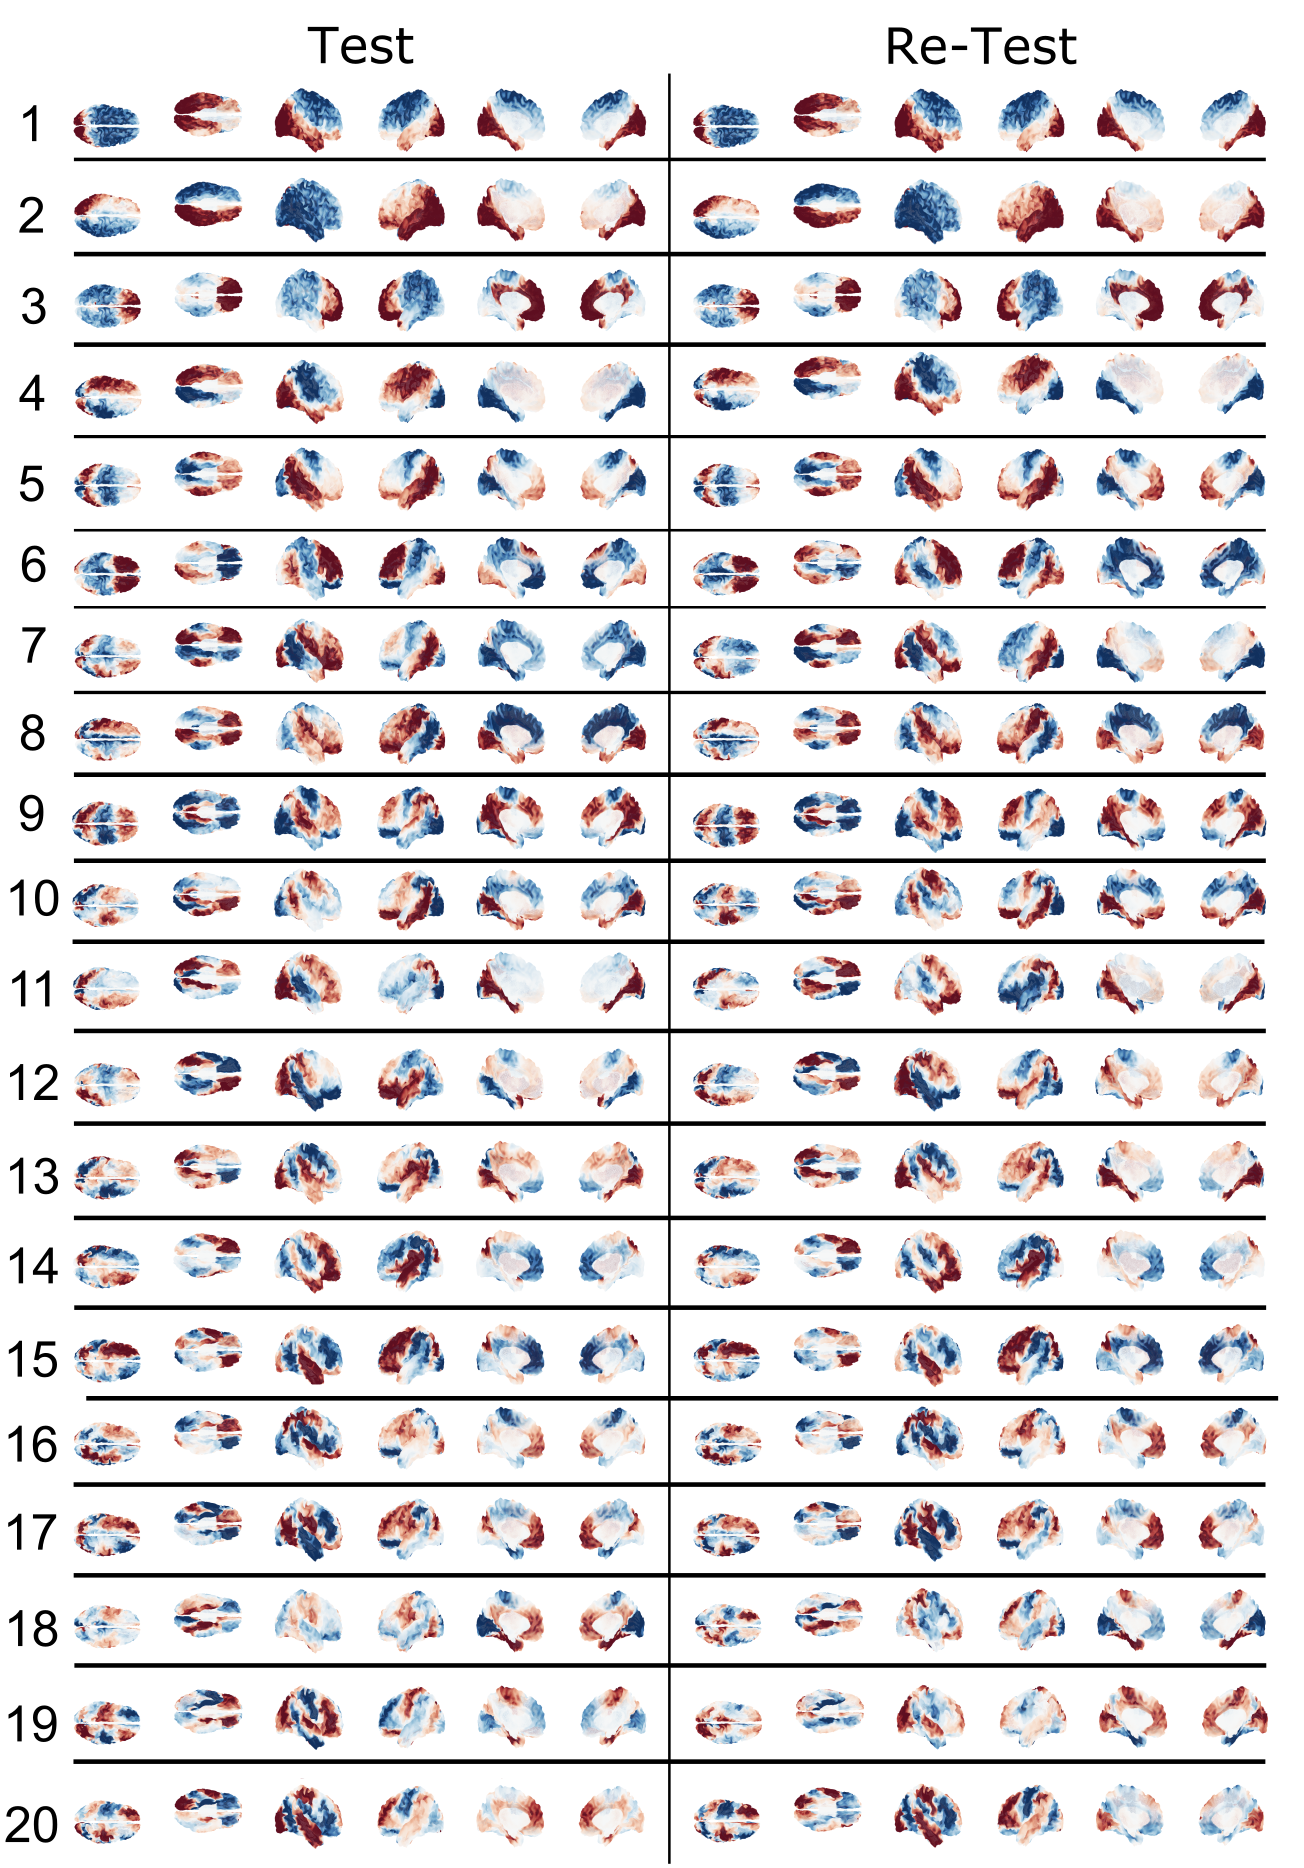
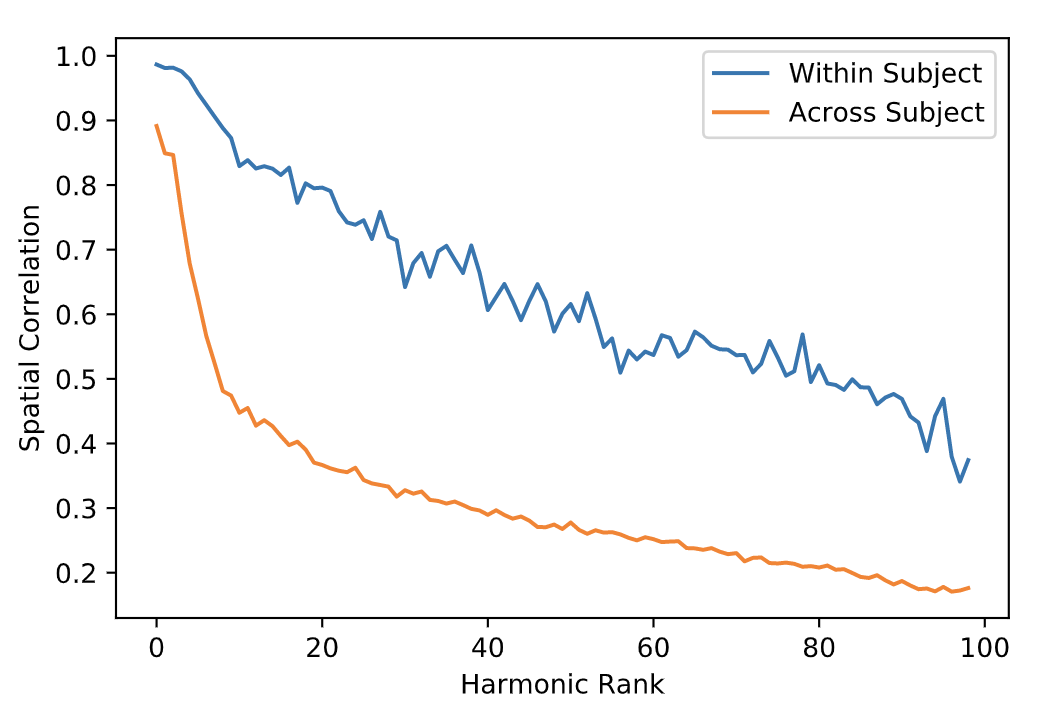
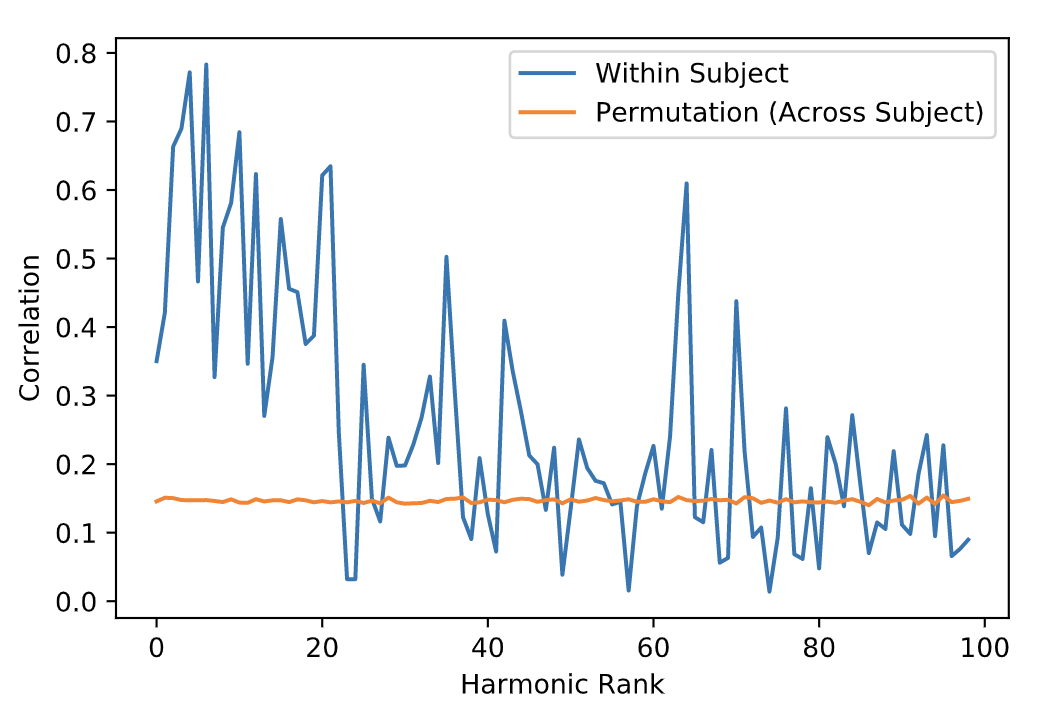
The average test/re-test reliability of the spatial distribution (Figure 1) of structural connectome harmonics was higher within-subject (r = 0.64) than between-subjects (r = 0.31; Figure 2). The average test/re-test reliability of the RMS activity of each harmonic was higher within-subject (r = 0.51 for harmonics 0-20, r = 0.19 for harmonics 21-99) than between-subjects (r = 0.14; Figure 3). Both within- and between-subject reliability of the spatial distribution and activity of connectome harmonics was greater for lower harmonics than for higher harmonics (Figures 2 and 3).Discussion
Relatively high within-subject reliability of the spatial distribution and activity of lower order harmonics, with decreasing reliability of higher order harmonics, was consistent with variance increasing with spatial frequency, which increases with harmonic rank. The lowest harmonic ranks (e.g., 1-5) appeared highly consistent across subjects, suggesting group-level stability of large-scale brain structure. Variability observed between individuals at middle-order ranks (e.g., 6-20) may be due to individual variability in brain structure. Variability observed at higher orders may be a function of noise, measurement error, or true biological variability.Conclusion
Low-to-middle-order connectome harmonics represent a rigorous and reproducible basis function, derived from brain structure, that shows within-subject reliability and between-subject variation. These features may facilitate principled study of individual differences in both structure and function of the human brain, which is necessary for such aspirational goals as precision medicine applications in human cognitive neuroscience. Future investigations may determine whether variance in higher-order connectome harmonics represents noise or signal.Acknowledgements
Support for this study was provided by a gift to establish the Center for Psychedelic and Consciousness Research from the Steven and Alexandra Cohen Foundation, Tim Ferriss, Blake Mycoskie, Matt Mullenweg, and Craig Nerenberg. Support for this study was provided by the USA National Institutes of Health, under grants NIH 2R01EB008374-09 (P.-T. Yap), NIH 1R01MH125479-01 (P.-T. Yap), NIH 1P50HD103538-01 (B.L. Schlaggar), & NIH 1P41EB031771-01 (P.C.M. van Zijl). The funders had no role in study design, data collection and analysis, decision to publish, or preparation of this report.References
1. Atasoy S, Donnelly I, Pearson J. Human brain networks function in connectome-specific harmonic waves. Nat Commun 2016;7(1):10340.
2. Atasoy S, Roseman L, Kaelen M, Kringelbach ML, Deco G, Carhart-Harris RL. Connectome-harmonic decomposition of human brain activity reveals dynamical repertoire re-organization under LSD. Sci Rep 2017;7(1):17661.
3. Glasser MF, Sotiropoulos SN, Wilson JA, et al. The minimal preprocessing pipelines for the Human Connectome Project. NeuroImage 2013;80:105–24.
4. Dhollander T, Raffelt D, Connelly A. Unsupervised 3-tissue response function estimation from single-shell or multi-shell diffusion MR data without a co-registered T1 image. ISMRM Workshop on Breaking the Barriers of Diffusion MRI, 2016.
5. Tournier J-D, Smith R, Raffelt D, et al. MRtrix3: A fast, flexible and open software framework for medical image processing and visualisation. NeuroImage 2019;202:116137.
6. Besson P, Lopes R, Leclerc X, Derambure P, Tyvaert L. Intra-subject reliability of the high-resolution whole-brain structural connectome. NeuroImage 2014;102:283–93.
Figures