0682
Simulated fMRI responses using human Vascular Anatomical Network models with varying architecture and dynamics1Athinoula A. Martinos Center for Biomedical Imaging, Massachusetts General Hospital, Charlestown, MA, United States, 2Department of Radiology, Harvard Medical School, Boston, MA, United States, 3Division of Health Sciences and Technology, Massachusetts Institute of Technology, Cambridge, MA, United States
Synopsis
We utilized a synthesis algorithm to generate a vascular anatomical network model for the human cortex to act as a basis for biophysical simulations of the fMRI response. We identified key features of the vascular topology needed to generate realistic BOLD responses with this model. We used this model to show how parametric variations in vascular architecture affect the BOLD responses across cortical depths. Finally we investigated approaches to translate arteriolar dilation patterns recorded from the mouse cortex to our human model and found that they may not be capable of capturing the distinct hemodynamic response observed in human fMRI data.
Introduction
All functional MRI (fMRI) signals reflect changes in blood flow, volume, and oxygenation that occur alongside neural activity. Much of what we know about how to interpret the fMRI signals comes from invasive measurements in small animal models, typically the mouse somatosensory cortex1–5. These data provided the basis for a recently proposed biophysical simulation framework using realistic Vascular Anatomical Network (VAN) models reconstructed from microscopy data to provide insights into how unobservable microvascular changes manifest as observed blood oxygenation level dependent (BOLD) fMRI responses6–8. While these models have successfully predicted subtle features of BOLD responses measured in humans, the full extent to which mouse models capture the hemodynamic response in humans remains unclear. Differences in vascular architecture between humans and mice, such as the density of diving arteries (DAs) and ascending veins (AVs), may contribute to distinct hemodynamic features in humans9,10. Additionally, the size of the human cortex is much larger than mouse and likely to exhibit different vascular response timing. Despite apparent differences in microvascular structure, the underlying vascular control mechanisms are apparently able to generate roughly similar BOLD responses across species10. To date, the VAN modeling framework has not been used to probe these questions as a human VAN model is not available and scaling up biophysical simulations to the scale of a human VAN presents substantial practical challenges. Here we have synthesized the first human VAN using an algorithm that creates realistic VANs based on published topological and anatomical data11,12 which was integrated into a novel simulation framework that uses a voxel-based mesh to predict blood flow, volume, oxygenation, and finally the BOLD responses13,14. Because recordings for human are not readily available, we used recordings of single-vessel arterial dilations from the mouse15 to investigate whether a simple adaptation of these measurements can produce plausible human BOLD responses. This adaptation represents our null hypothesis that arterial responses in the mouse cortex are similar to those in humans.Methods
We used arterial dilation measurements15 and passive compliant “ballooning” in capillaries/veins16 to predict the blood volume and flow responses. We expanded a state-of-the-art simulation to predict oxygenation responses13 and a finite perturbation method to predict the gradient-echo BOLD response6,14. The synthetic VANs (sVANs) were generated by extending an existing synthesis algorithm11,12. Our first series of sVANs mimicked the geometry and topology of reconstructed VANs to compare the blood flow, oxygenation, and BOLD responses. These synthetic VANs allow for parametric variation of the vascular architecture as demonstrated by our investigation into the effect of capillary density on BOLD by synthesizing VANs with dense capillary beds at varying cortical depths. We further generated a human sVAN using data from the literature17–19. BOLD responses from the human sVAN were simulated using dilation traces (i) directly from mouse and (ii) scaled to the human cortex, with the same upstream signal velocity as mouse but when applied to the larger human cortex led to a longer delay between the deepest and superficial layers.Results
While the differing DA:AV ratio between mice and humans is well known, synthesizing a human VAN with the appropriate ratio is insufficient to elicit adequate hemodynamic responses. The number of branches stemming from each DA is equally important, which affects the flow control available to the DA as explained in Figure 1. In order to generate VANs with realistic BOLD responses as shown in Figure 3, we imposed minimum arterial branching (or "”MAB” as shown in Figure 1, A) as observed in mice2,4 and humans18. Additionally, by varying the vessel depths as in Figure 3, we observed a variation in BOLD response amplitude that tracks the capillary density. After incorporating the structural properties of a human onto an sVAN, we validated the arterial control by producing a realistic BOLD response using mouse dilation curves (Figure 4). We noticed that the human sVAN BOLD response using mouse dilation traces was too fast, and by scaling the dilation to the depth of the human cortex we could more closely model the slower time course of the human BOLD response as observed in Figure 5.Discussion
We have proposed a human-sized VAN for fMRI simulations. We have also demonstrated that unexpected vascular anatomical features, such as the number of DA branches, are key to providing the arterioles with sufficient control to elicit robust hemodynamic and BOLD responses. Additionally, this synthesis method can be adapted to generate VANs corresponding to different cortical areas with distinct microvascular architecture which may affect the spatial patterns of the BOLD response, as we demonstrated by varying capillary depths. Because single-vessel dilation data in human are not available, we tested the simplest translation of mouse dilation data to humans and found that, while it does generate a reasonable BOLD response resembling the mouse, it is insufficient to reproduce the slower response observed in humans, suggesting the need for more sophisticated models of coordinated arteriolar dilation in humans for more accurate BOLD responses.Acknowledgements
This work was supported in part by the NIH NIBIB (grant P41-EB030006 and R01-EB019437), the BRAIN Initiative (NIH NIMH grants R01-MH111419, R01-MH111438, and F32-MH125599), the MGH/HST Athinoula A. Martinos Center for Biomedical Imaging; and the resources provided by the NIH Shared Instrumentation Grant S10-RR023043.
References
1. Schmid, F., Barrett, M. J. P., Jenny, P. & Weber, B. Vascular density and distribution in neocortex. NeuroImage (2017) doi:10.1016/j.neuroimage.2017.06.046.
2. Blinder, P. et al. The cortical angiome: an interconnected vascular network with noncolumnar patterns of blood flow. Nat. Neurosci. 16, 889–897 (2013).
3. Mihelic, S. et al. Segmentation-less, automated vascular vectorization robustly extracts neurovascular network statistics from in vivo two-photon images. bioRxiv (2020).
4. Fang, Q. et al. Oxygen Advection and Diffusion in a Three Dimensional Vascular Anatomical Network. Opt. Express 16, 17530–17541 (2008).
5. Smith, A. F. et al. Brain capillary networks across species: a few simple organizational requirements are sufficient to reproduce both structure and function. Front. Physiol. 10, 233 (2019).
6. Gagnon, L. et al. Quantifying the Microvascular Origin of BOLD-fMRI from First Principles with Two-Photon Microscopy and an Oxygen-Sensitive Nanoprobe. J. Neurosci. 35, 3663–3675 (2015).
7. Gagnon, L. et al. Modeling of Cerebral Oxygen Transport Based on In vivo Microscopic Imaging of Microvascular Network Structure, Blood Flow, and Oxygenation. Front. Comput. Neurosci. 10, (2016).
8. Gagnon, L. et al. Validation and optimization of hypercapnic-calibrated fMRI from oxygen-sensitive two-photon microscopy. Philos. Trans. R. Soc. B Biol. Sci. 371, 20150359 (2016).
9. Hartung, G., Pfannmoeller, J., Berman, A. & Polimeni, J. Hemodynamic simulations reveal changes in ascending venules leads to enhanced venous CBV response to arterial dilation. ISMRM Annu. Conf. (2021).
10. Lambers, H. et al. A cortical rat hemodynamic response function for improved detection of BOLD activation under common experimental conditions. Neuroimage 208, 116446 (2020).
11. Linninger, A., Hartung, G., Badr, S. & Morley, R. Mathematical synthesis of the cortical circulation for the whole mouse brain-part I: theory and image integration. Comput. Biol. Med. (2019).
12. Linninger, A., Hartung, G., Badr, S. & Morley, R. Mathematical synthesis of the cortical circulation for the whole mouse brain-part I: theory and image integration. Comput. Biol. Med. (2019).
13. Hartung, G. et al. Voxelized simulation of cerebral oxygen perfusion elucidates hypoxia in aged mouse cortex. PLoS Comput. Biol. 17, e1008584 (2021).
14. Pathak, A. P., Ward, B. D. & Schmainda, K. M. A novel technique for modeling susceptibility-based contrast mechanisms for arbitrary microvascular geometries: the finite perturber method. Neuroimage 40, 1130–1143 (2008).
15. Uhlirova, H. et al. Cell type specificity of neurovascular coupling in cerebral cortex. Elife 5, e14315 (2016).
16. Boas, D. A., Jones, S. R., Devor, A., Huppert, T. J. & Dale, A. M. A vascular anatomical network model of the spatio-temporal response to brain activation. NeuroImage 40, 1116–1129 (2008).
17. Cassot, F., Lauwers, F., Fouard, C., Prohaska, S. & Lauwers‐Cances, V. A Novel Three-Dimensional Computer-Assisted Method for a Quantitative Study of Microvascular Networks of the Human Cerebral Cortex. Microcirculation 13, 1–18 (2006).
18. Cassot, F. et al. Branching patterns for arterioles and venules of the human cerebral cortex. Brain Res. 1313, 62–78 (2010).
19. Lauwers, F., Cassot, F., Lauwers-Cances, V., Puwanarajah, P. & Duvernoy, H. Morphometry of the human cerebral cortex microcirculation: General characteristics and space-related profiles. NeuroImage 39, 936–948 (2008).
20. Báez-Yáñez, M. G., Siero, J. & Petridou, N. Investigation of the dynamic fingerprint of the BOLD fMRI signal based on a novel statistical 3D cortical vascular network of the human brain.
21. Tsai, P. S. et al. Correlations of Neuronal and Microvascular Densities in Murine Cortex Revealed by Direct Counting and Colocalization of Nuclei and Vessels. J. Neurosci. 29, 14553–14570 (2009).
Figures
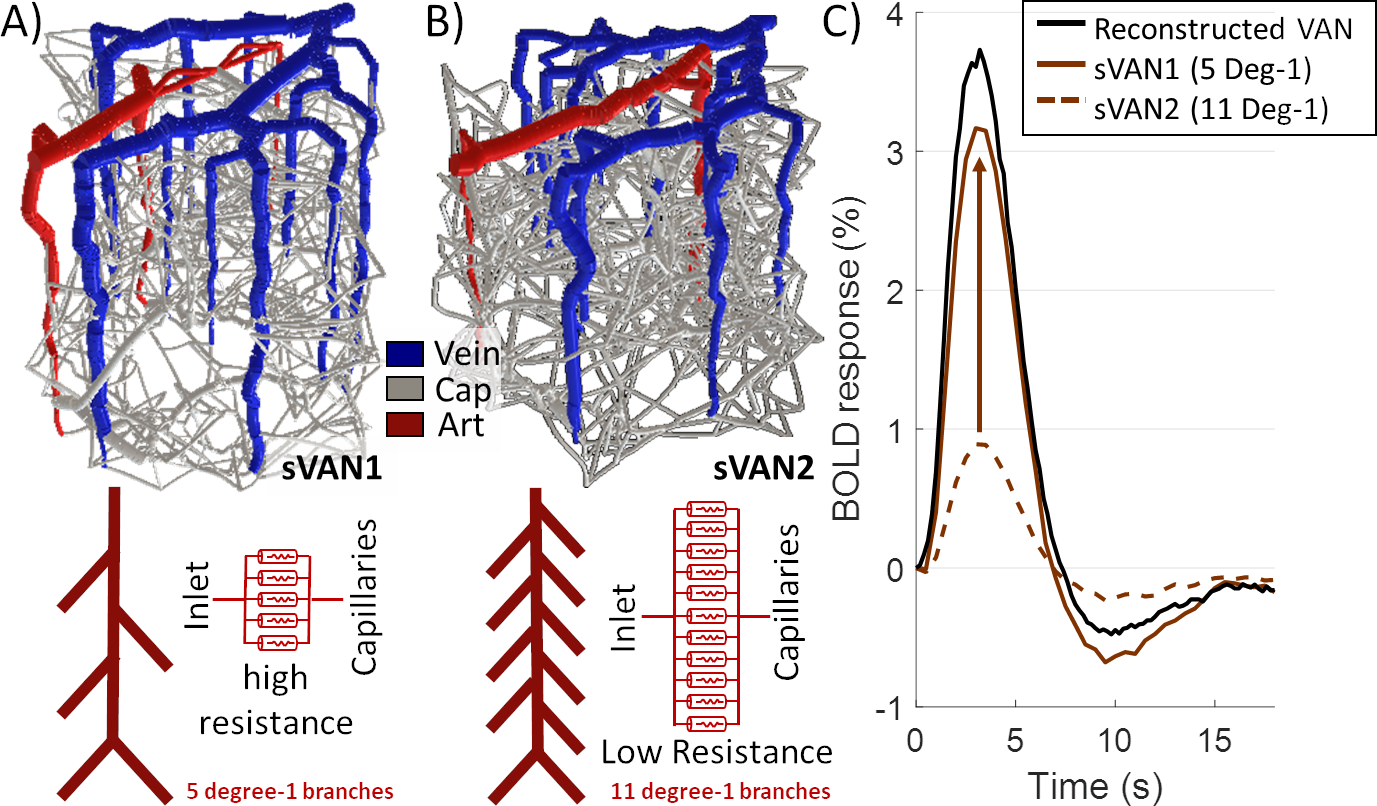
| Figure 1. The impact of different levels of arterial branching (MAB control). A) sVAN1 exhibits a normal level of flow control compared to (B) sVAN2 (reduced control). (C) The BOLD responses reflect the impact MAB control has on flow and oxygen response to arterial dilation. The dashed brown line corresponds to reduced MAB and reflects a smaller amplitude while the solid brown line reflects normal MAB control and an appreciable response magnitude. The black line is the BOLD response from a reconstructed mouse VAN for reference. |
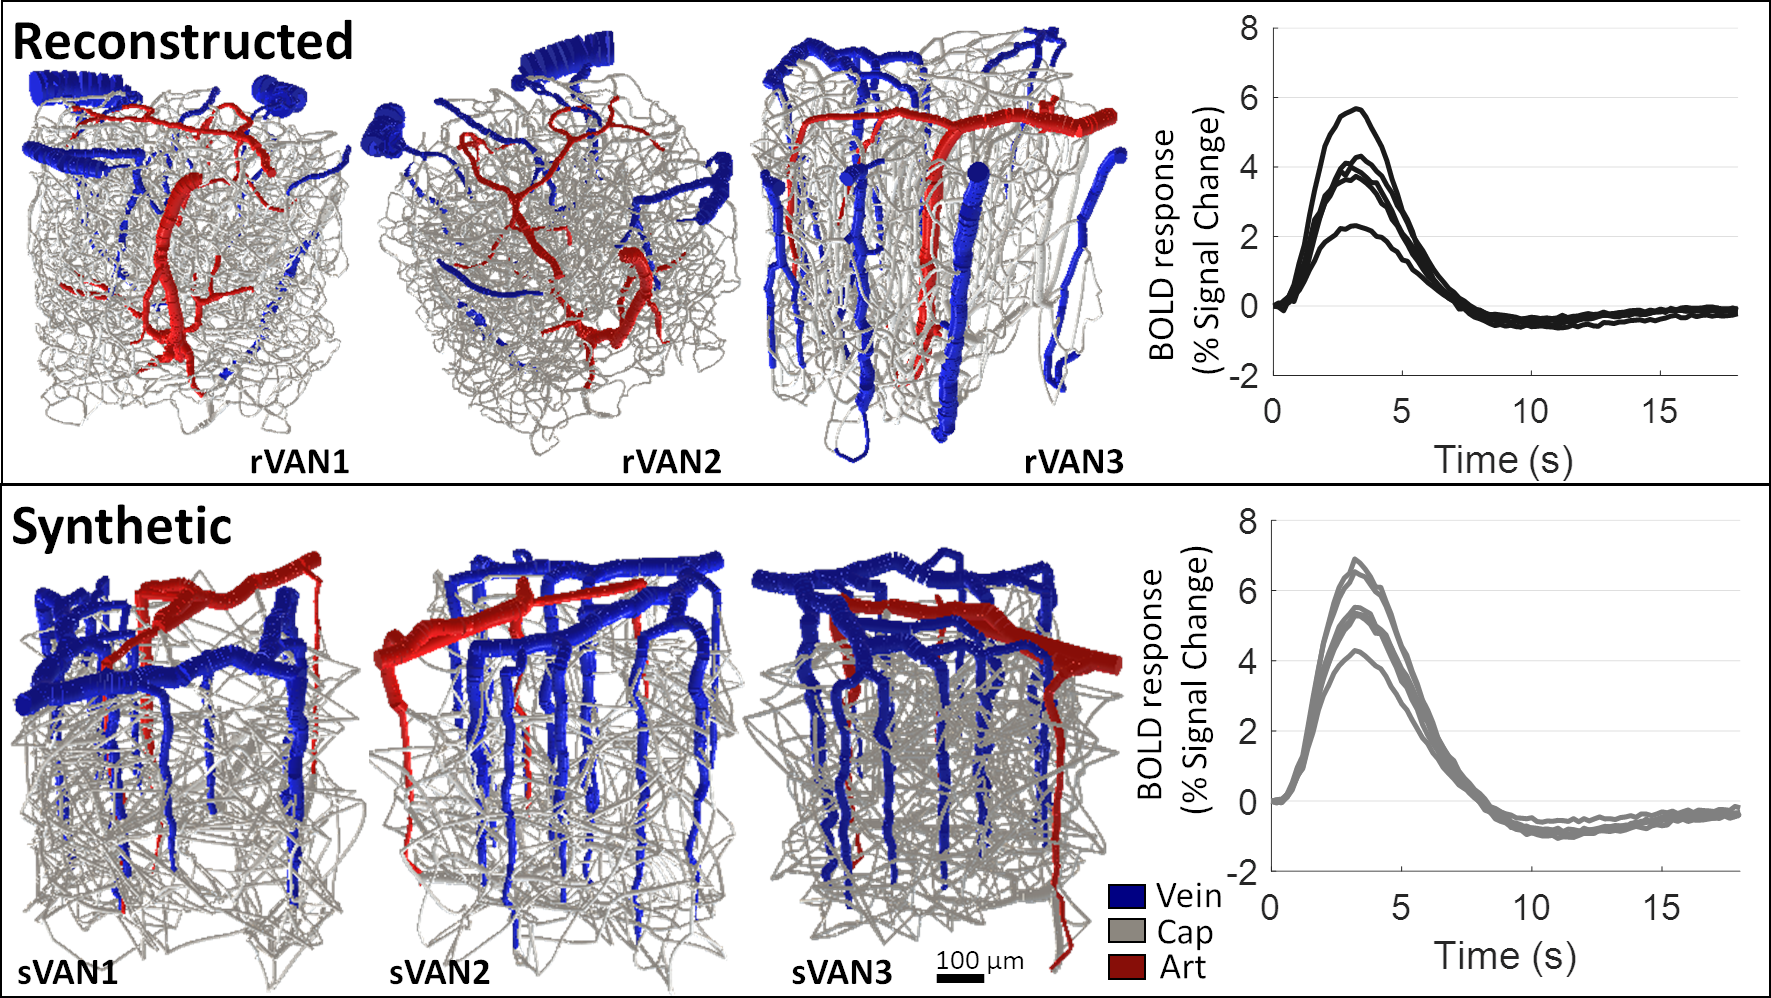
| Figure 2. Comparison of BOLD time-courses generated from reconstructed VANs and matching synthetic VANs. Three examples from each are shown using 3D rendering. The similarity between the BOLD response amplitude and duration from six reconstructed VANs and six matching synthetic VANs shows reasonable agreement. |
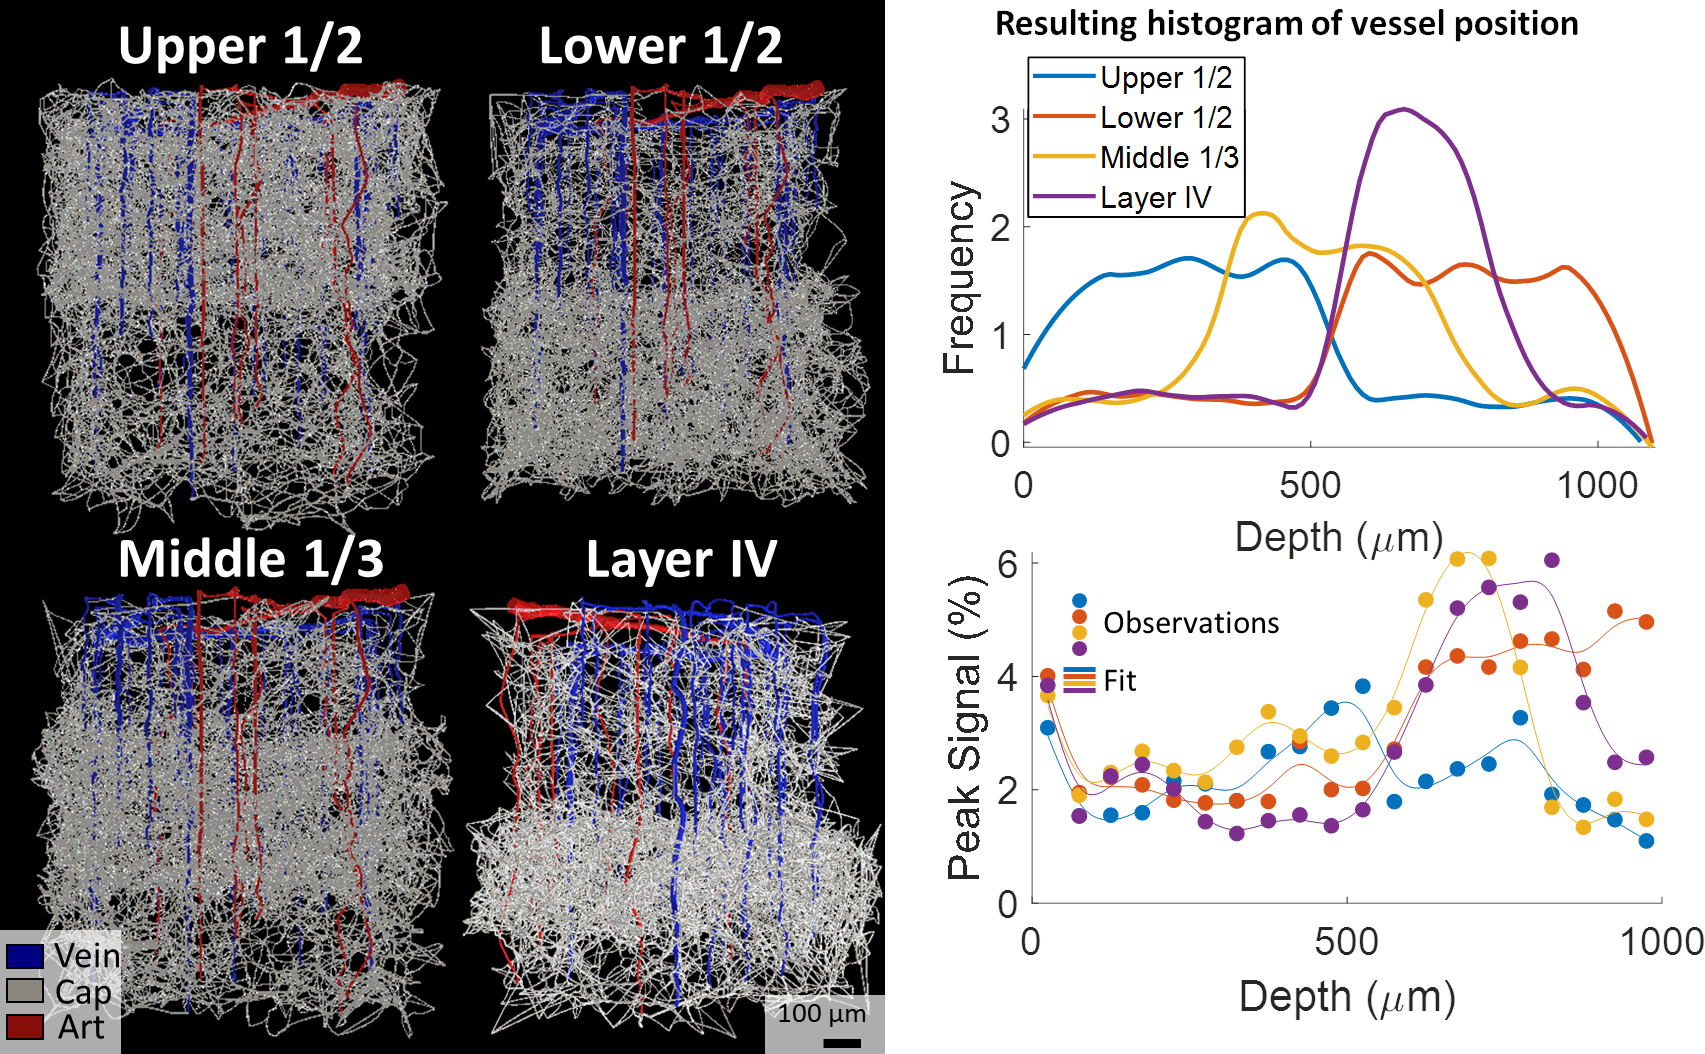
| Figure 3. BOLD responses simulated from VANs with capillary beds varying across cortical depth. We created four sVANs where half of the capillaries are confined to a limited space: the upper half of the cortex, lower half, middle third, and the approximate depth of “Layer IV”. We observed an increased BOLD response at the cortical depths corresponding to higher capillary density in three of four cases. We note the deeper layers are less oxygenated at baseline, causing a stronger influence of capillary density on the BOLD response than in superficial layers. |
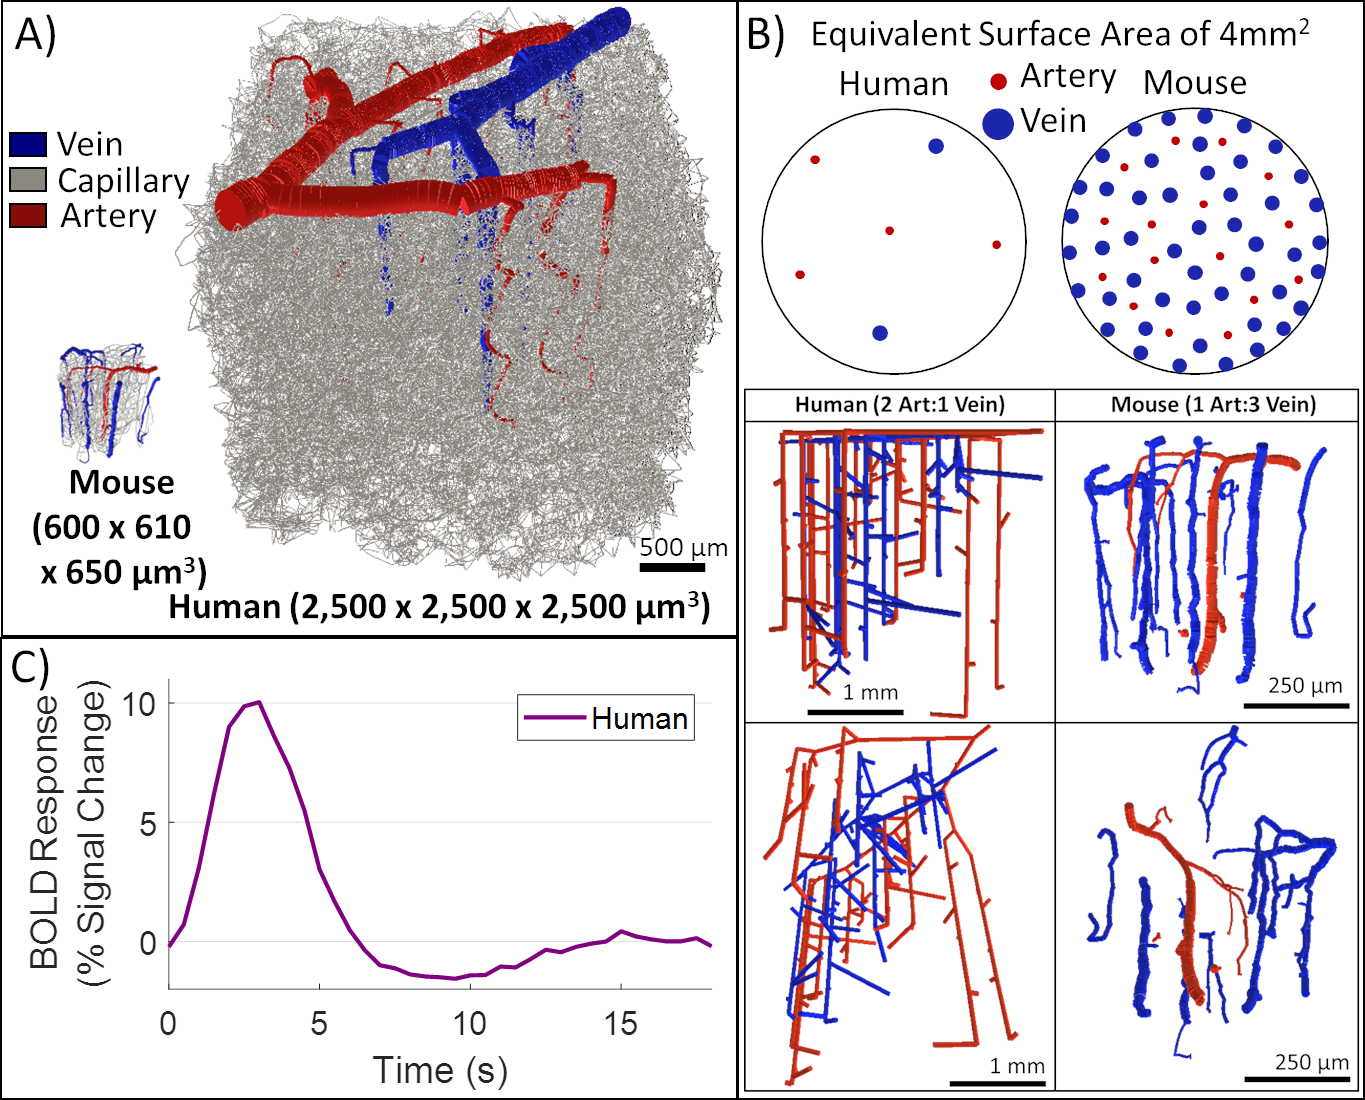
| Figure 4. Human VAN model successfully produces a realistic BOLD response. While the human VAN is much bigger (as seen in A), it also has a reduced number of penetrator vessel density for DAs and AVs alike, accompanied by a change in the DA:AV ratio from 1:3 (in mouse) to 2:1 (in human), as shown in B. C) Despite these differences, MAB control maintains a realistic BOLD response when a simple arterial dilation is applied to the human VAN. |
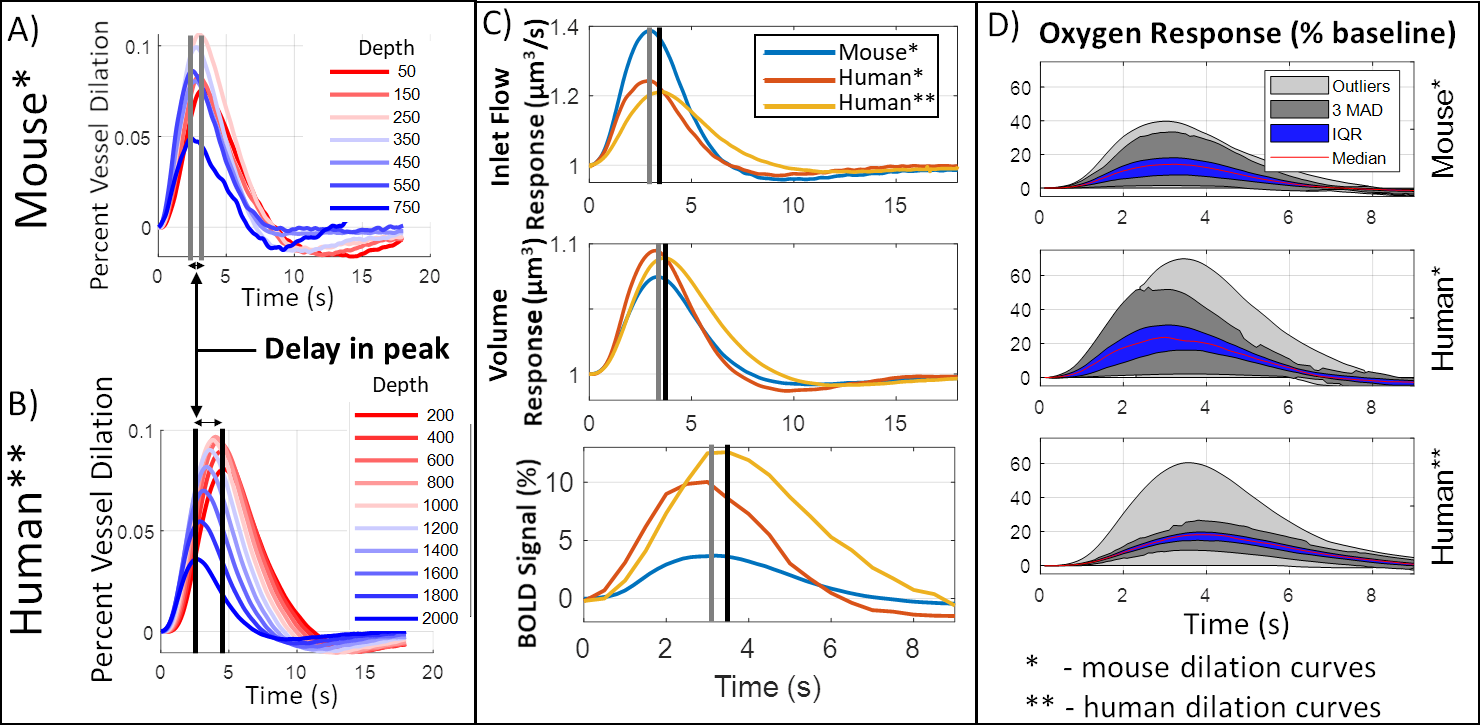
| Figure 5. Comparison of human VAN responses. We compared (A) measured dilation from mouse to (B) a dilation scaled to account for the larger thickness of the human cortex, increasing the delay in peak dilation between the deepest layers and the superficial layers. (C) The resulting inlet flow, volume, and BOLD responses are slower when using scaled dilation curves. We also show the mouse responses for comparison. (D) While oxygenation responses are larger for human, the scaled dilation curves cause a more uniform oxygen response (more narrow IQR and MAD bands in D). |