0680
Assessing tumour haemodynamic heterogeneity and response to choline kinase inhibition using DCE-MRI in rodent models of glioblastoma1Centre for Preclinical Imaging, University of Liverpool, Liverpool, United Kingdom, 2Division of Radiotherapy and Imaging, Institute of Cancer Research, London, United Kingdom, 3Department of Radiology, University of Pennsylvania, Philadelphia, PA, United States, 4Department of Radiology, Weill Cornell Medical College, New York, NY, United States
Synopsis
This study was designed to monitor changes in DCE-MRI based parameters Ktrans, ve, τi and Fp in pre-clinical GBM models in response to choline kinase inhibition using a cluster analysis approach. The study demonstrates that region-based clustered pharmacokinetic parameters obtained using DCE-MRI can be used for detecting and assessing tumour heterogeneities which may be useful in assessing therapeutic response.
Introduction
The DCE-MRI based parameters $$$ K^{trans}$$$ reflecting intra-tumoral microvascular permeability and $$$v_e$$$, extracellular space volume fraction, have significant correlation with different grades of glioma1. The mean intracellular water lifetime ($$$τ_i$$$, measured in sec), has been suggested to be a marker of cellular energy turnover2. Plasma flow ($$$F_p$$$, measured in ml/100g/min) correlates with tumour oxygenation3. As, the degree of tumour heterogeneity is associated with high morbidity, mortality, and recurrence rates4, an accurate assessment of tumour haemodynamic heterogeneity is critical for understanding the mechanisms of treatment response or resistance. Increased choline kinase (ChoK) expression is a hallmark of cancer5, thus inhibition of ChoK may help in making GBMs more sensitive for chemotherapy and radiotherapy6. JAS239 inhibits ChoK intracellularly preventing choline phosphorylation and has been shown to induce tumour growth arrest and cell death in breast cancer models7. This study was designed to monitor changes in these haemodynamic parameters in response to JAS239 treatment in preclinical glioblastoma models.Materials and Methods
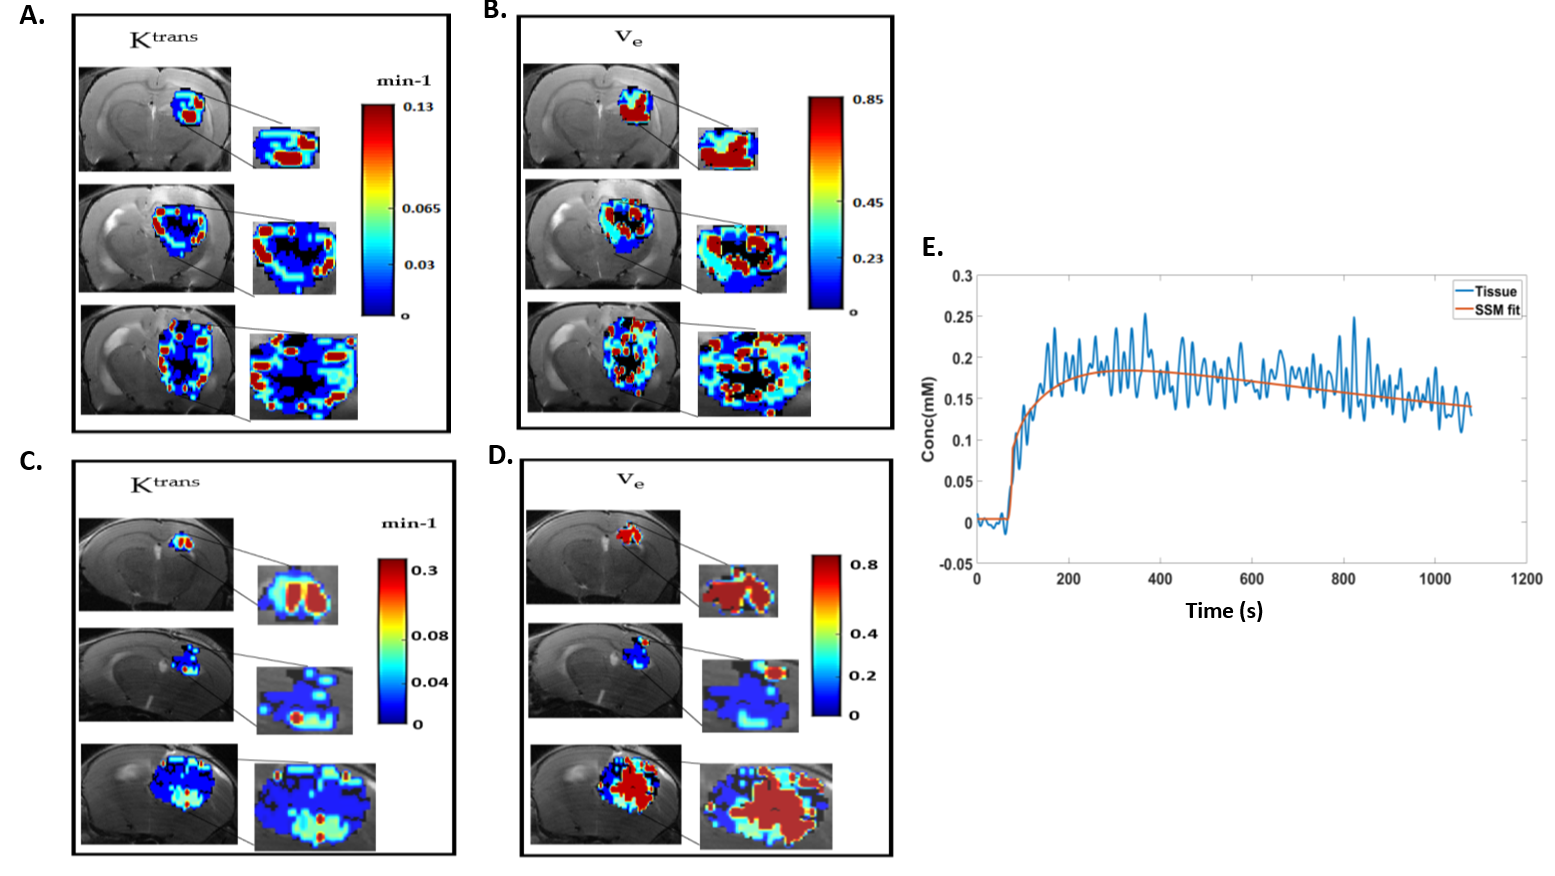
F344 Fischer rats with intracranially implanted F98 GBM cells and C57BL6 mice with intracranially implanted GL261 GBM cells were used for pharmacokinetic modelling and image analysis. The MR images were obtained using a horizontal bore 9.4 T scanner. A volume transmit coil and a 4-channel surface receive coil were used for data acquisition. A dynamic 3D multi‐gradient‐echo (MGE) sequence was used to record the kinetics of the contrast agent. For the dynamic imaging, a matrix size of 128x64x8, TR/TE1/TE2 = 14/2.25/4.76 ms, and a 12 degrees flip angle was used. A bolus of gadopentetate in saline at the standard dose of 0.1 mmol/kg for rats and 0.2 mmol/kg for mice (for better SNR) was injected through a tail vein catheter, starting 1 min after collection of baseline images. 180 volumes were collected with a temporal resolution of 5.37 s per volume. Higher resolution anatomical T2- weighted images were also acquired for co-registration of the DCE images. For therapeutic response monitoring, a cohort of 4 rats and 5 mice received JAS239 treatment (4 mg/kg/day injected intraperitoneally for 5 consecutive days), 4 rats and 5 mice were treated with saline and used as controls. Animals were imaged on day 0 (T0, baseline), day 3 (T3), 6 (T6) of treatment and post-treatment day 8 (T8) for rats and day 10 (T10) for mice. $$$ K^{trans}$$$, $$$v_e$$$ were derived using two-compartment exchange model (2CXM)8 and Shutter speed model (SSM)2. $$$τ_i$$$ and $$$F_p$$$ were estimated using SSM and 2CXM, respectively. The initial parameter values for non-linear least-square fitting based on Levenberg-Marquardt algorithm were based on the literature values9,10. A population AIF was obtained from datasets following a selection-criteria described in literature11,12. The pharmacokinetic model parameters were set to zero for a poor fit (R2 < 0.7) resulting in a necrotic region or cluster. Hierarchical clustering algorithm, using a Ward’s linkage Method and Euclidean distance measure was used13 to assess tumour heterogeneity using a three-region clustering of the parameters. The number of pixels in these cluster were indicated as $$$N_{x,y}$$$ , where $$$y$$$= low, med and high, $$$x$$$= $$$ K^{trans}$$$, $$$v_e$$$, $$$τ_i$$$ and $$$F_p$$$. The mean value of the parameters ($$$\overline{x}$$$) was also calculated across all the clusters. An example of clustering the $$$ K^{trans}$$$, $$$v_e$$$ parameters obtained with SSM is shown in Fig 1A-D and an example of SSM fitting of a mouse GL261 tumour in shown in Fig 1E.Results
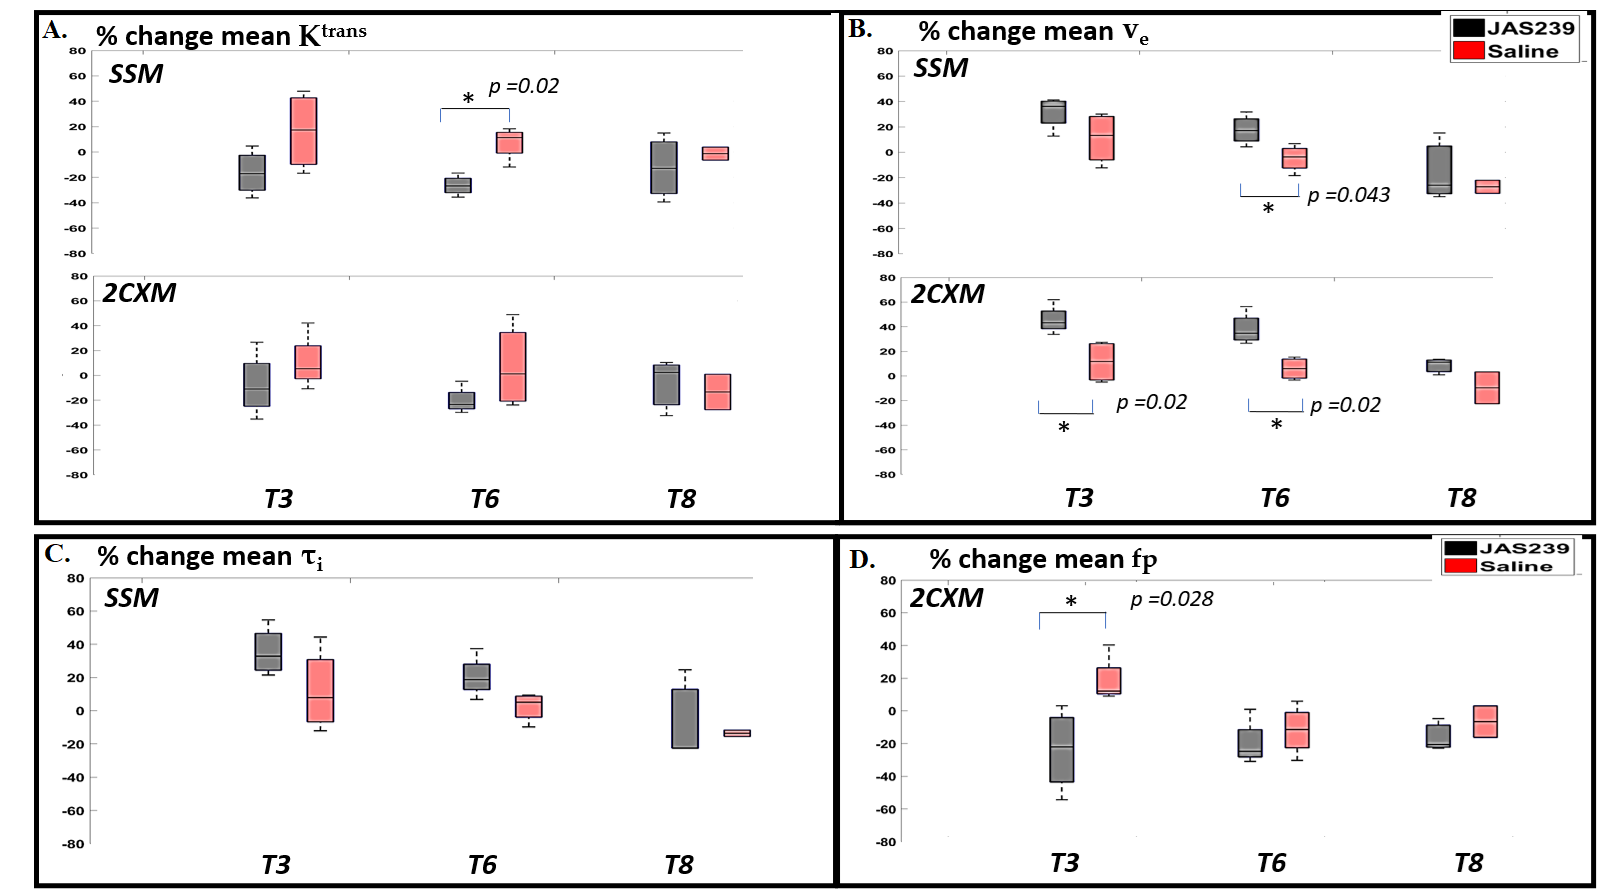
F98 rat GBM - JAS239 treatment led to a significant increase in $$$N_{K^{trans},low}$$$ (p=0.04) on T3 and a significant decrease in $$$N_{K^{trans},high}$$$ (p=0.02) as well as mean $$$ K^{trans}$$$ (p=0.02) on T6 in comparison to control (Figs 2A and 4). A significant increase in $$$N_{F_{p},low}$$$ (p=0.02) and a significant decrease in $$$N_{F_{p},high}$$$ (p=0.02) and mean $$$F_p$$$ (p=0.028) was observed on T3 in JAS239 treated rats as compared to control (Figs 2B and 4), indicating early reduction of vascular permeability and perfusion during treatment. A significant increase in $$$N_{v_{e},high}$$$ (p=0.04) and mean $$$v_e$$$ (p=0.043) was observed on T6 in JAS239 as compared to control (Figs 2A and 4), suggesting reduced cell density during treatment. No significant change in $$$N_{τ_{i} ,y}$$$ and mean $$$τ_i$$$ was observed (Figs 2B). No significant changes or trend in any of the above parameters were noticed for the GL261 mice treated with JAS239 (Figs 3 and 5). There was an overall increasing trend in necrotic pixels with JAS239 as compared to control in both F98 and GL261 tumours (Figs 4 and 5).Discussion
Earlier studies have shown early reduction in $$$ K^{trans}$$$ and increase in $$$v_e$$$ following therapeutic treatment14-17. Although using region-based clustering of the DCE-MRI based parameters, we observed treatment response in terms of early changes in reduction of permeability and perfusion along with reduced cell density with treatment in the F98 cases, no significant differences in these parameters was found for the GL261 tumour indicating that this model may be less sensitive to JAS239 treatment with regards to changes in vascular parameters. These findings are in agreement with a previous study18, where an anti-vascular agent (bevacizumab) was used for treatment.Conclusion
The study demonstrates that region-based clustered pharmacokinetic parameters derived from DCE-MRI may be useful in detecting and assessing tumour heterogeneities with a potential for assessing therapeutic response.Acknowledgements
The studies were performed in the Centre for Preclinical Imaging, which is funded by the grants from the MRC as well as the Wellcome Trust.References
1. Li X., et al. Cancer Imaging. 2015;15(1):4.
2. Springer CS Jr., et al. NMR Biomed. 2014 Jul;27(7):760-73.
3. Dickie BR., et al. Br J Cancer. 2017 May 23;116(11):1436-1443.
4. Wang S., et al. Radiology. 2012 Feb;262(2):584-92.
5. Glunde K., et al. Nat. Rev. Cancer 2011, 11, 835–848.
6. Kumar M., et al. Mol Cancer Ther. 2015 Apr;14(4):899-908.
7. Arlauckas SP., et al. Oncotarget. 2017 Mar 7;8(10):16518-16530.
8. Sourbron S., et al. Magn Reson Med. 2009 Jul;62(1):205-17.
9. Balvay D., et al. 5th IEEE International Symposium on Biomedical Imaging: From Nano to Macro, 2008, pp. 600-603.
10. Inglese M., et al. Neuroradiology. 2019 Dec;61(12):1375-1386.
11. Yin J., et al. Neuroradiology. 2015 May;57(5):535-43.
12. Mouridsen K., et al. Magn Reson Med. 2006 Mar;55(3):524-31.
13. Ward JH. Journal of the American statistical association. 1963;58(301):236–244
14. Flaherty KT., et al. Cancer Biol Ther. 2008 Apr;7(4):496-501.
15. Hsu CY., et al. J Hepatol. 2011 Oct;55(4):858-65.
16. Hahn OM., et al. J Clin Oncol. 2008 Oct 1;26(28):4572-8.
17. Xu J., et al. Clin Radiol. 2018 Jul;73(7):625-631.
18. Zhang J., et al. PLoS One. 2020;15(6):e0234520.
Figures