0678
MRS to assess changes in total choline as a potential marker of treatment response to choline kinase inhibition in GL261 mouse glioblastomas1Centre for Preclinical Imaging, University of Liverpool, Liverpool, United Kingdom, 2Department of Radiology, University of Pennsylvania, Philadelphia, PA, United States, 3Department of Radiology, Weill Cornell Medical College, New York, NY, United States
Synopsis
This study investigates the effect of JAS239 on GL261 mouse glioblastoma using MRS. Higher reduction in Cho concentration and Cho/Cr ratios were observed in the tumour region than the contralateral normal brain after JAS239, indicating high sensitivity of MRS in as a pharmacodynamic marker of ChoK inhibition in glioblastomas with a potential of being an alternative treatment method.
Introduction
Total choline (Cho) has been observed to be elevated in tumours, resulting from an increase in phosphocholine (PC) 1, mediated by an over-expression of Choline Kinase (ChoK). Recent studies have explored the possibility of altering the expression or activity of enzymes involved in choline metabolism as a novel therapeutic target for cancer treatment 2. An earlier study demonstrated that 1H MRS can be used to detect a decrease in Cho as a pharmacokinetic marker for treatment response and inhibition of ChoK activity by MN58b in a rat model of glioblastoma 3. A second generation ChoK inhibitor, JAS239, which is fluorescent has been reported to be a potent inhibitor of ChoK in mouse models of breast cancer 4. This study was therefore performed to investigate the effect of JAS239 on GL261 mouse GBM tumour growth and Cho using MRS.Methods and Materials
C57BL6 mice (n=10) were injected intracranially with 5x10⁵ GL261 glioblastoma cells in the right cortex. Once the tumours were observed on T2 weighted MRI (>3 mm in diameter), animals were treated once daily with intraperitoneal injections of 4 mg/kg JAS239 (n=5) or saline (n=5) for 5 consecutive days. Anatomical T2-weighted images and spectroscopy data were acquired on day 0 (T0, baseline), day 3 (T3), 6 (T6, end of treatment) and 4 days after completion of treatment on day 10 (T10). Single voxel (2x2x2 mm3) spectra were acquired from the tumour as well as the contralateral normal brain using a PRESS sequence: TR= 2000 ms, TE1= 9.13 ms and TE2= 7.37 ms, number of averages= 150, complex points= 2048 and spectral width=4401 Hz. The effect of JAS239 on tumour growth was determined using T2-weighted images. Cho concentration (Cho/Water), metabolite amplitude ratios (Cho/Cr, Cho/NAA) were obtained using QUEST algorithm 5 in jMRUI software 6.Results
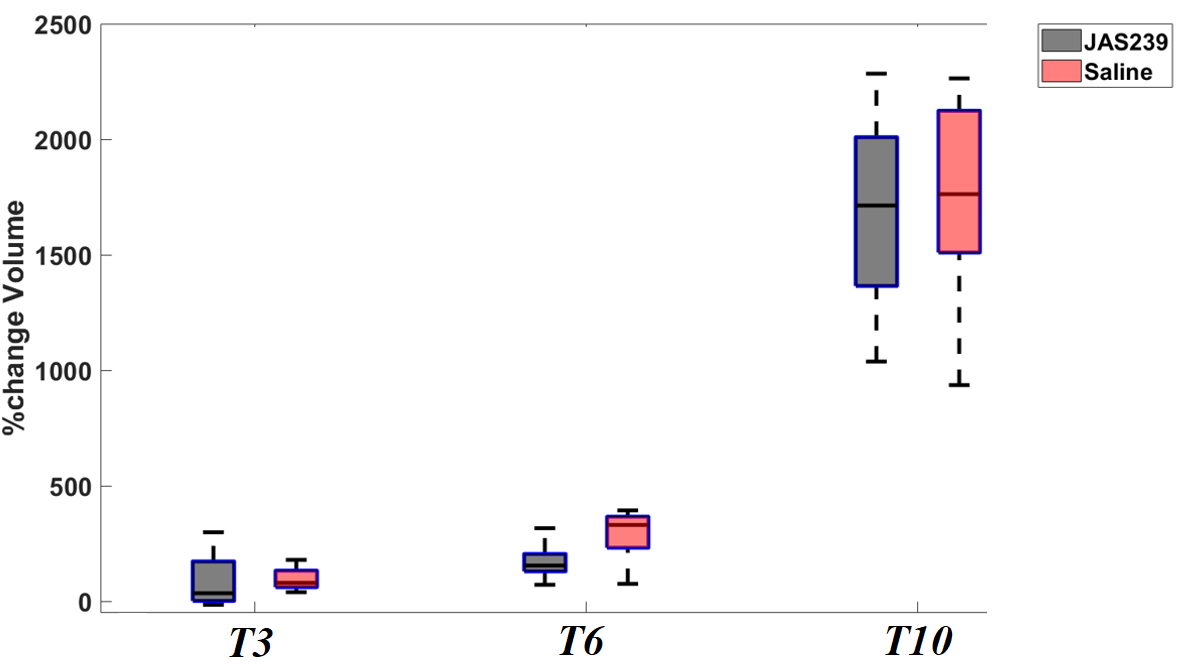
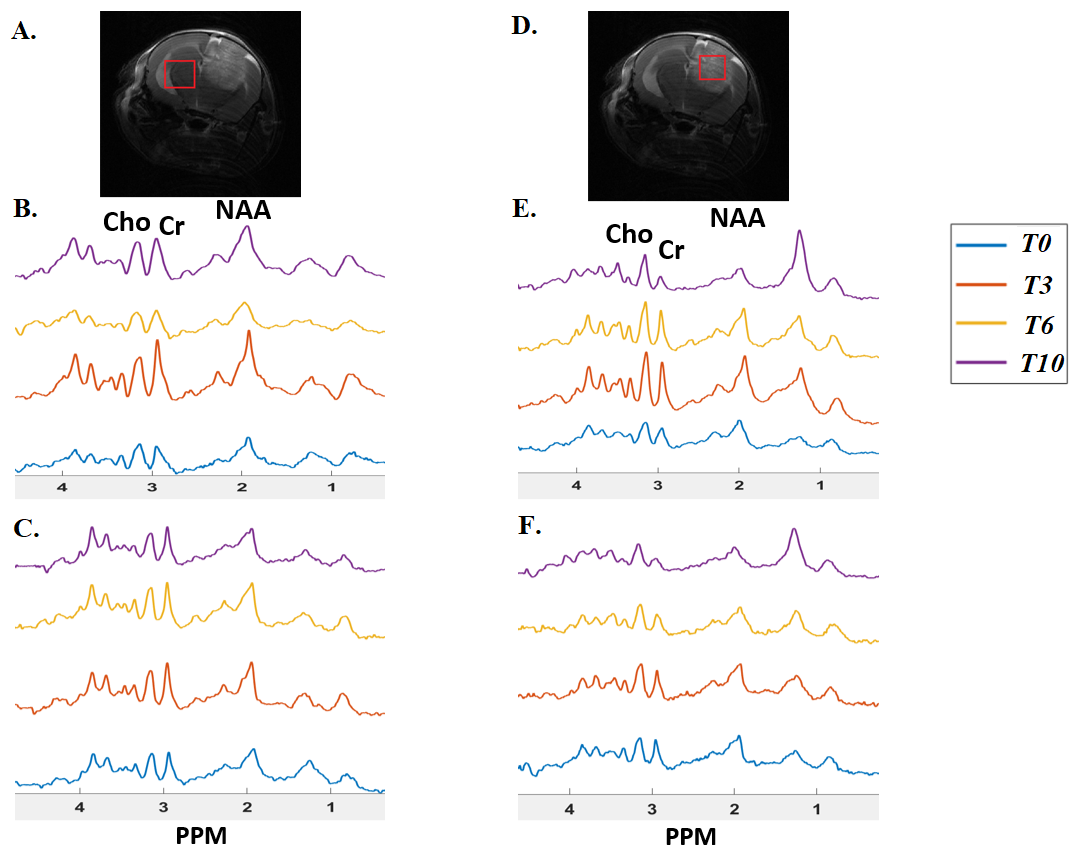
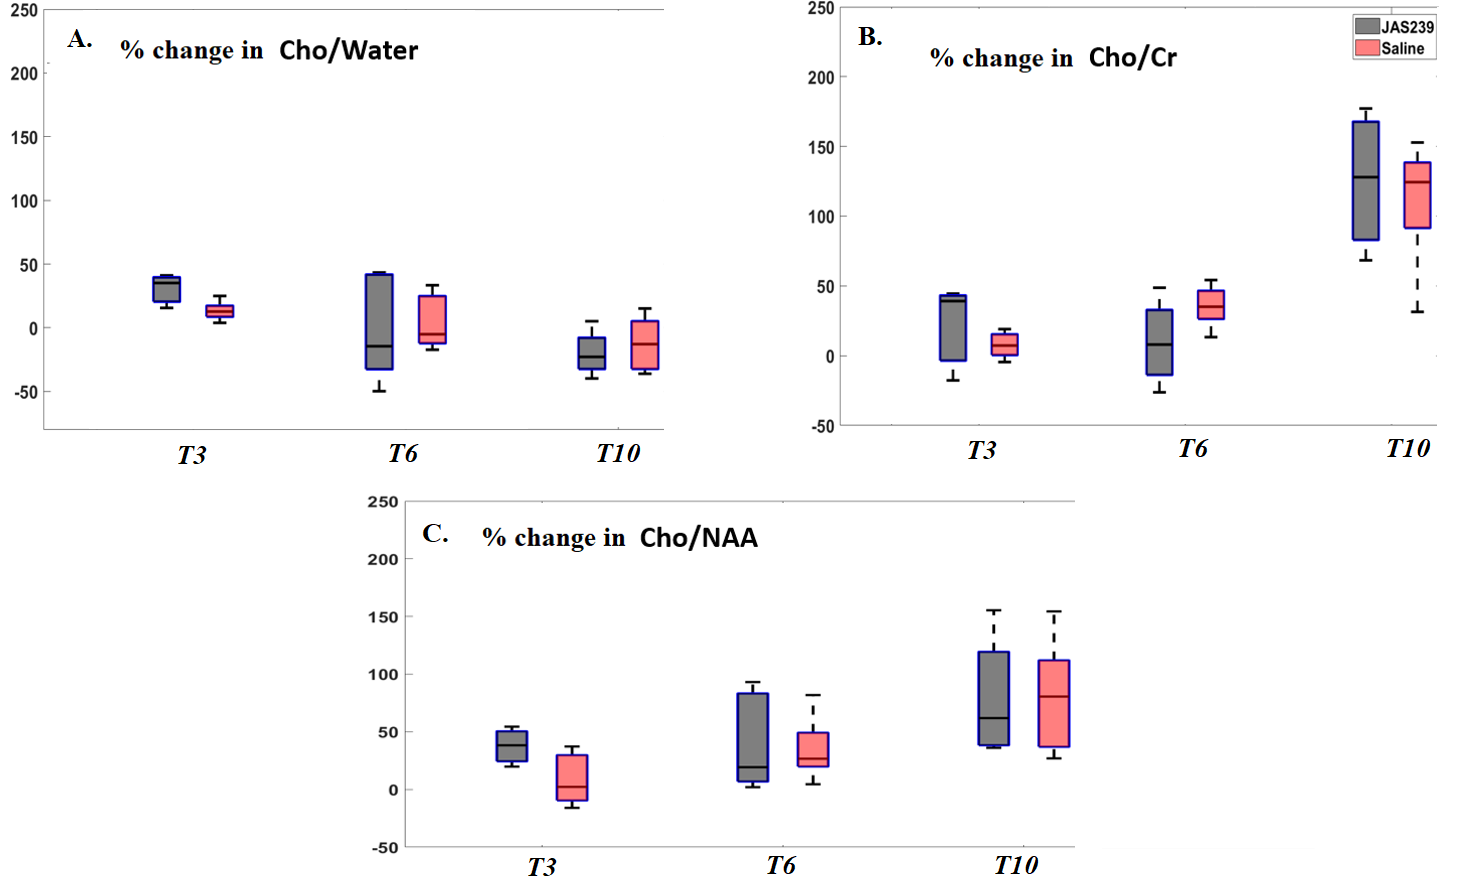
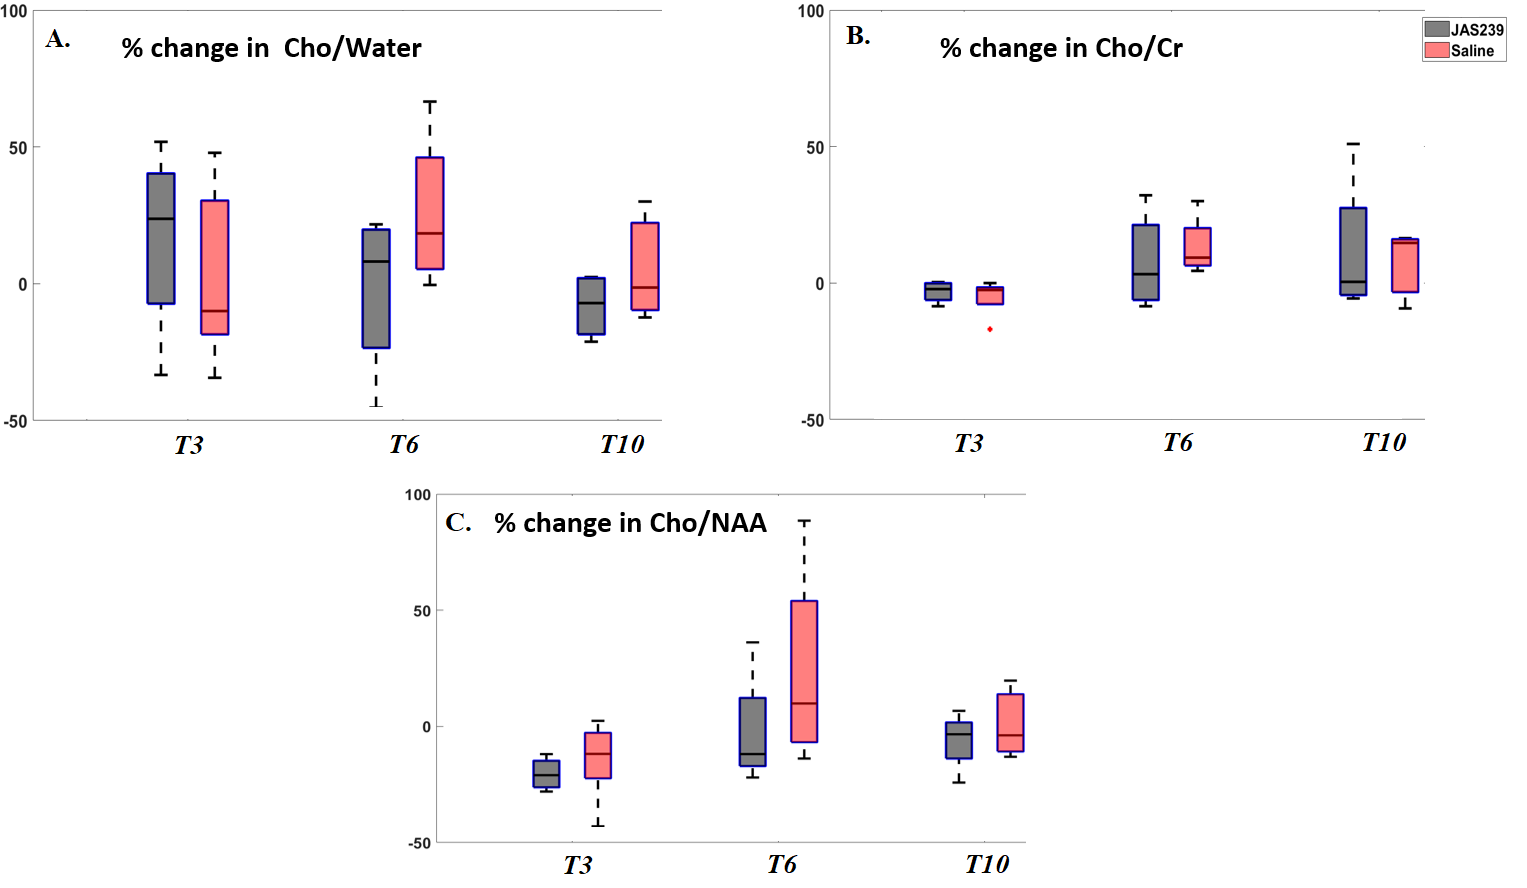
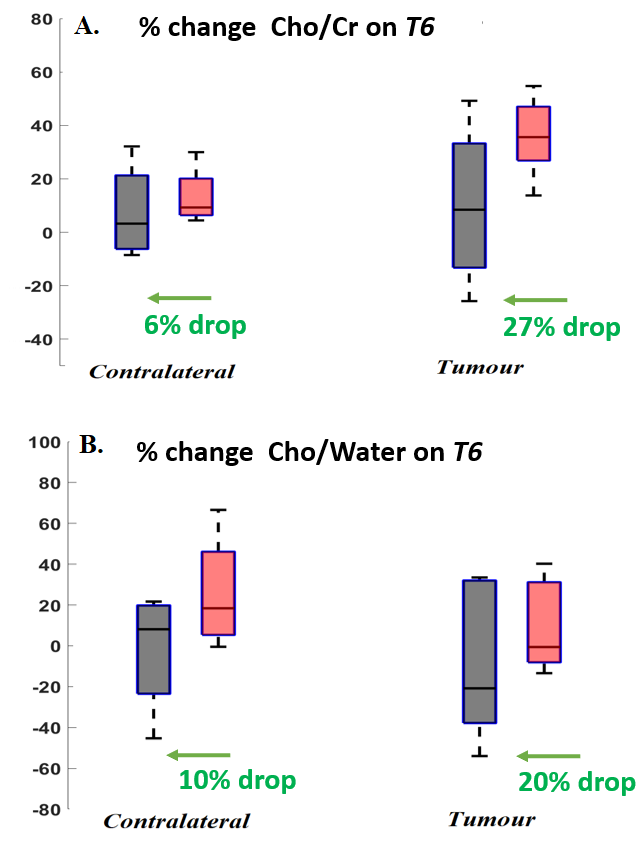
Control saline treated rats showed a larger increase in tumour volume (Fig 1), compared to JAS239 treated animals with respect to baseline. At the end of treatment day (T6), the change in median tumour volumes in JAS239 treated animals was about 2.1 fold smaller than the saline treated animals (Fig 1). However, there was no statistically significant differences between the two groups. In vivo MR spectra from the tumour and contralateral brain of a representative mouse treated with JAS239 and from a control animal treated with saline are shown in Figure 2A-2F. In the contralateral region, no significant reduction (p>0.05) in percentage change in Cho concentration, Cho/Cr or Cho/NAA ratios were observed with JAS239 treatment compared to control (Fig 4). In the tumour region, no significant changes (p>0.05) were observed relative to baseline in Cho concentration, Cho/Cr, Cho/NAA ratios with JAS239 treatment compared to control (Fig 3). However, at end of treatment day (T6) a higher reduction in Cho/Cr ratio (27%) was observed in the tumour in JAS239 treatment as compared to a 6% reduction in the contralateral region (Fig 5A). A higher reduction was also observed in Cho/Water ratio (20%) with JAS239 treatment in the tumour region as compared to 10% in the contralateral region (Fig 5B).Discussion
MRS has been used for assessing treatment response and a decrease in Cho has been used as a pharmacodynamic marker of ChoK inhibition 1-3, 7-8. A reduction in Cho concentration and Cho/Cr ratios was observed with JAS239 treatment as compared to control and baseline values, showing that JAS239 selectively inhibits proliferating cells within the tumour and not in the normal brain. However, the effect of JAS239 in the reduction of Cho in these tumours was not as striking or evident as has been reported for MN58b treatment of rat F98 glioblastomas 3 or JAS239 treatment of breast cancer model 1 indicating that the GL261 model may be more resistant to this treatment.Conclusion
The higher reduction in Cho from tumour region compared to contralateral brain indicates preferential inhibition of ChoK in the tumour by JAS239, that this drug may have some value in the treatment of glioblastomas, although it might need to be combined with other therapeutic strategies towards effective treatment.Acknowledgements
The studies were performed in the Centre for Preclinical Imaging, which is funded by the grants from the MRC as well as the Wellcome Trust.References
1. Arlauckas, S. P., et al. Oncotarget, 2017; 8(10), 16518–16530
2. Glunde K., et al. Nat Rev Cancer. 2011;11(12):835–48.
3. Kumar M., et al. Mol Cancer Ther. 2015 Apr;14(4):899-908.
4. Arlauckas SP., et al. Mol Cancer Ther. 2014 Sep;13(9):2149-58.
5. Ratiney H., et al. NMR Biomed. 2005, 18, 1–13.
6. Stefan D., et al. Meas. Sci. Technol. 2009, 20, 104035.
7. Kelly CL., et al. Proc ISMRM 2020, 4815.
8. Kelly CL., et al. Proc ISMRM 2019, 2392.
Figures