0677
Proton and hyperpolarized 13C MRS based biomarkers response to the BAY-1436032 IDH inhibitor in cell and in vivo glioma models1University of California, San Francisco, San Francisco, CA, United States
Synopsis
Mutant IDH1 inhibitor treatment is currently in clinical trials for glioma patients. Therefore, in vivo biomarkers are needed to assess early therapeutic responses. Here we treated mutant IDH1-expressing cells and animals with patient-derived mutant IDH1 brain tumors with the emerging inhibitor BAY-1436032. Using 1H MRS we found a significant decrease in 2HG that was accompanied by an increase in glutamate and phosphocholine, and using 13C MRS we detected a significant decrease in 2HG and a significant increase in glutamate produced from hyperpolarized [1-13C] α-ketoglutarate in cell and animal models.
Introduction
Mutations in the cytosolic enzyme isocitrate dehydrogenase 1 (IDH1) are a common feature of primary low-grade gliomas. They catalyze the conversion of α-ketoglutarate (αKG) to the oncometabolite 2-hydroxyglutarate (2HG). Several promising mutant IDH inhibitors have been developed and are currently in clinical trials. One such agent is the pan-mutant-IDH1 inhibitor BAY-1436032, which has been shown to increase the survival of mutant IDH1 astrocytoma-bearing mice (1). Therefore, in vivo biomarkers are needed to assess early therapeutic responses. This study aimed to investigate the 1H and hyperpolarized (HP) 13C magnetic resonance spectroscopy (MRS)-based biomarkers that can serve as indicators of response to treatment with BAY-1436032 in cell and in vivo glioma models.Methods
Normal human astrocytes (NHA) engineered to express mutant IDH1 (2) were treated with IC50 value of BAY-1436032 (1 μM; N=4) or DMSO (0.2%; N=4) every 24 hours for 3 days. Control and treated cells were extracted using the dual-phase extraction method. 1H MRS spectra were acquired on a 500 MHz spectrometer (Bruker) using 1D water pre-saturation ZGPR sequence, flip angle = 90°, TR = 3 sec, 256 averages. [1-13C]αKG was prepared as previously (3) and polarized using a Hypersense (Oxford) polarizer. 500 μl of HP [1-13C]αKG was injected into lysed cells (~2.0 x 10⁸ cells) and HP 13C spectra acquired using a 500 MHz spectrometer (Agilent Technologies) using FA = 13°, TR = 3s, NEX = 100 (N = 4 each for controls and treated). Metabolite peaks were integrated using MNOVA (Mestrelab Research) and normalized to TSP and cell number for 1H MRS data and to [1-13C]αKG and to cell number for HP 13C MRS data.BT257 patient-derived mutant IDH1 cells (~3 × 10⁵ cells) were implanted into nude rats (N = 3) and tumor growth was monitored until volume reached ~0.22 cm3. This was considered day zero. As a baseline, we then performed single-voxel proton spectroscopy at 3 T (Bruker) using a PRESS sequence with TE = 16 ms and voxel = 4 x 4 x 4 mm3. Then, 2.5 ml of hyperpolarized [1-13C]αKG was injected via the tail-vein catheter and HP 13C slab spectroscopy data acquired using an optimized spectral-spatial excitation and variable flip angle scheme (10 mm slab thickness, flip angle 1 = 38.01° ~ 90° at 184 ppm, flip angle 2 = 3.04° ~ 7.20° at 172 ppm, NT = 8, and temporal resolution = 6 sec) (4). Data were analyzed using an in-house quantification pipeline which involves spectral-temporal denoising using singular value decomposition combined with LCModel-based automatic 13C spectral fitting (4). Animals were then treated intraperitoneally with 150 mg/kg of BAY-1436032 every 24 hours and on day 10 the MR studies were repeated to monitor the effectiveness of treatment.
Statistical significance of differences was determined using a Student’s t-test and p<0.05 was considered significant.
Results
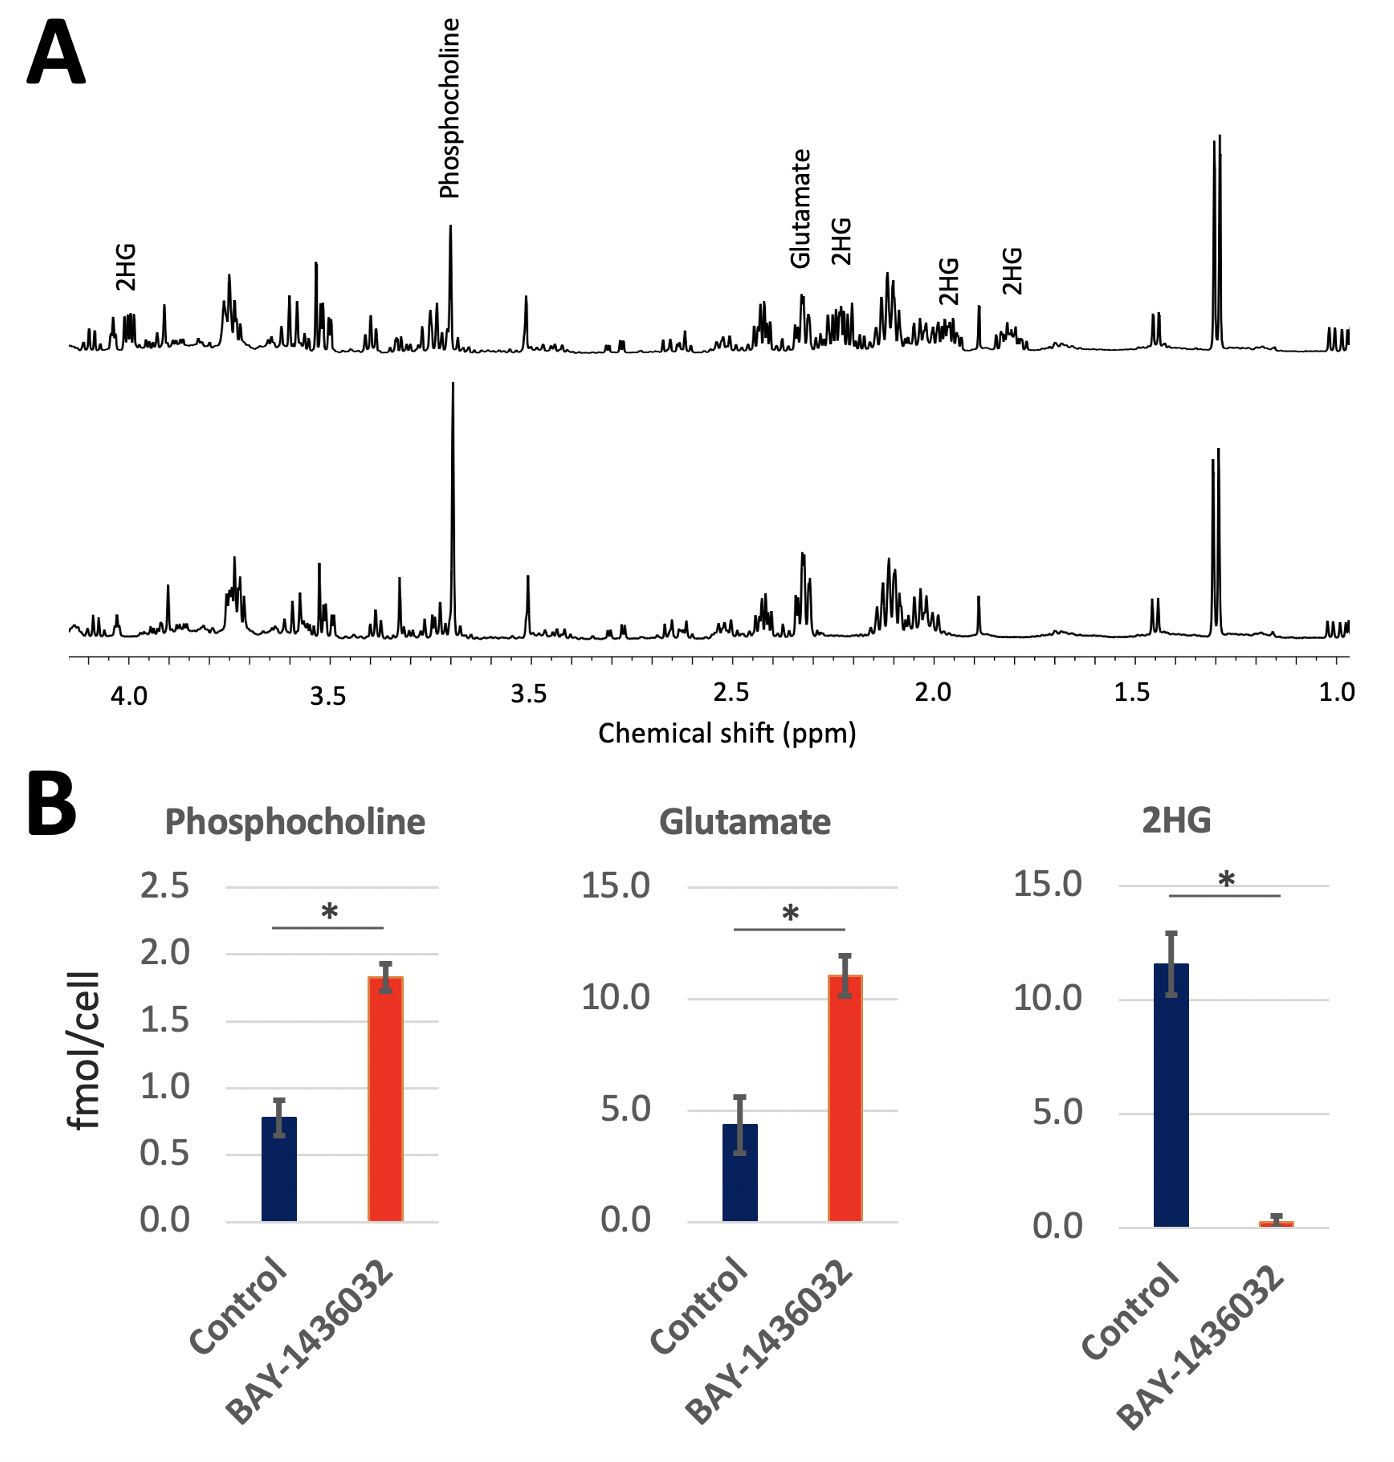
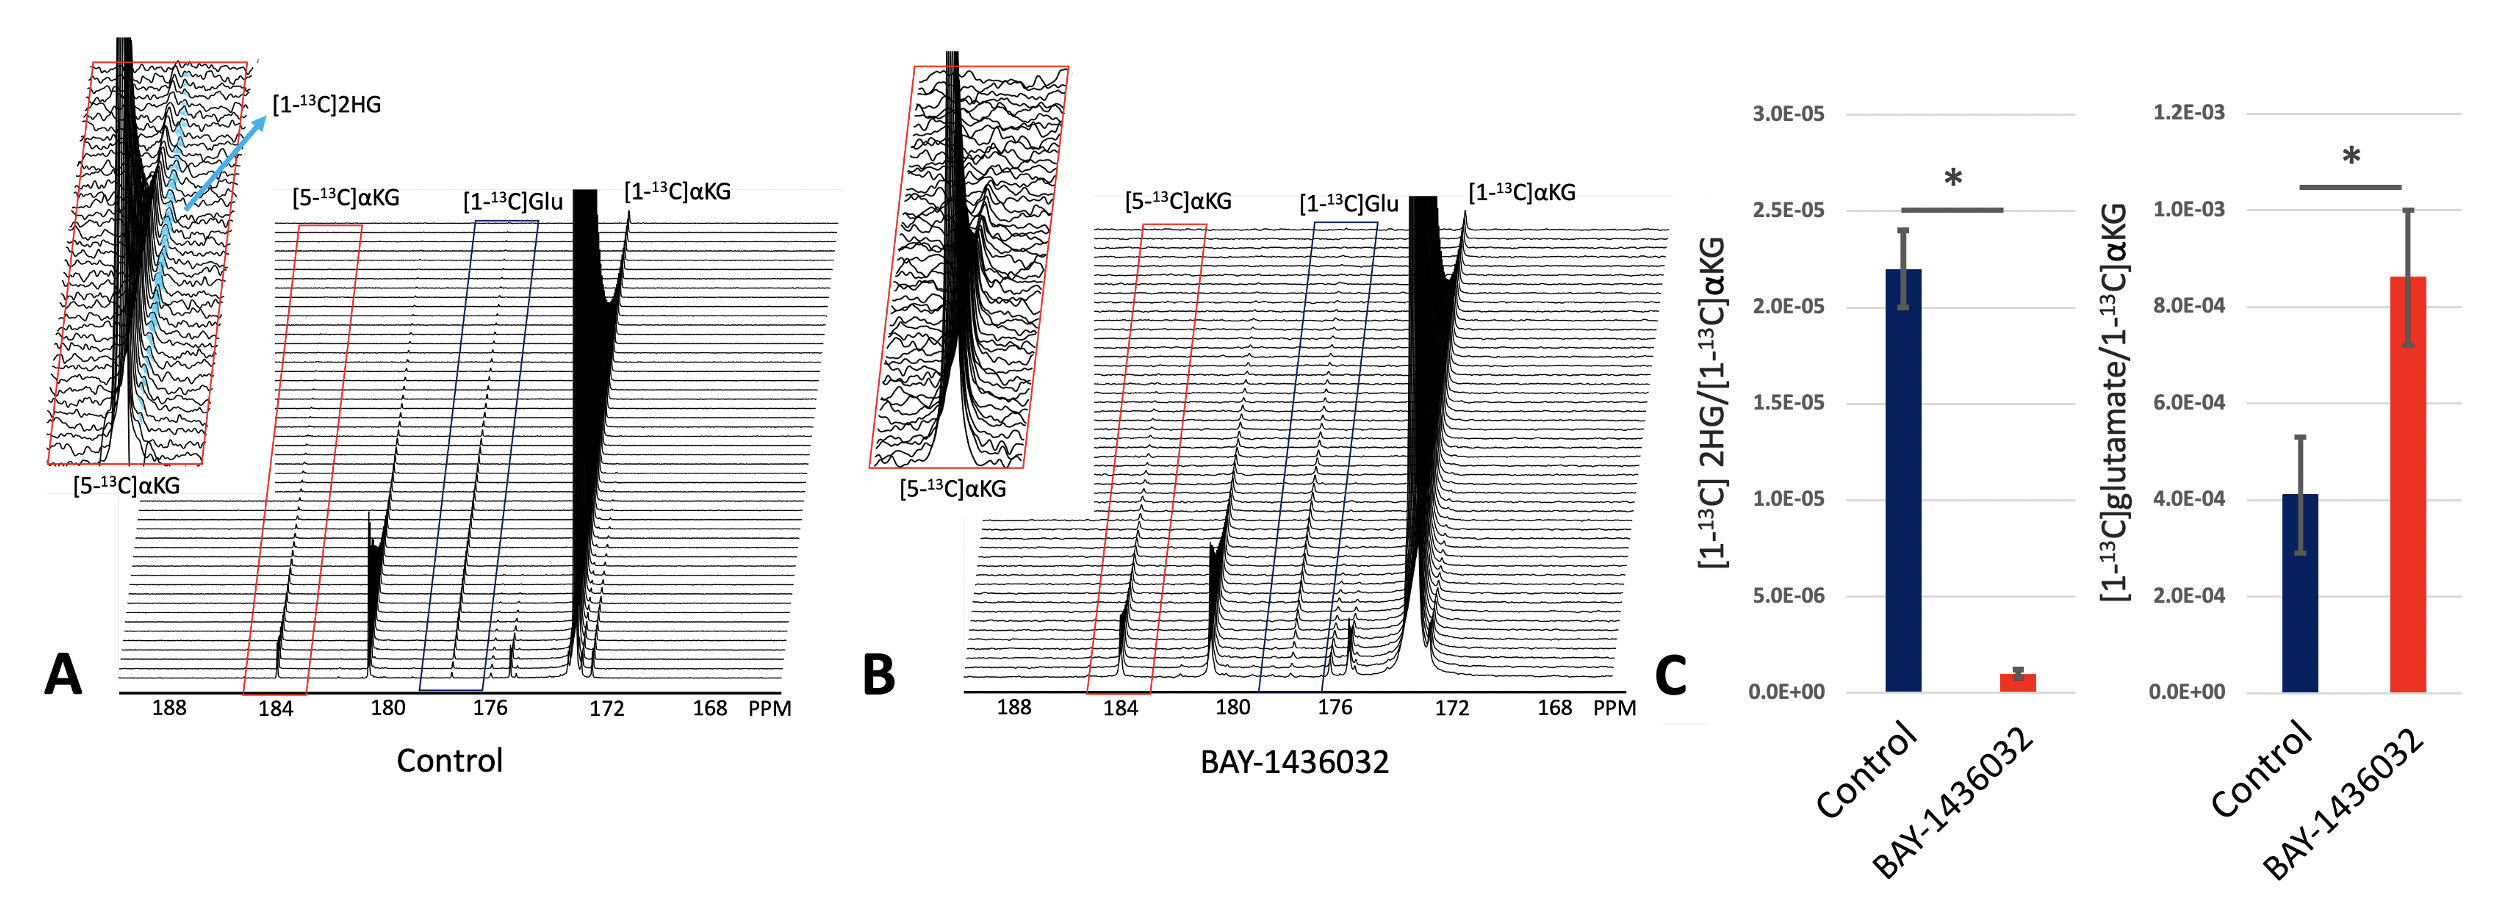
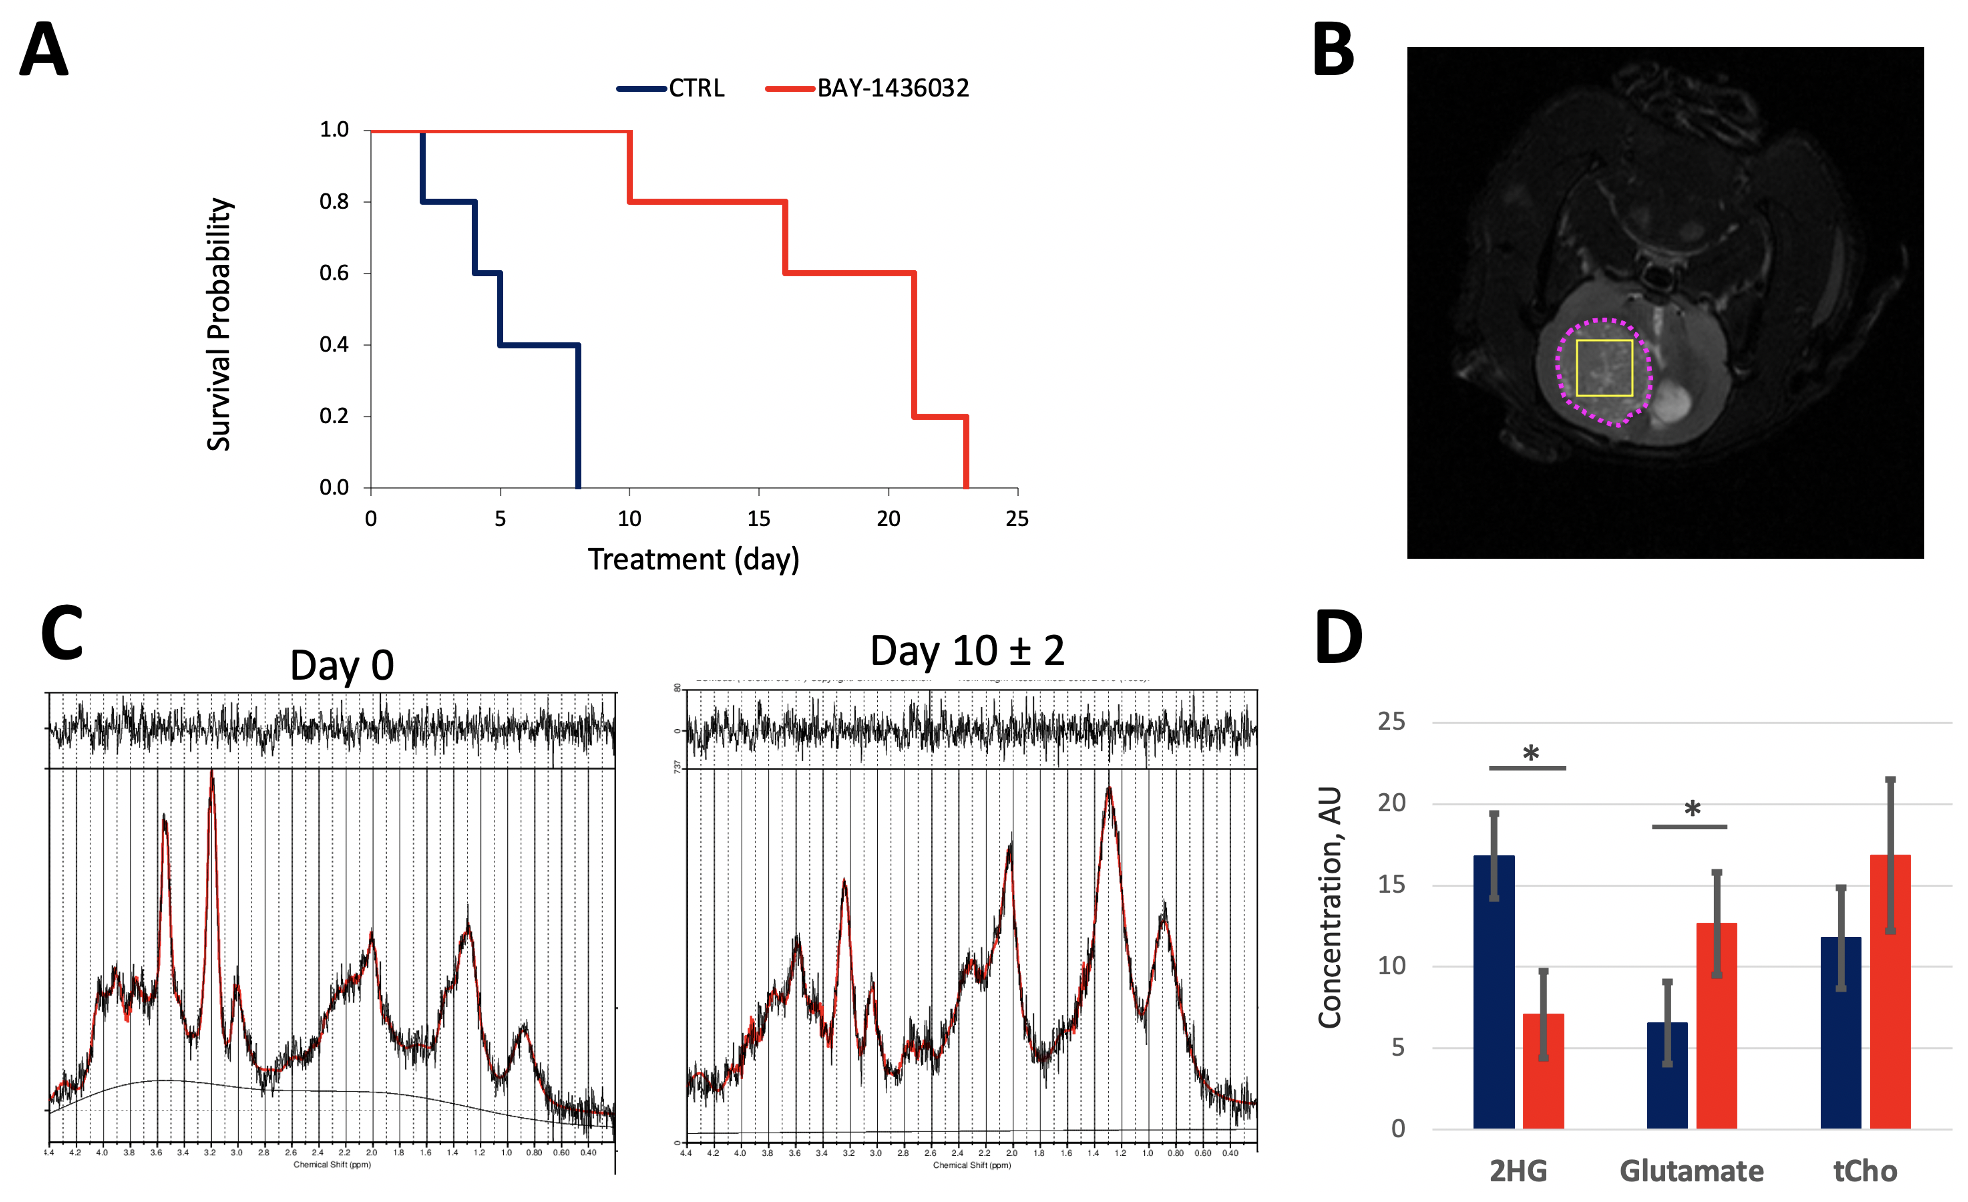
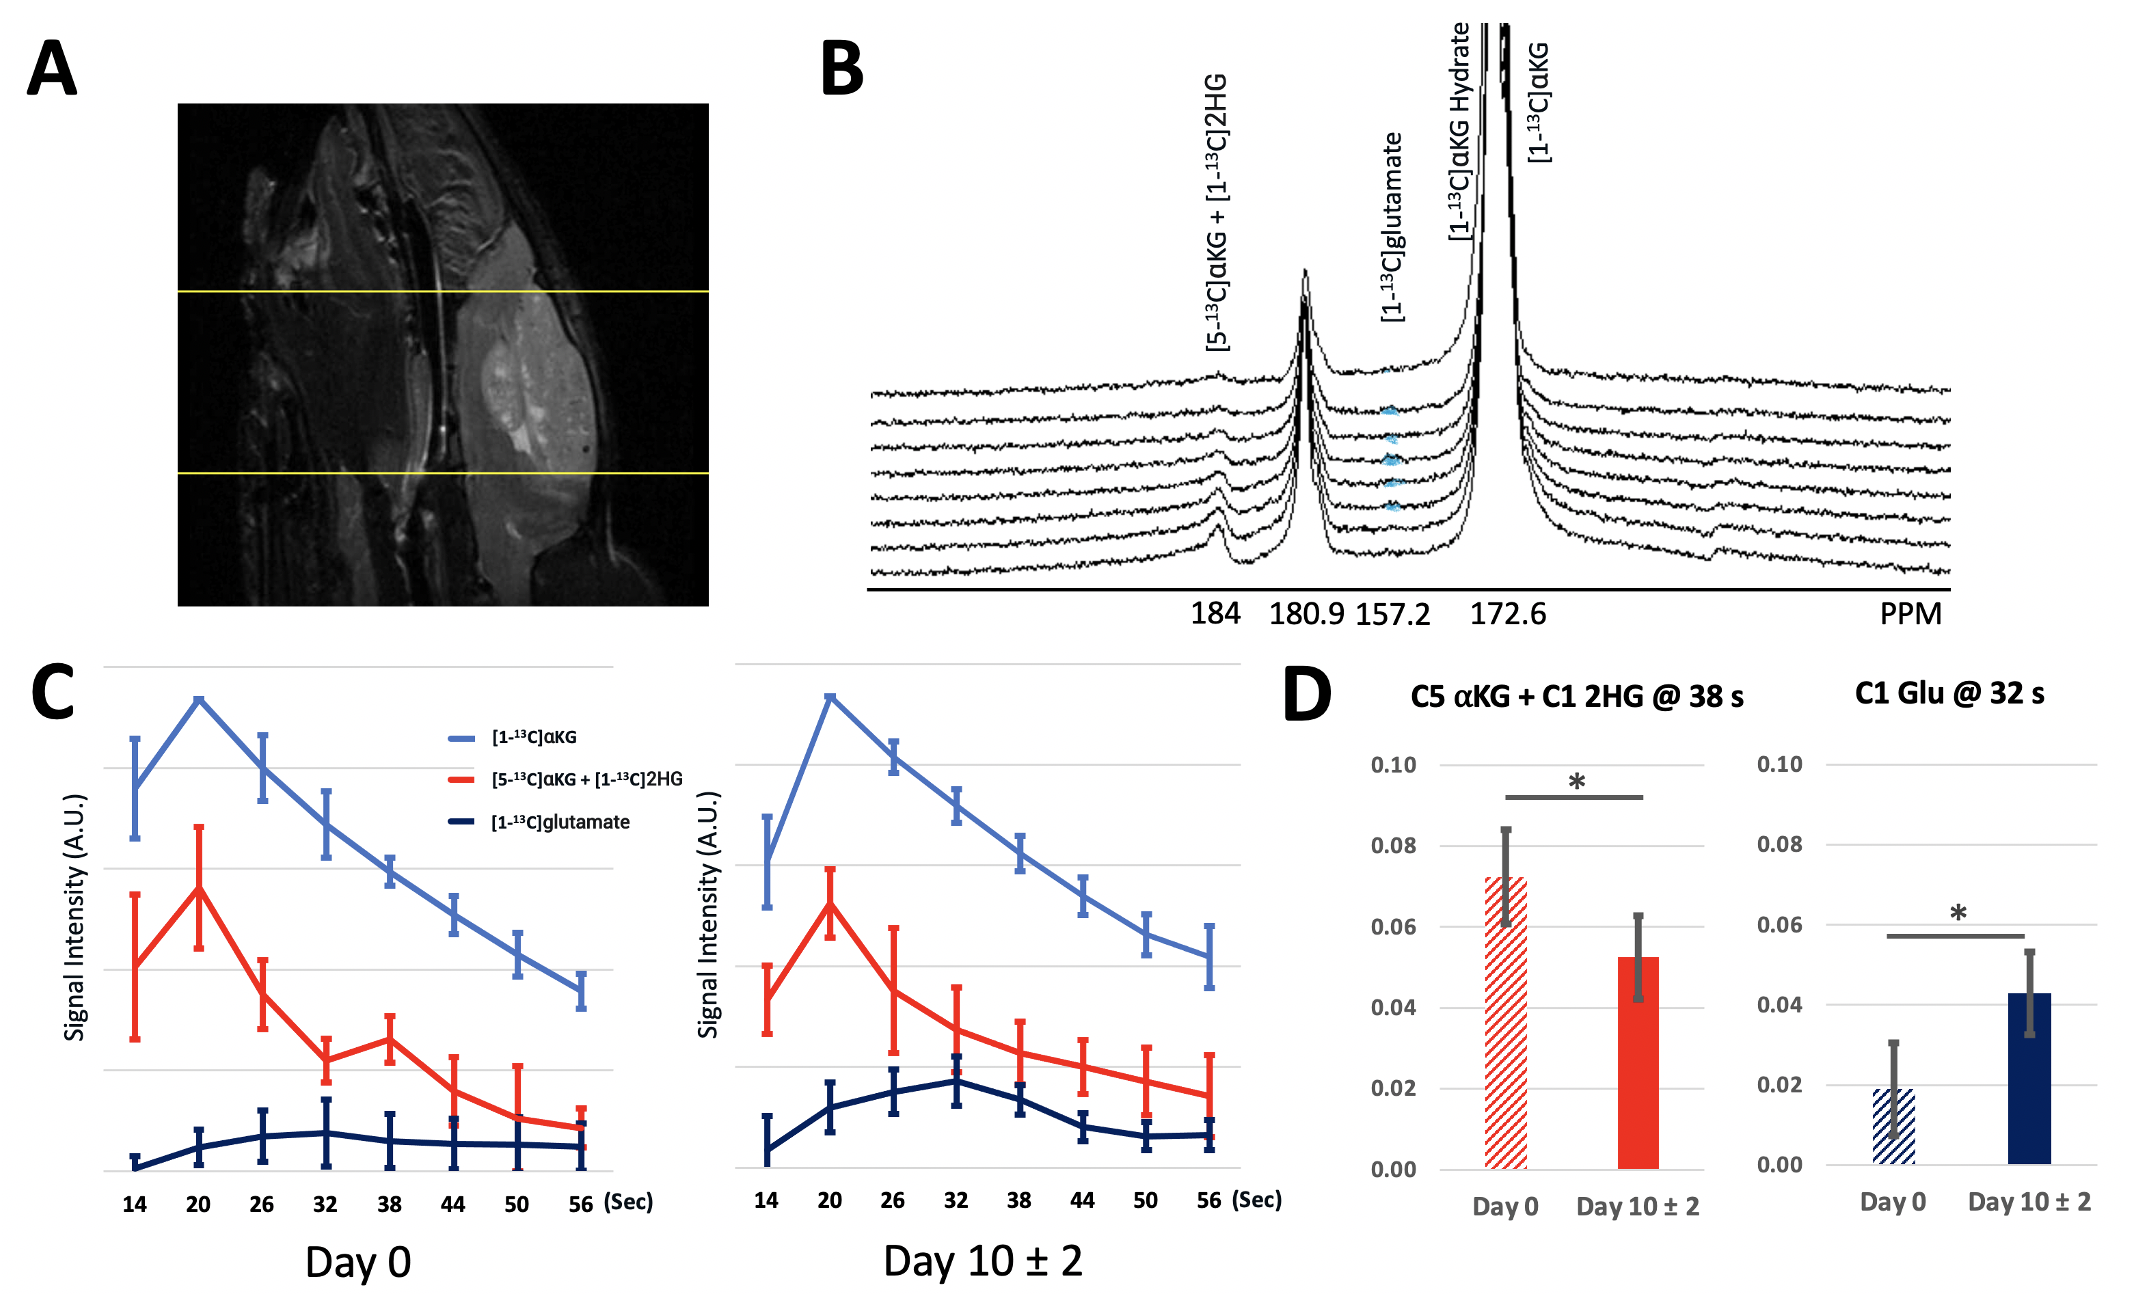
Figure 1A compares representative proton MRS spectra between control and treated cell extracts. As expected, a significant decrease in 2HG, consistent with mutant IDH1 inhibition was observed. In addition, a significant increase in glutamate and phosphocholine was found (Figure 1B). Other metabolites were not altered. Injection of HP [1-13C]αKG into the cell lysate resulted in visible production of 2HG and glutamate in control (Figure 2A) and treated (Figure 2B) groups. HP 2HG was significantly decreased and HP glutamate was significantly increased in the BAY-1436032 treated cells compared to controls (Figure 2C). Figure 3A demonstrates enhanced animal survival following BAY-1436032 treatment although tumor shrinkage was generally not observed. Figure 3B illustrates the 1H MRS voxel position on the T2-weighted image for the BT257 tumor. Pre- (left) and post- (right) treatment proton single voxel spectroscopy results after LCModel fitting were compared (Figure 3C) and a significant decrease in 2HG and a significant increase in glutamate were observed in the BAY-1436032 treated animals. An increase in total choline trended toward significance (p = 0.063). Dynamic evolution of HP [1-13C]αKG metabolism in BT257 tumor-bearing rat brain (Figure 4A) is illustrated prior to treatment in Figure 4B where we were able to monitor glutamate as well as the composite [1-13C]2HG and natural abundance [5-13C]αKG peaks, which cannot be separated because they resonate within 0.1 ppm of each other (2). Based on prior work, the signal increase at 38 sec is indicative of [1-13C]2HG production (2). Importantly, after treatment, we found that the signal increase at 38 sec could no longer be observed. In addition, HP [1-13C]glutamate production was significantly increased in the treated group (see Figures 4C and 4D).Discussion
In this study, we identified proton and HP 13C MRS-detectable biomarkers of response to the mutant IDH1 inhibitor BAY-1436032 that were indicative of enhanced survival without consistent tumor shrinkage. As expected, significantly decreased 2HG levels as well as decreased hyperpolarized 2HG production from [1-13C]αKG were observed following treatment. Moreover, we also found a significant increase in glutamate levels after treatment and a significantly higher production of hyperpolarized glutamate from [1-13C]αKG. These cell and in vivo findings are consistent with our previous observations in cells using other inhibitors, and point to the value of 1H and hyperpolarized 13C MRS as translatable methods to monitor mutant IDH1 inhibition.Acknowledgements
This work was supported by NIH R01CA172845, NIH R01CA197254, UCSF LOGLIO collective, NICO project, and NIH P41EB013598 Hyperpolarized MRI Technology Resource Center Grant.References
1. Pusch S, Krausert S, Fischer V, Balss J, Ott M, Schrimpf D, Capper D, Sahm F, Eisel J, Beck A-C. Pan-mutant IDH1 inhibitor BAY 1436032 for effective treatment of IDH1 mutant astrocytoma in vivo. Acta neuropathologica 2017;133(4):629-644.
2. Chaumeil MM, Larson PE, Yoshihara HA, Danforth OM, Vigneron DB, Nelson SJ, Pieper RO, Phillips JJ, Ronen SM. Non-invasive in vivo assessment of IDH1 mutational status in glioma. Nature communications 2013;4(1):1-12.
3. Molloy AR, Najac C, Viswanath P, Lakhani A, Subramani E, Batsios G, Radoul M, Gillespie AM, Pieper RO, Ronen SM. MR-detectable metabolic biomarkers of response to mutant IDH inhibition in low-grade glioma. Theranostics 2020;10(19):8757-8770.
4. Hong D, Batsios G, Viswanath P, Gillespie AM, Vaidya M, Larson PEZ, Ronen SM. Acquisition and quantification pipeline for in vivo hyperpolarized 13C magnetic resonance spectroscopy. Magnetic resonance in medicine 2021; DOI: 10.1002/mrm.29081. In Press.
Figures