0675
Cell proliferation correlates with glucose metabolic fluxes in mouse glioblastoma subtypes as assessed via deuterium MRS1Champalimaud Research, Champalimaud Centre for the Unknown, Lisbon, Portugal
Synopsis
Dynamic glucose-enhanced deuterium MRS (DGE 2H-MRS) coupled with Marchenko-Pastur PCA denoising has shown potential for in vivo quantification of glucose metabolism through glycolysis and mitochondrial oxidation in a mouse model of glioblastoma, and for assessment of pathway flux modulations according to tumor heterogeneity. Here, we extend this approach to immunocompetent mouse glioblastoma subtypes with marked differences in tumor cell metabolism and histopathologic features, to utterly demonstrate the potential of DGE 2H-MRS for non-invasive metabolic phenotyping of glioma, or other cancers with mitochondrial oxidation dependencies, according to key features of the tumor microenvironment such as cell proliferation.
INTRODUCTION
Glioblastoma multiforme (GBM), the most aggressive glial brain tumors, can metabolize glucose through glycolysis or mitochondrial oxidation pathways [1]. While this metabolic heterogeneity is increasingly associated with class-specific dependencies in GBM [2], detecting such metabolic subtypes in vivo remains elusive [3]. Dynamic glucose-enhanced deuterium spectroscopy (DGE 2H-MRS) coupled with Marchenko-Pastur PCA denoising [4] has shown potential for differentially assessing glucose turnover rates through glycolysis and mitochondrial oxidation in the GL261 mouse model of GBM [5], suggesting their modulation in vivo according to tumor heterogeneity [6]. Here, we clearly demonstrate the potential of DGE 2H-MRS for non-invasive metabolic phenotyping of glioma using two well-established, immunocompetent mouse models of GBM (GL261 and CT2A), with marked differences in cellular metabolism and histopathologic features.METHODS
GBM tumors vivo and post-mortemAll animal experiments were preapproved by institutional and national authorities, and carried out according to European Directive 2010/63. GBM tumors were induced in C57BL6/j mice by intracranial stereotactic injection of 1E5 glioma cells (GL261, n=7; or CT2A, n=5) in the caudate nucleus [7] and studied 2-3 weeks post-inoculation. MRI/MRS experiments were performed on a 9.4 T scanner (Bruker BioSpec), using a customized 2H/1H transmit-receive surface coilset (NeosBiotec). Fasted mice (4-6h) were cannulated in the tail vein and placed in the animal holder (1-2% isoflurane in 29% O2; rectal temperature 36-37ºC; breathing 60-80BPM. After T2-RARE imaging, pulse-acquire 2H-MRS was prepared (175ms TR, 256 points, 1749 Hz, 51º flip angle) with 6 OVS pulses (10mm slab each) to select only the tumor region [5]. DGE 2H-MRS was acquired with 6,6′-2H2-glucose i.v. bolus (2 g/Kg). Finally, animals underwent DCE-T1 FLASH (8º flip-angle, 16ms TR, 4 averages, 150 repetitions, 1mm slice thickness, 140µm resolution) with Gd-DOTA i.v. bolus (0.1 mmol/Kg). After MR examination, animals were sacrificed (pentobarbital 200mg/Kg i.p.), the brains were removed, washed in PBS and immersed in 4% PFA until paraffin embedding, 1 week later. Samples were sectioned for H&E staining and ki67 immunostaining, and the slices digitalized (Nanozoomer, Hamamatsu).
Glioma cells in situ
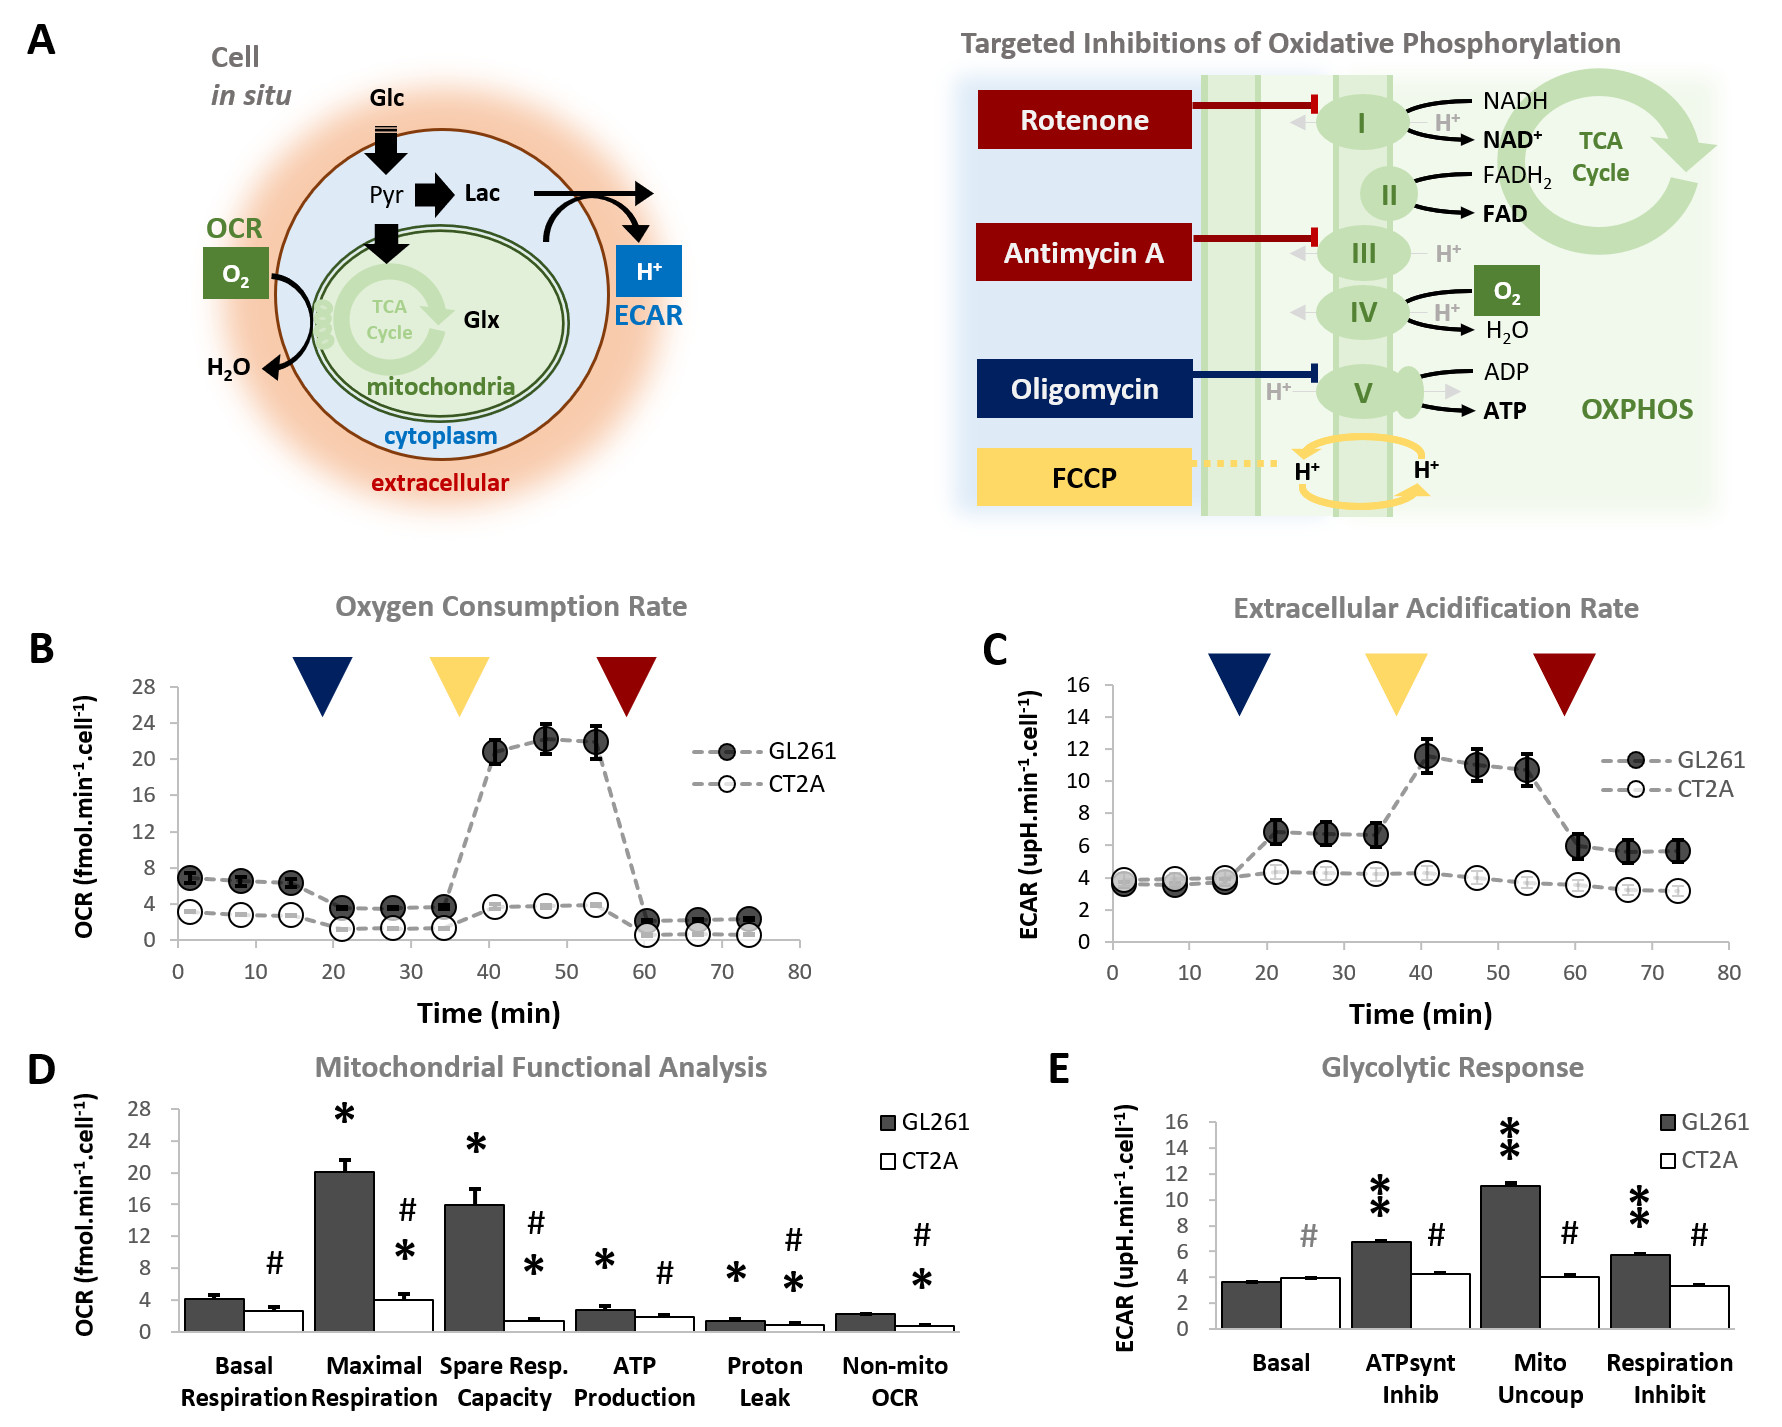
GL261 and CT2A cells (2E4/well) were seeded overnight on Seahorse XFp plates. Experiments were performed using the Mito Stress Test to assess mitochondrial respiration based on oxygen consumption rate (OCR), while also measuring extracellular acidification rate (ECAR).
Data analyses
Seahorse data were processed with Wave Desktop 2.6 (Agilent) and normalized according to total protein content (PierceTM BCA Protein kit, ThermoFisher Scientific). DGE 2H-MRS data were processed in MATLABR R2018b and jMRUI 6.0b. This included Marchenko–Pastur PCA denoising [8], individual peak fitting using AMARES, quantification based on DHO natural abundance (13.88 mM) with T1 and labeling-loss correction [9, 10], and fitting time-course changes with a modified version of a previous model [11] to estimate the kinetic parameters of glucose metabolism. For this, the extracellular volume fraction was fixed based on its estimation from DCE T1-MRI data analysis according to the Extended Tofts model, used to derive Ktrans for assessment of tumor perfusion. This was performed with DCE@urLab [12], by averaging 3 manually delineated slices from each tumor. Histopathological analyses (H&E) were performed independently by an experimental pathologist. Ki67 images were analyzed with QuPath 0.2.3, blindly from DGE 2H-MRS results. For each tumor, at least 6 slices representative of the whole lesion were used for semi-automated counting of ki67+/- cells, the labeling index (LI, +%) calculated for each slice and averaged for each tumor. Data were analyzed using the two-tailed Student’s t-test (* p<0.05, ** p<0.01, *** p<0.001), and plotted as means±SE unless indicated otherwise.
RESULTS
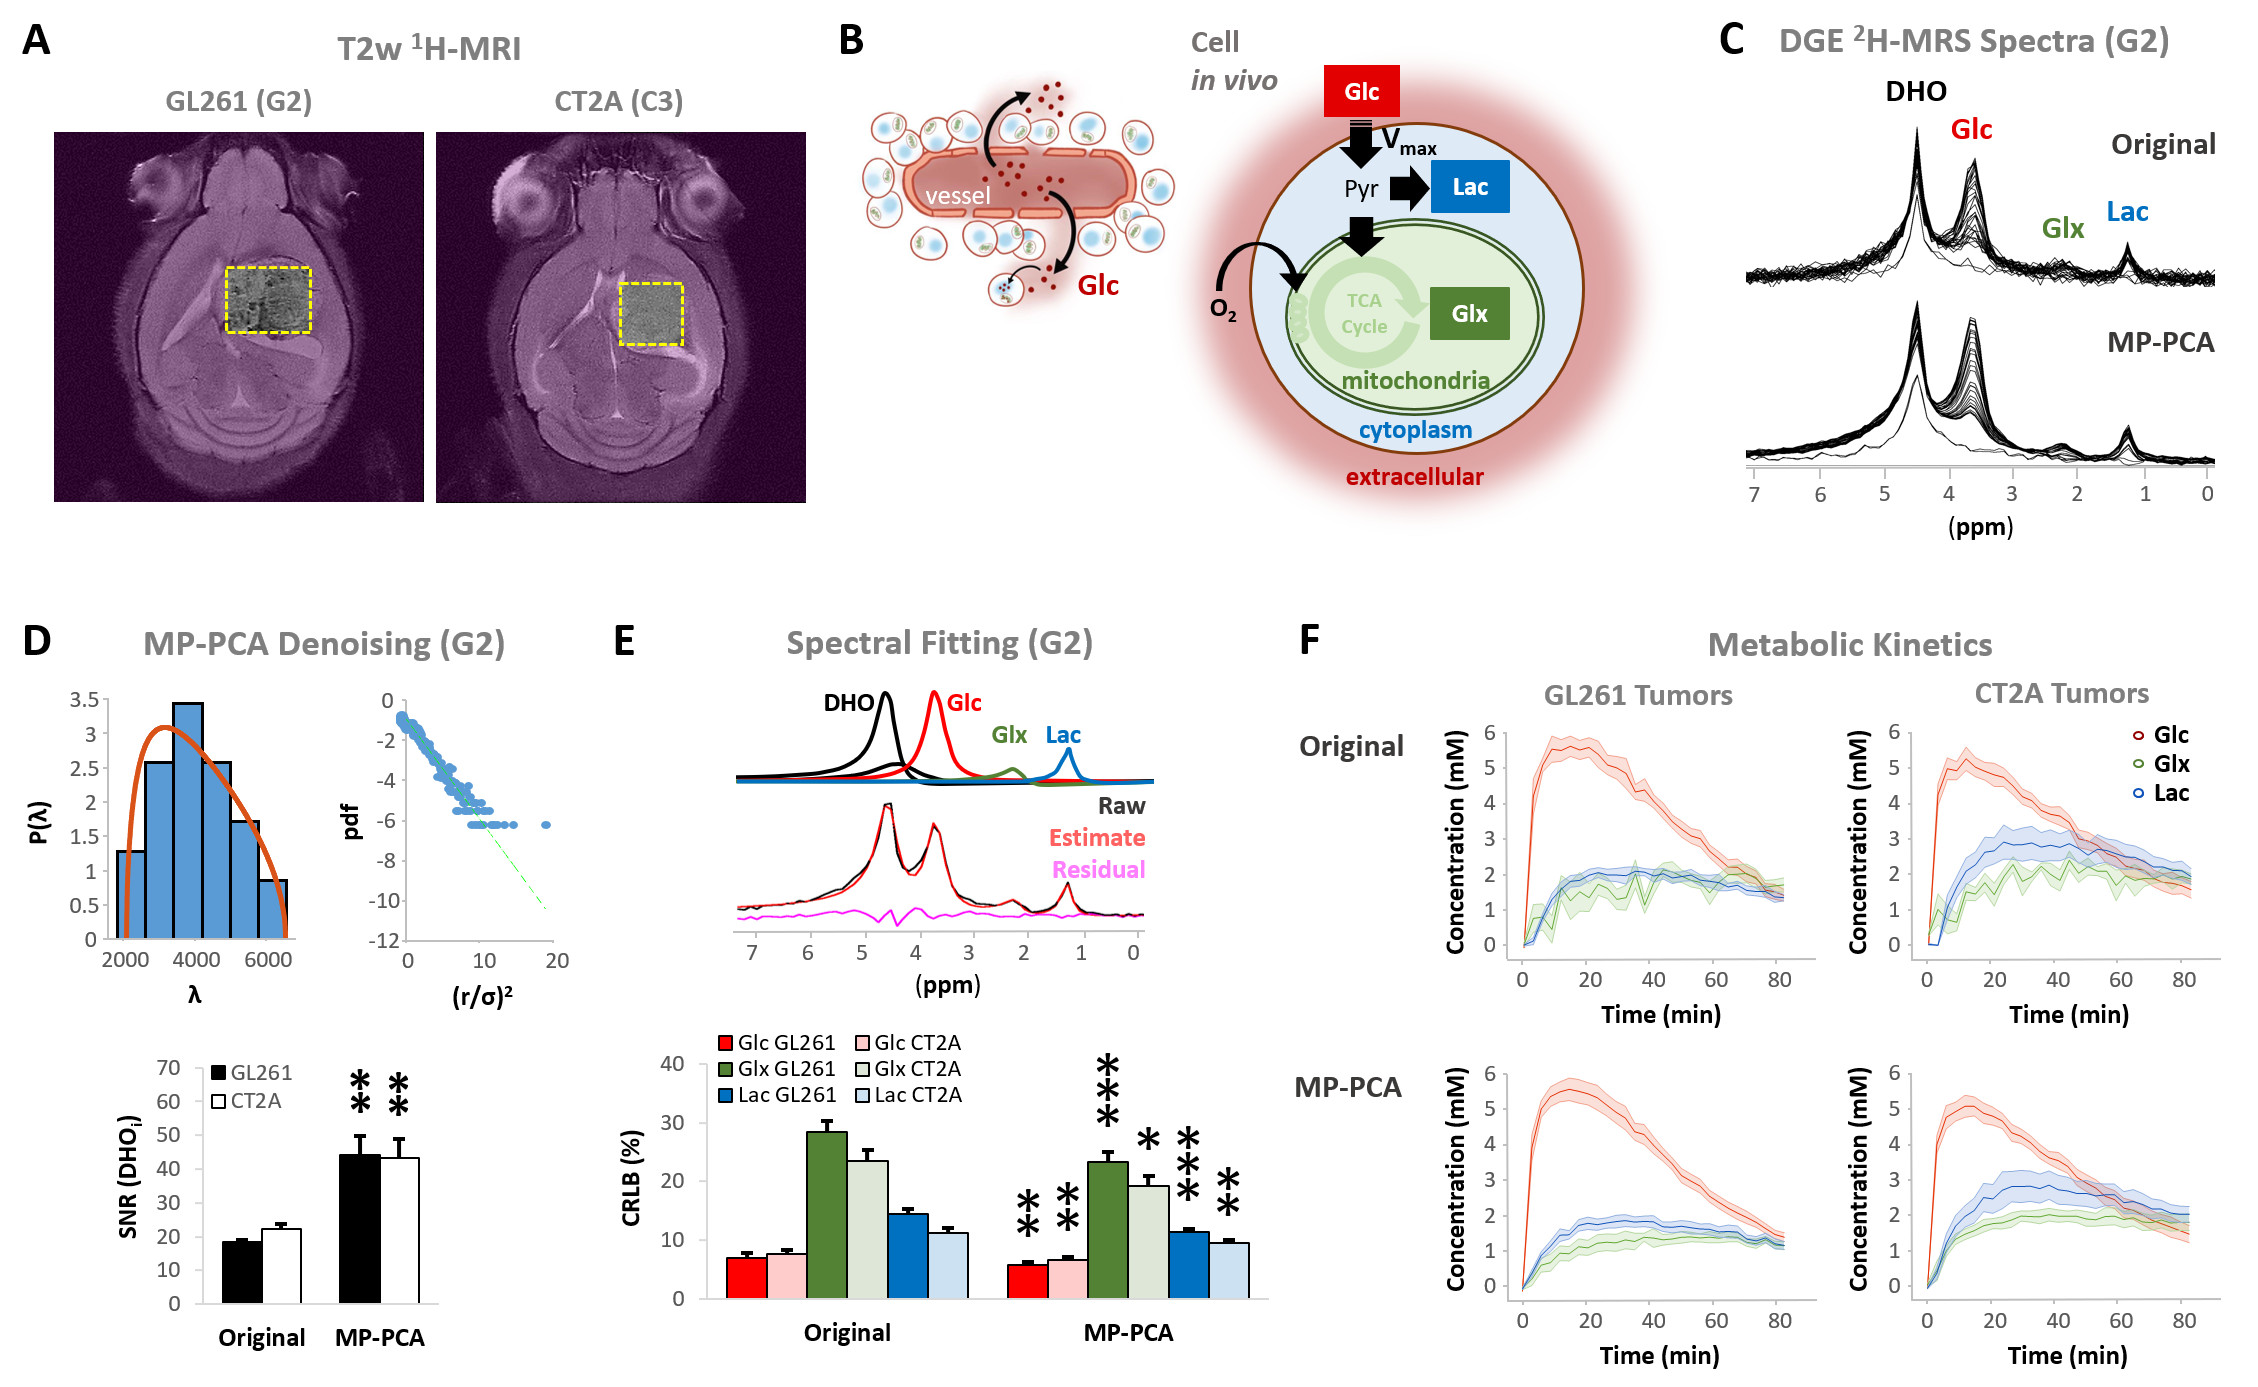
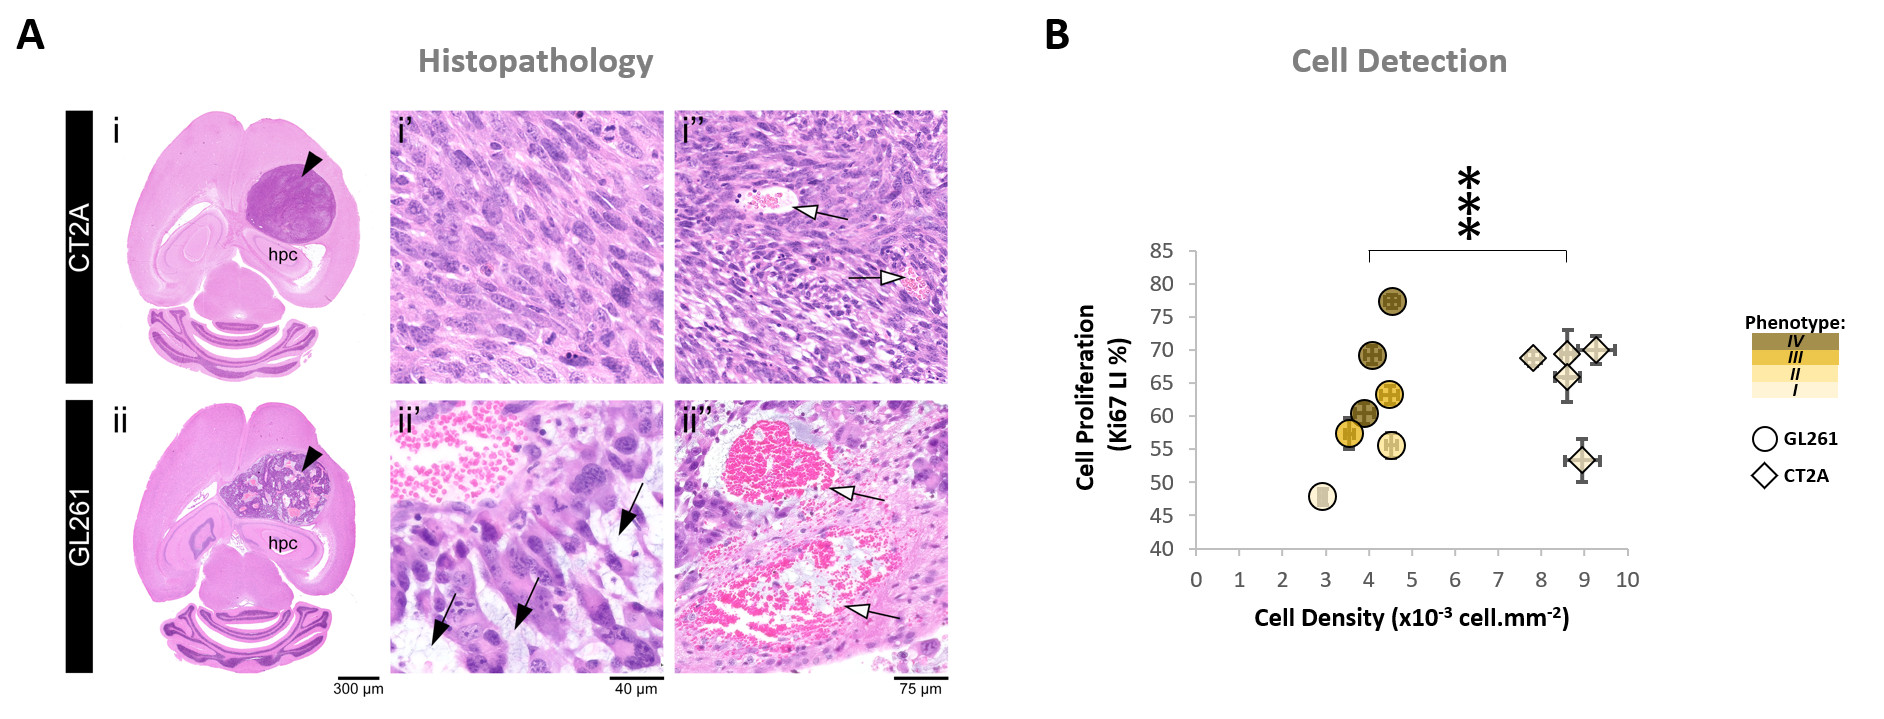
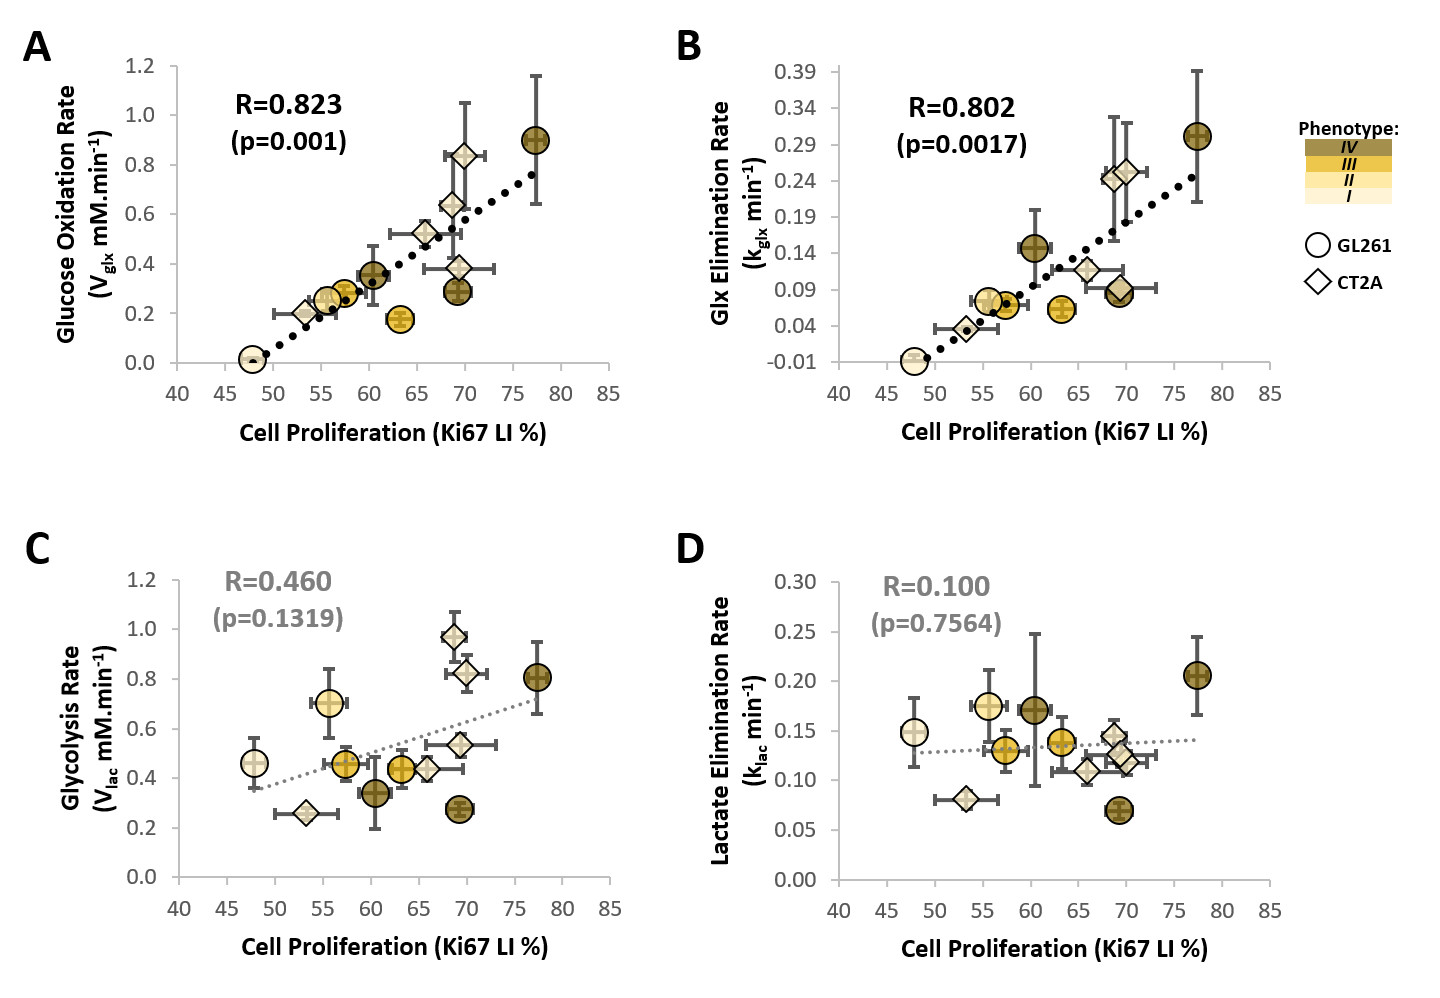
Our results with two mouse GBM cohorts (GL261 and CT2A, 19±1 days post-induction) confirm the relevance of MP-PCA denoising of in vivo DGE 2H-MRS data, by significantly improving the time-course detection (2-fold increased Signal-to-Noise Ratio) and fitting precision (-19±1% Cramér-Rao Lower Bounds) of 2H-labelled glucose, and glucose-derived glutamate-glutamine (Glx) and lactate pools, without altering their kinetics (Fig 1). Kinetic modeling further indicated inter-tumor heterogeneity of glycolytic and glucose oxidation fluxes in both cohorts (Fig 2), with consistent volumes (38.3±3.4 mm3) and perfusion properties (4.8±0.6 10-2.min-1) prior to marked necrosis. Histopathologic analysis of both GBM cohorts further revealed clear differences in vascular-stromal compartments – more heterogeneous and adverse in GL261 (Fig 3) – aligned with functional metabolic differences of the respective cell lines in situ – strong respiration buffer capacity and coupling between mitochondrial oxidation and glycolysis only observed in GL261 (Fig 4). Importantly, glucose oxidation (i.e. Glx synthesis and elimination rates: 0.40±0.08 and 0.12±0.03 mM.min-1, respectively) strongly correlated with cell proliferation across the pooled cohorts (R=0.82, p=0.001; and R=0.80, p=0.002, respectively) (Fig 5).DISCUSSION
In vivo DGE 2H-MRS of immunocompetent mouse glioblastoma subtypes reveals an increased reliance on glucose mitochondrial oxidation according to cell proliferation, regardless of the histopathologic and cellular differences between the two models. Detecting GBM dependencies on oxidative metabolism at any given progression stage could facilitate early treatment assessment, by evaluating the likelihood of response to novel OXPHOS-targeted treatments [13, 14] or the efficiency of chemosensitization to those or other therapies by increasing mitochondrial oxidation [15, 16].CONCLUSION
The potential of DGE 2H-MRS for non-invasive detection of clinically relevant GBM phenotypes, from stratification to early assessment of treatment efficacy, warrants its extension to additional tumor models and even patients.Acknowledgements
This work was supported by H2020-MSCA-IF-2018, ref. 844776 (RVS); and Champalimaud Foundation. The authors thank Dr. Joana Rodrigues for helping with the histology, Dr. Alfredo Caro for facilitating the Seahorse experiments, Dr. Bruno Costa-Silva for access to the BCA Protein kit, Dr. Javier Istúriz for technical support with the deuterium RF coil, Ms. Rita Gil for helping with the figures, and Drs. Sune Jespersen and Jonas Olesen for helping with the denoising algorithm; and the Vivarium of the Champalimaud Centre for the Unknown, a research infrastructure of CONGENTO co-financed by Lisbon Regional Operational Programme (Lisboa2020), under the PORTUGAL 2020 Partnership Agreement, through the European Regional Development Fund (ERDF) and Fundação para a Ciência e Tecnologia (Portugal), under the project LISBOA-01-0145-FEDER-022170.References
1. Maher, E.A., et al., Metabolism of [U-13 C]glucose in human brain tumors in vivo. NMR Biomed, 2012. 25(11): p. 1234-44.
2. Garofano, L., et al., Pathway-based classification of glioblastoma uncovers a mitochondrial subtype with therapeutic vulnerabilities. Nature Cancer, 2021. 2: p. 141-56.
3. Lai, M., et al., In vivo characterization of brain metabolism by (1) H MRS, (13) C MRS and (18) FDG PET reveals significant glucose oxidation of invasively growing glioma cells. Int J Cancer, 2018. 143(1): p. 127-138.
4. Simões, R.V., et al., Dynamic assessment of early metabolic perturbations in glioma-bearing mice using denoised 2H-MRS. Proc Int Soc Magn Reson Med, 2020. 0475.
5. Simões, R.V., et al., Non-invasive assessment of glycolytic and oxidative metabolism in mouse glioma using DGE 2H-MRS. Proc. Intl. Soc. Mag. Reson. Med., 2021. 3718.
6. Simões, R.V., et al., Glucose oxidation rate as a potential marker for GBM staging: correlation with histopathology and cell proliferation in a mouse model. Proc. Intl. Soc. Mag. Reson. Med., 2021. 0768.
7. Simões, R.V., et al., Perturbation of mouse glioma MRS pattern by induced acute hyperglycemia. NMR Biomed, 2008. 21(3): p. 251-64.
8. Veraart, J., E. Fieremans, and D.S. Novikov, Diffusion MRI Noise Mapping Using Random Matrix Theory. Magnetic Resonance in Medicine, 2016. 76(5): p. 1582-1593.
9. De Feyter, H.M., et al., Deuterium metabolic imaging (DMI) for MRI-based 3D mapping of metabolism in vivo. Sci Adv, 2018. 4(8): p. eaat7314.
10. de Graaf, R.A., et al., Characterization of Kinetic Isotope Effects and Label Loss in Deuterium-Based Isotopic Labeling Studies. ACS Chem Neurosci, 2021. 12(1): p. 234-243.
11. Kreis, F., et al., Measuring Tumor Glycolytic Flux in Vivo by Using Fast Deuterium MRI. Radiology, 2020. 294(2): p. 289-296.
12. Ortuno, J.E., et al., DCE@urLAB: a dynamic contrast-enhanced MRI pharmacokinetic analysis tool for preclinical data. BMC Bioinformatics, 2013. 14(1): p. 316.
13. Molina, J.R., et al., An inhibitor of oxidative phosphorylation exploits cancer vulnerability. Nat Med, 2018. 24(7): p. 1036-1046.
14. Shi, Y., et al., Gboxin is an oxidative phosphorylation inhibitor that targets glioblastoma. Nature, 2019. 567(7748): p. 341-346.
15. Michelakis, E.D., L. Webster, and J.R. Mackey, Dichloroacetate (DCA) as a potential metabolic-targeting therapy for cancer. Br J Cancer, 2008. 99(7): p. 989-94.
16. Shen, H., et al., Sensitization of Glioblastoma Cells to Irradiation by Modulating the Glucose Metabolism. Mol Cancer Ther, 2015. 14(8): p. 1794-804.
Figures