0673
The value of water T2 relaxation time in the early detection of neuromuscular diseases: a retrospective biopsy-controlled analysis in 83 patients
Fabian Balsiger1, Noah Locher2, Benedikt Wagner1, and Olivier Scheidegger1,2
1Support Center for Advanced Neuroimaging (SCAN), Institute for Diagnostic and Interventional Neuroradiology, Inselspital, Bern University Hospital, University of Bern, Bern, Switzerland, 2Centre for Neuromuscular Diseases, Department of Neurology, Inselspital, Bern University Hospital, University of Bern, Bern, Switzerland
1Support Center for Advanced Neuroimaging (SCAN), Institute for Diagnostic and Interventional Neuroradiology, Inselspital, Bern University Hospital, University of Bern, Bern, Switzerland, 2Centre for Neuromuscular Diseases, Department of Neurology, Inselspital, Bern University Hospital, University of Bern, Bern, Switzerland
Synopsis
The diagnostic ability of quantitative water T2 mapping using multi-slice multi-echo sequences for the early detection of neuromuscular diseases (NMDs) was compared to fat-suppressed T2-weighted turbo inversion recovery magnitude (TIRM) MRI. Water T2 mapping had a significantly higher sensitivity and diagnostic ability in detecting muscle abnormalities than the subjective grading of TIRM MRI, prior to late-stage fatty infiltration signal alternations in T1-weighted MRI. Normal appearing TIRM MRI does not rule out disease activity in muscles in NMDs. Our findings suggest considering water T2 mapping over TIRM MRI for early detection of NMDs in clinical practice.
Introduction
MRI is a fundamental procedure to diagnose and monitor neuromuscular diseases (NMDs). Late-stage disease manifestation of NMDs such as fatty infiltration can be identified in T1-weighted MRI by hyperintense signals alterations. Similarly, muscle edema, a surrogate marker of early pathological tissue alteration, can be identified in fat-suppressed T2-weighted MRI by hyperintense signal alternations1,2. Beyond qualitative MRI, quantitative MR parameters such as the percentage of fatty infiltration of muscle (fat fraction) and the muscle T2 relaxation time of water (water T2) are well-established MR parameters in NMDs1,2, with the former quantifying disease severity and the latter disease activity. Therefore, water T2 is prolonged by early changes in muscle integrity before fatty infiltration occurs in late disease stages. Early detection of NMDs might be beneficial for clinical care of patients by allowing potential treatment to be initiated before irreversible muscle damage has occurred. Additionally, the diagnostic yield of muscle biopsy could be increased by targeting more suitable muscles for histopathological analysis. Although quantitative water T2 mapping has been studied as a potential biomarker for various NMDs, to the best of our knowledge, studies that determine the value of quantitative water T2 mapping for early detection of NMDs in comparison to a qualitative assessment of fat-suppressed T2-weighted MRI with histopathology as a reference do not exist.Methods
We retrospectively included 83 patients with suspected NMD who underwent multiparametric MRI with a subsequent muscle biopsy between 2015 to 2019 at our department. The imaging included T1-weighted MRI (TR 270 ms, TE 11 ms, FoV read 400 mm, FoV phase 50%, base resolution 384, slice thickness 5 mm), fat-suppressed T2-weighted turbo inversion recovery magnitude (TIRM) MRI (TR 2020 ms, TE 44 ms, FA 140°, TI 200 ms, FoV read 400 mm, FoV phase 50%, base resolution 384, slice thickness 5 mm), and water T2 mapping. Water T2 maps were derived from a multi-slice multi-echo (MSME) pulse sequence with TR 3000 ms, 17 echoes with TE 9.5 ms, 19.5 ms, …, 161.5 ms, FA 180°, FoV read 448 mm, FoV phase 50%, base resolution 320, parallel imaging mode GRAPPA with factor 2, slice thickness 5 mm, 9 slices. The exponential decay of the signal was fitted voxel-wise using an extended phase graph (EPG)-derived signal model3. All imaging was performed at 3T on a Siemens MAGNETOM Skyrafit (Siemens Healthineers, Erlangen, Germany).The biopsied muscle of each patient was graded in the T1-weighted and TIRM MRI by two blinded neuroradiologists to be either pathological (i.e., hyperintense signal noticeable) or normal. Mean and median water T2 were calculated from manually drawn regions of interest (ROIs) in the biopsied muscle on nine consecutive image slices of the water T2 maps. For a comparison to the grading of the weighted images, the muscles were categorized as pathological or normal using a cut-off value of ≥35 ms3. Histopathology of the biopsies was used as a reference method categorized into five histopathologic patterns: neurogenic, inflammatory, myopathic, unspecific, and normal. Statistical analyses were performed to assess the ability of water T2 mapping to detect early changes in NMDs compared to TIRM MRI.
Results
Exemplary T1-weighted images, TIRM images, and water T2 maps of two patients are shown in Figure 1. In our cohort, 36 patients showed clear late-stage fatty infiltration based on T1-weighted imaging, which were excluded in subsequent statistical analysis. In the remaining 47 patients without late-stage changes, subjective grading of TIRM MRI achieved a sensitivity of 55.3 %, and quantitative mean and median water T2 a sensitivity of 86.8 % and 97.4 % to detect early changes in NMDs (Figure 2). Receiver operating characteristic (ROC) analysis revealed an area under the curve (AUC) of 0.665, 0.699, and 0.801 for TIRM MRI, mean water T2, and median water T2 (Figure 3). Box-and-whisker plots of the water T2 values grouped by histopathologic patterns are shown in Figure 4. The differences in mean and median water T2 are associated with an asymmetric distribution of water T2 in the ROIs of the muscles, which were drawn on nine consecutive image slices, resulting in a more robust median water T2 measure.Discussion & Conclusion
We determined the value of quantitative water T2 mapping for the early detection of NMDs compared to subjective grading of TIRM MRI with histopathology as a reference. The median water T2 had a significantly higher sensitivity and diagnostic ability in detecting muscle abnormalities than the subjective grading of weighted TIRM MRI, prior to visible signal alternations in T1-weighted MRI. Therefore, normal-appearing TIRM MRI does not rule out disease activity in muscles. The added value was especially noticed in cases of either borderline elevation of water T2, or homogenous elevation of water T2 in all muscles of an anatomical region4. In conclusion, our findings suggest considering water T2 mapping over TIRM MRI for early detection of NMDs in clinical practice.Acknowledgements
No acknowledgement found.References
1. Carlier PG, Marty B, Scheidegger O, et al. Skeletal Muscle Quantitative Nuclear Magnetic Resonance Imaging and Spectroscopy as an Outcome Measure for Clinical Trials. J Neuromuscul Dis. 2016;3(1):1–28.2. Paoletti M, Pichiecchio A, Cotti Piccinelli S, et al. Advances in Quantitative Imaging of Genetic and Acquired Myopathies: Clinical Applications and Perspectives. Front Neurol. 2019;10:78.
3. Marty B, Baudin P-Y, Reyngoudt H, et al. Simultaneous muscle water T2 and fat fraction mapping using transverse relaxometry with stimulated echo compensation. NMR Biomed. 2016;29(4):431–443.
4. Carlier PG, Azzabou N, de Sousa PL, et al. Diagnostic role of quantitative NMR imaging exemplified by 3 cases of juvenile dermatomyositis. Neuromuscul Disord. 2013;23(9-10):814.
Figures
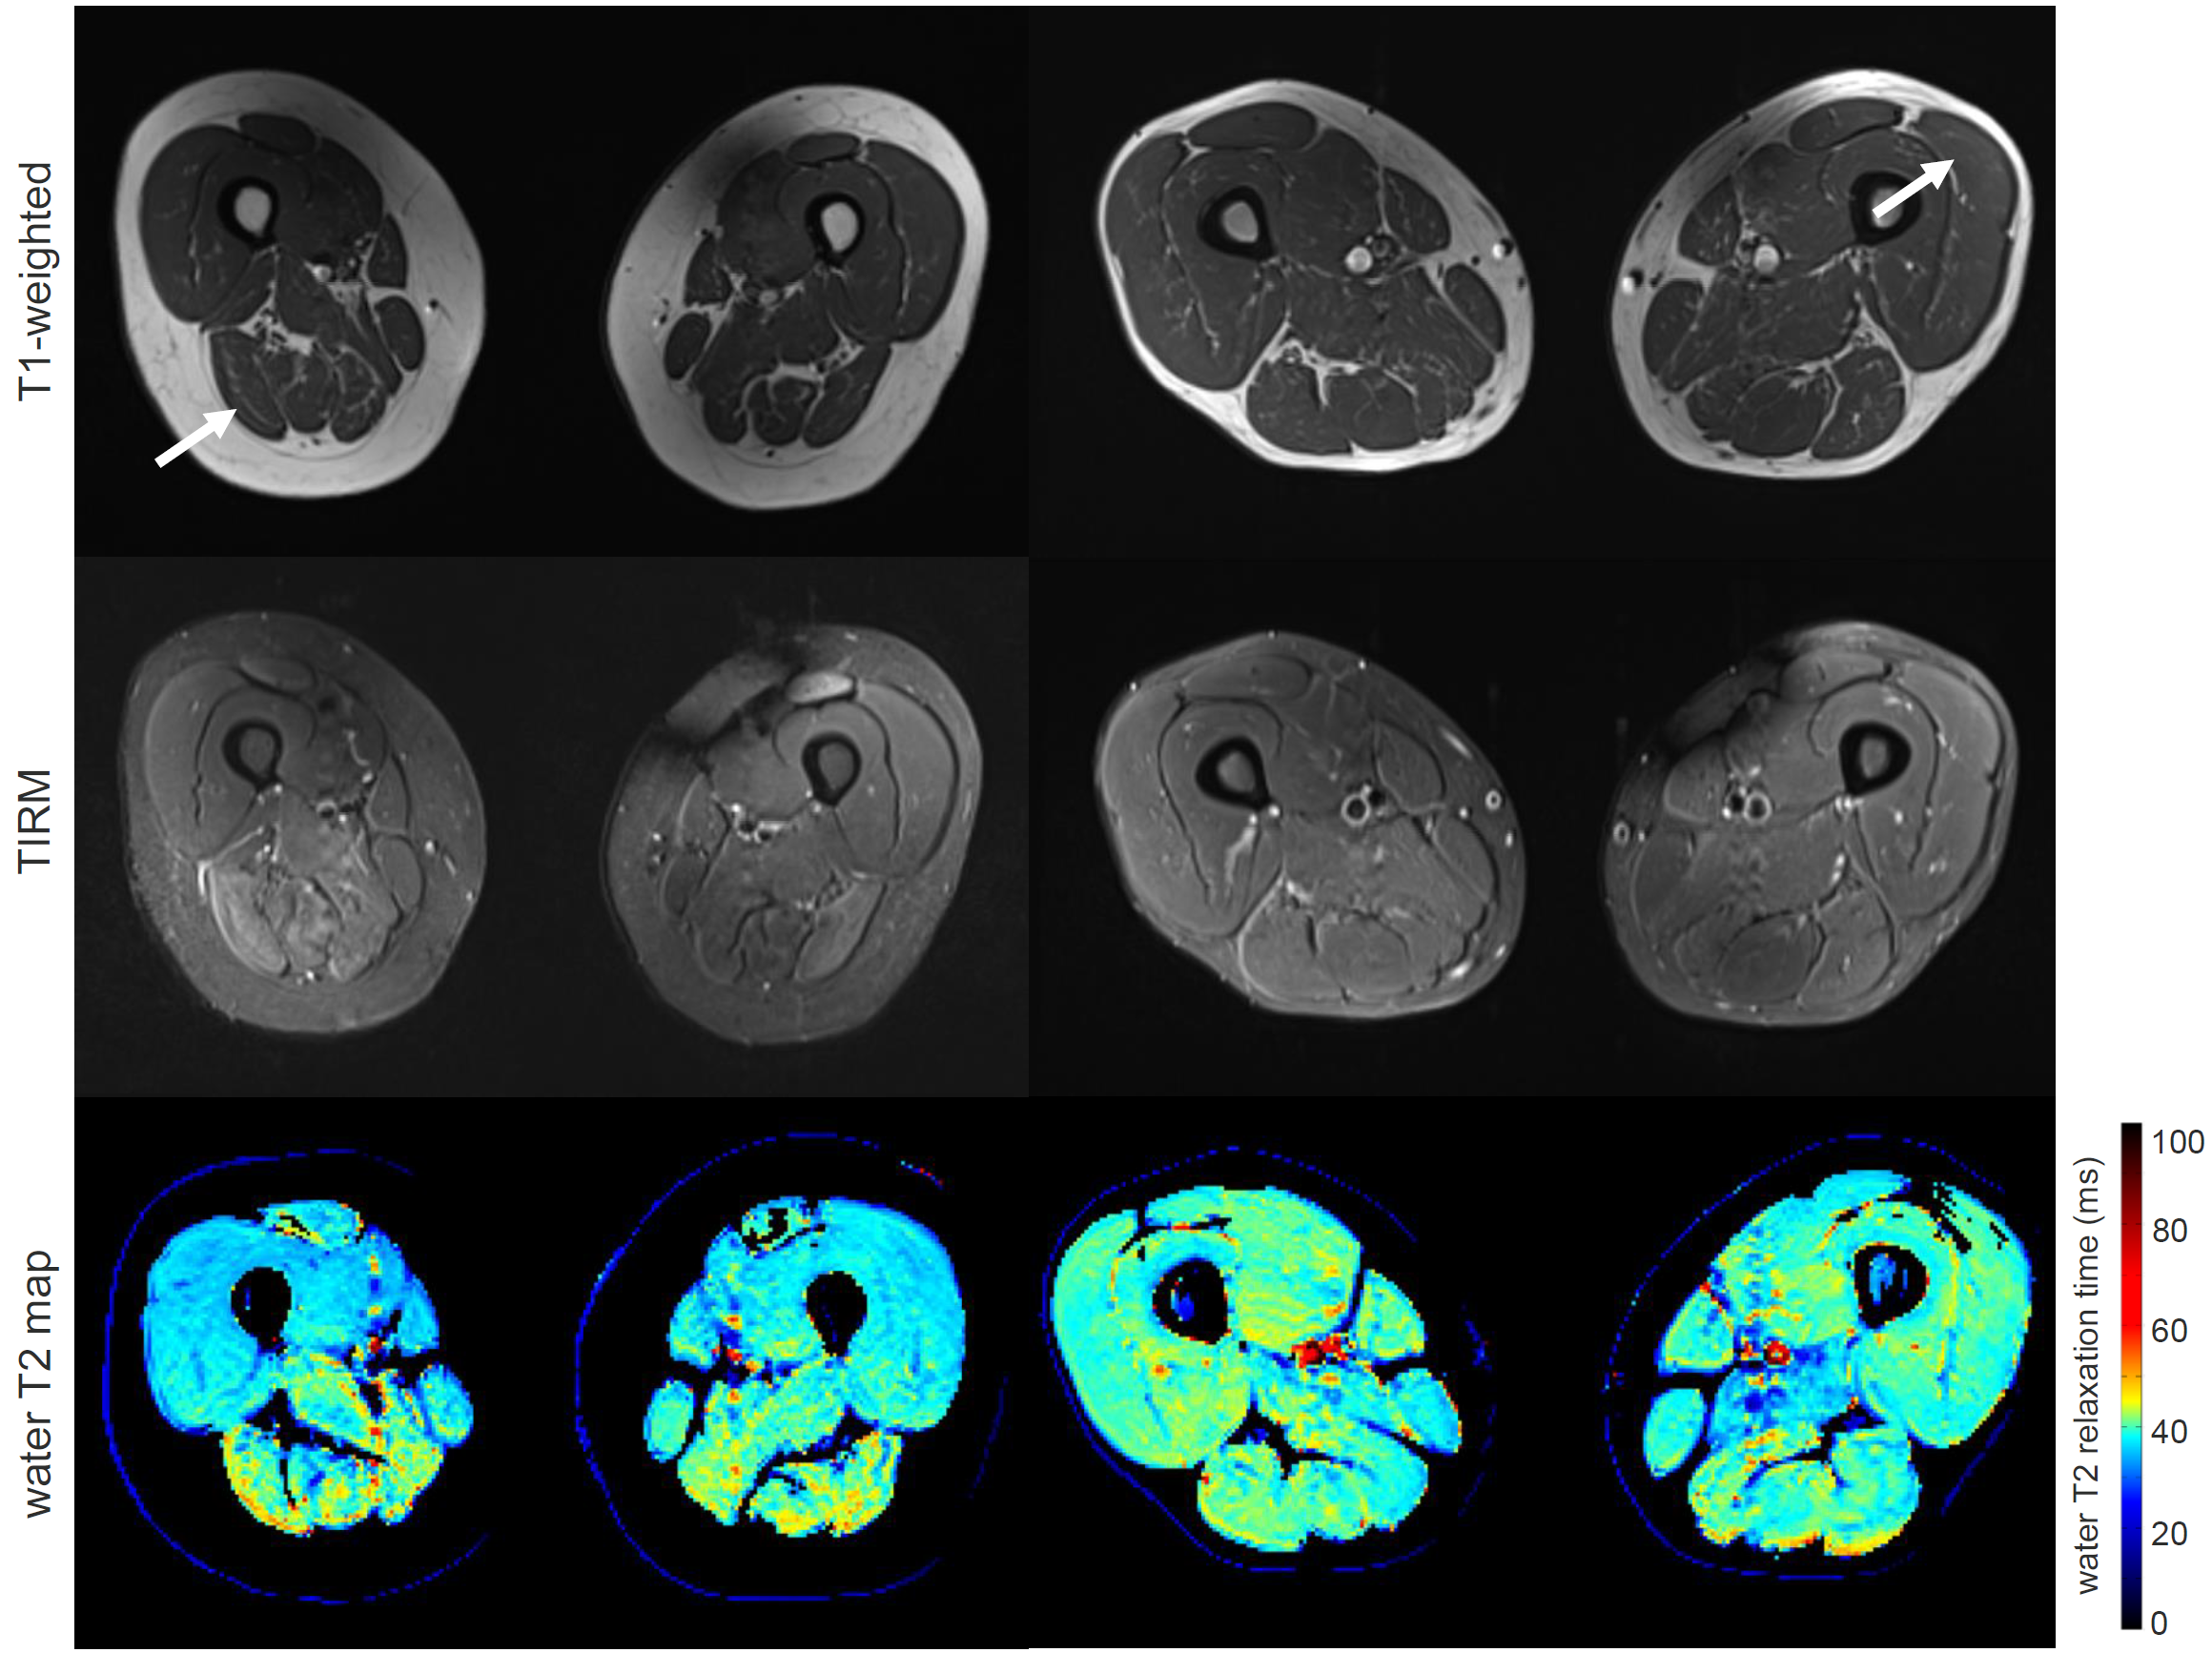
Images from T1-weighted MRI, TIRM MRI, and water T2 mapping
(top to bottom) of two patients. In both patients, T1-weighted MRI is normal.
(left) Patient with statin-induced necrotizing myopathy (female, 86y) showing
hyperintense signal alternations in TIRM MRI and prolonged water T2 in the
right biceps femoris caput longum muscle. (right) patient with necrotizing
autoimmune myopathy (male, 54y) showing no signal alternations in the
T1-weighted and TIRM MRI but prolonged water T2 in the left vastus lateralis
muscle. Arrows indicate the muscle used for the analysis.
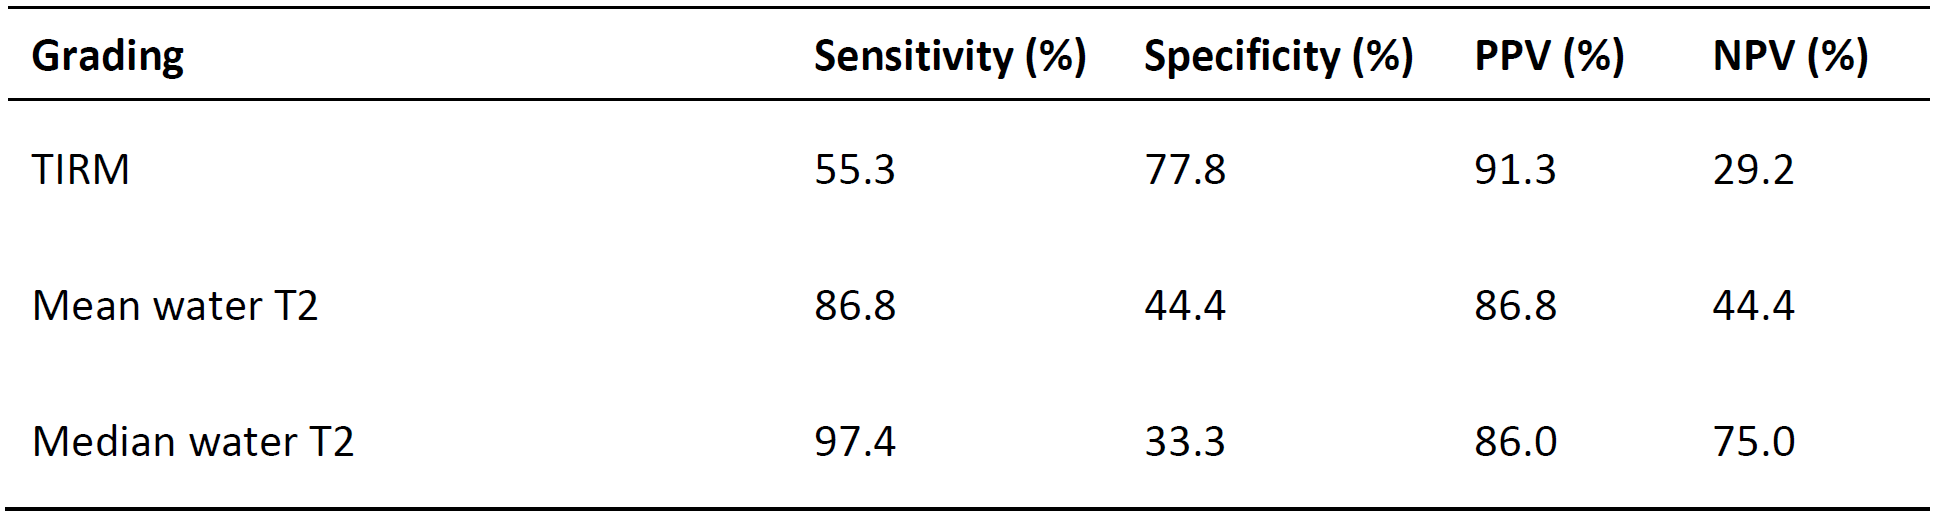
Diagnostic performances in terms of sensitivity, specificity, positive predictive value (PPV), and negative predictive value (NPV) for the gradings fat-suppressed T2-weighted based on turbo inversion recovery magnitude (TIRM) imaging, mean water T2, and median water T2.
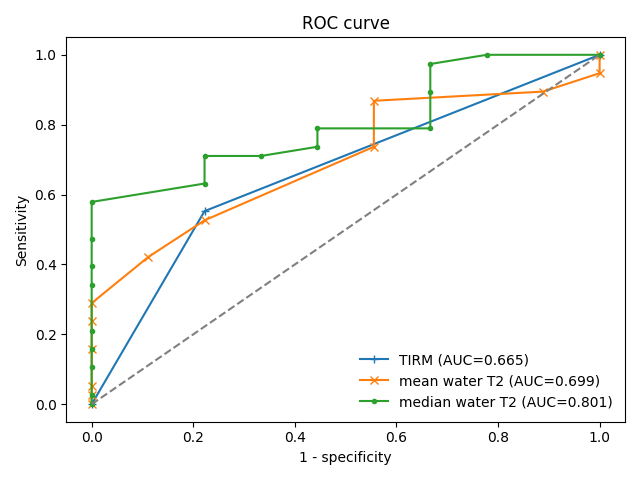
Receiver operating characteristic (ROC) curves for turbo inversion recovery magnitude (TIRM) imaging, mean water T2, and median water T2 gradings. AUC: Area under the curve.
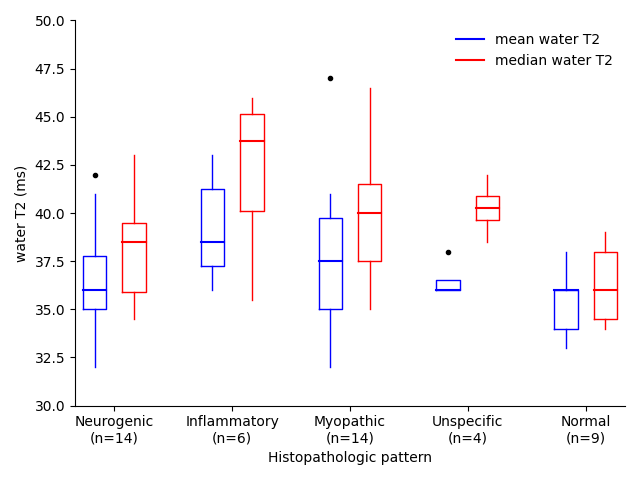
Box-and-whisker plots of the mean and median water T2 in the ROIs of the patients without late-stage changes (n=47) grouped by the histopathologic patterns neurogenic, inflammatory, myopathic, unspecific, and normal.
DOI: https://doi.org/10.58530/2022/0673