0672
Strain rates along the fiber are heterogeneously distributed over the length of lower leg muscles during dynamic exercise1Radiology and Nuclear Medicine, Amsterdam University Medical Centers, Amsterdam Movement Sciences, Amsterdam, Netherlands, 2C.J. Gorter Center for High Field MRI, Department of Radiology, Leiden University Medical Center, Leiden, Netherlands, 3Department of Radiology, Stanford University, Stanford, CA, United States, 4Department of Radiology, Leiden University Medical Center, Leiden, Netherlands, 5Department of Rehabilitation Medicine, Leiden University Medical Center, Leiden, Netherlands, 6Department of Biomedical Engineering and Physics, Amsterdam Movement Sciences, Amsterdam University Medical Center, Amsterdam, Netherlands, 7Duchenne Center Netherlands, Leiden, Netherlands
Synopsis
In this study we assessed strain rates along and close to perpendicular to the fiber in the lower-leg muscles, by combining 3D phase contrast with DTI-derived fiber orientations, during dynamic exercise with and without load. Our data revealed spatially heterogeneous strain rate patterns along the fiber within lower-leg muscles, with smallest and largest strain rates in the most proximal and distal segments of the Gastrocnemii muscles, respectively, and opposed (expansion and contraction) strain rate patterns between some of the Tibialis Anterior (TA) muscle compartments. Additional loading resulted in higher strain rates in TA compartments but lower in the Gastrocnemii muscles.
Introduction
Quantitative MRI provides essential readouts of structural changes in diseased muscle1,2. Often these structural changes are irreversible, reflect an advanced disease state and provide limited information on muscle function. Assessments of muscle strain using phase-contrast MRI could provide functional muscle dynamics but lack the 3D information needed to fully comprehend the complex strain distributions3,4. Moreover, to understand muscle function, strain distributions need to be aligned with muscle-fiber architecture, which can be assessed using Diffusion Tensor Imaging (DTI)5,6. The goal of this study was to assess strain rates along and close to perpendicular to the fibers in lower-leg muscles by combining 3D phase-contrast with DTI-derived muscle architecture during dynamic exercise with and without load.Methods
MRI was performed in the lower leg of 12 healthy volunteers (age:31.6±15.9 years; 50% m) at 3T (Philips, Ingenia) and consisted of 3D 6-point Dixon (TR/TE/∆TE 7.8/1.27/1.1/3ms; voxel-size =1x1x3mm3) for muscle segmentation, DTI (fat-suppressed SE-EPI; TR/TE 6123/48ms; b-values: 0(4), 400(19) s/mm2; voxel-size 3x3x6mm3) to assess fiber directions and two 3D-PC-MRI acquisitions to retrieve velocity information during dorsi-/plantarflexion movements, with and without load (VENC=10cm/s; 20 time-points, voxel-size=3x3x6mm3; scan duration=432s (216 motion-task repetitions)). 3D-PC-MRI data were acquired by incoherently undersampling k-space based on a pseudo-spiral pattern (R=9.1)8,9. The applied load was 7.5% of maximum voluntary contraction force, which was measured prior to scanning as the highest value of three contractions for dorsi-flexor muscles using a handheld dynamometer. A schematic drawing of the exercise set-up is shown in Figure 1.Data-analysis
Volumes of interest (VOIs) were drawn on the Dixon water images along the full length of the Gastrocnemius Medialis and Lateralis (GM & GL), and individual compartments of the Soleus (SOLpl, SOLpm, SOLam and SOLal) and Tibialis Anterior (TAsup, TAdeep and TAwhole) muscles (Figure 2). These images were subsequently registered to individual time-points of the magnitude images of the PC-MRI and DTI (b=0) using 3D-Demons7. The deformation matrices were used to register the VOIs. PC-MR images were reconstructed using Compressed Sensing8 (BART9), after which the infinitesimal strain-rate tensor was calculated (Fig.2). The diffusion tensor was calculated, diagonalized and used to calculate strain rates along (SRalong) and close to perpendicular to the fibers (SRLR and SRAP) on a voxel-by-voxel basis (Fig.2). Weighted average and standard deviations were calculated for all VOIs over the motion cycle for the five segments (distal (0-20%) to proximal (80-100%)). Repeated measures ANOVAs with Bonferroni correction (p-value≤0.002) were used to assess the effect of load and proximal-distal location on strain rates. In this abstract we restrict ourselves to a discussion on strain rates along the fiber.Results
A main effect for proximal-distal location (p<.0001) was found in TAwhole and TAsup compartments for strain rates, with negative strain rates (local contraction) in the proximal segment of the TAwhole and the two most proximal segments of the TAsup, as expected during dorsi-flexion. Positive strain rates (local expansion) were found in the most distal segments of both compartments (Table.1; Fig.3). In the loaded condition, the TAwhole showed larger positive strain rates in the distal segment and slightly smaller negative strain rates in the proximal segment (p=.001), whereas in the TAsup, strain rate was not different between the two conditions (Table.1; Fig.3). The TAdeep showed differences between segments in the unloaded condition (p<.0001) with larger negative strain rates distally compared to proximally. A main effect for proximal-distal location (p<.0001) and load (p<.0001) was found in the GL and GM muscles for strain rates, showing larger positive strain rates distally compared to proximally in both conditions during dorsiflexion (Table.1; Fig.4). In the loaded condition, overall smaller strain rates were found in the GL and GM muscles. Negligible effect of proximal-distal location or load was found for strain rates along the fiber in the SOL compartments for both conditions.Discussion
We show spatially heterogeneous strain-rate patterns along the length of the lower leg muscles during both unloaded and loaded dorsi-/plantarflexion exercise. Strain rates along the fibers varied in magnitude and pattern among the individual segments and between TA compartments. The majority of segments of the TA compartments, showed negative strain rates during dorsi-flexion, which agreed with previous studies 10,11. The positive strain rates during dorsiflexion suggest local expansion in the distal segments of some of the TA compartments. Possible explanations are the activation of more motor-units in the muscle belly, creating a pulling effect distally and/or an effect of inter- and extra-muscular myofascial force transmission 12,13. In the GL and GM muscles, strain rates along the fiber showed a consistent pattern, with the smallest and largest strains in the most proximal and distal segments. This observed spatial pattern is consistent with part of the 2D-PC work shown before14,15. Factors that may explain this heterogeneity are: small muscle CSA, fascicle lengths, curvature, and the extracellular matrix10,14-17. With load, lower strain rates were seen in the GL and GM muscles. This could be related to how load was applied to the ankle, triggering an eccentric contraction (local expansion) of the TA muscle which can result in a lower activity in the GL and GM muscles.Conclusion
The combination of 3D phase-contrast and DTI showed spatio-temporal strain rate heterogeneity along muscle fibers within lower leg muscles during dynamic exercise.Acknowledgements
No acknowledgement found.References
1] Carlier P. Marty B, Scheidegger O. et al Skeletal Muscle Quantitative Nuclear Magnetic Resonance Imaging and Spectroscopy as an Outcome Measure for Clinical Trails. J Neuromus Dis. 2016; 3(1)1-28.
2] Strijkers GJ, Ericky CA, Azzabou N. et al. Exploration of New contrasts, targets and MR imaging and Spectroscopy Techniques for Neuromuscular Disease – A workshop report of working group 3 of the Biomedicine and Molecular Biosciences COST Action BM1304 MYOMRI. J Neuromuscul Dis. 2019; 6(1): 1-30.
3] Drace JE, Pelc NJ. Measurement of Skeletal muscle motion in vivo with Phase-contrast MR imaging. J Magn Reson Imaging 1994, Mar-Apr;4(2):157-63
4] Csapo R, Malis V, Hodgson J, Sinha S. Age-related greater achilles tendon compliance is not associated with larger plantar flexor mucle fascicle strains in senior woman. J Apply Physiol 2014; Febr 116, 961-969.
5] Heemskerk AM, Damon BM. Diffusion Tensor MRI Assessment of Skeletal Muscle Architecture. Curr Med Imaging Rev. 2007; 3(3):152-160.
6] Damon BM, Froeling M. Buck AKW. Skeletal Muscle DT-MRI Fiber Tracking: Rationale, Data-acquisition and Analysis Methods, Applications, and Future Directions. NMR Biomed 2017; Mar; 30(3).
7] Thirion JP. Image matching as a diffusion process: an analogy with Maxwell’s Demons. Medical Image Analysis. 1998, Sep;2(3):243-60.
8] Gottwald LM, Peper ES, Zhang Q, Coolen BF, Strijkers GJ, Nederveen AJ, van Ooij P. Pseudo-sprial sampling and compressed sensing reconstruction in accelerated aortic 4D flow MRI: a comparison with k-t principal component analysis. NMR in Biomedicine 2020; Apr;33(4):e4255
9] Uecker, Martin, et al. "Berkeley advanced reconstruction toolbox." Proc. Intl. Soc. Mag. Reson. Med. 2015; Vol. 23.
10] Englund EK, Elder Cp, Xu Q et al. Combined diffusion and strain tensor MRI reveals a heterogeneous, planar pattern of strain development during isometric muscle contractions. Am J Physiol Regul Integr Comp Physiol 2011, Jan;26:1079-1090.
11] Mazzoli V, Gottwald LM, Peper ES et al. Accelerated 4D Phase Contrast MRI in skeletal muscle contractions. Magn Reson Med. 2018, Nov;80(5):1799- 1811
12] Yucesoy CA, Koopman BH, Baan GC, Grootenboer HJ, Huijing PA. Extramuscular myofascial force transmission: experiments and finite element modelling. Arch Physiol Biochen. 2003
13] Maas H, Baan GC Huijing PA. Intermuscular interaction via myofascial force transmission: effects of tibialis anterior and extensor halluces longus length on force transmission from rat extensor digitorum longus muscle. J Biomech 2001; Jul;34(7):927-40.
14] Shin DD, Hodgson JA, Edgerton VR et al. In vivo intramuscular fascicle-aponeuroses dynamics of the human medial gastrocnemius during plantarflexion and dorsalflexion of the foot. J appl Physiol 2009, 107:1276-1284.
15] Malis V. Sinha U. Csapo R, Narici M, Sinha S. Relationship of changes in strain rate indices estimated from velcotiy encoded MR imaging to loss of muscle force following disuse atrophy. Magn Reson Med. 2018 Feb;79:912-922. Doi 10.1002/mrm/26759
16] Sinha U, Malis V, Chen JS, Csapo R, Kinugasa R, Narici V, Sinha S. Role of the extracellular matrix in loss of muscle force with age and unloading using Magnetic Resonance Imaging, Biochemical Analysis and Computational Models. Front Physiol. 2020; Jun 18;11:626
17] Blemker SS, Delp SL. Three-dimensional representation of complex architectures and geometries. Ann Biomed Eng 2005; May;33(5):661-73.
Figures
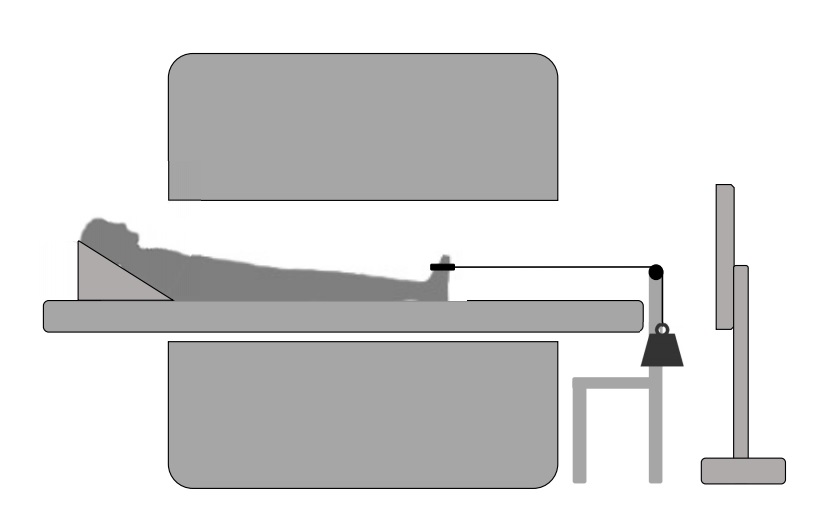
Figure 1. A schematic overview of the exercise set-up. Showing the scanner, the participant positioning together with the exercise set-up and screen used to provide visual feedback to the participants. The participant were asked to perform a dynamic dorsi- plantar flexion movement every 2 seconds, starting in plantar flexed position. For the load condition, a weight (7.5% of maximum voluntary contraction force) was attached to the ankle by a strap on the dorsal side of the foot.

Figure 2. An overview of the post-processing steps to calculate strain rates along and close to perpendicular to the fibers for the individual lower-leg muscles and compartments (i.e. Gastrocnemius Medialis (purple), Gastrocnemius Lateralis (dark green), Soleus posterior lateral compartment (bright green), soleus posterior medial compartment (red), soleus anterior lateral compartment (yellow), soleus anterior medial compartment (dark blue), Tibialis Anterior superficial compartment (pink) and the Tibialis Anterior deep compartment (light blue)).
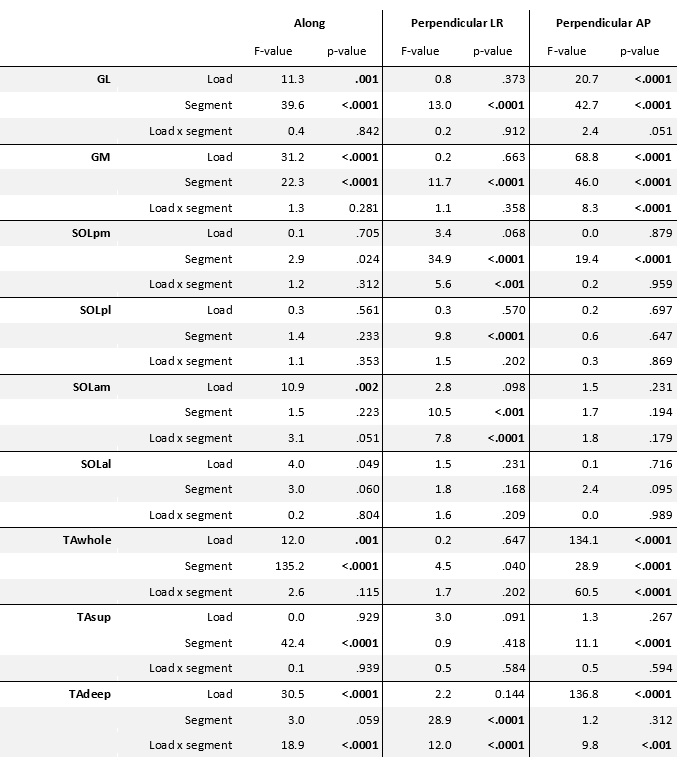
Table 1. Summary of repeated measures ANOVA results. The top part of the table reports the F-values and p-values for the main effects of condition (load), proximo-distal location (segment) and the interaction effect on strain rates along and close to perpendicular to the fiber during dorsi- and plantarflexion motion for the individual muscles and muscle compartments. Significant differences are indicated in bold.
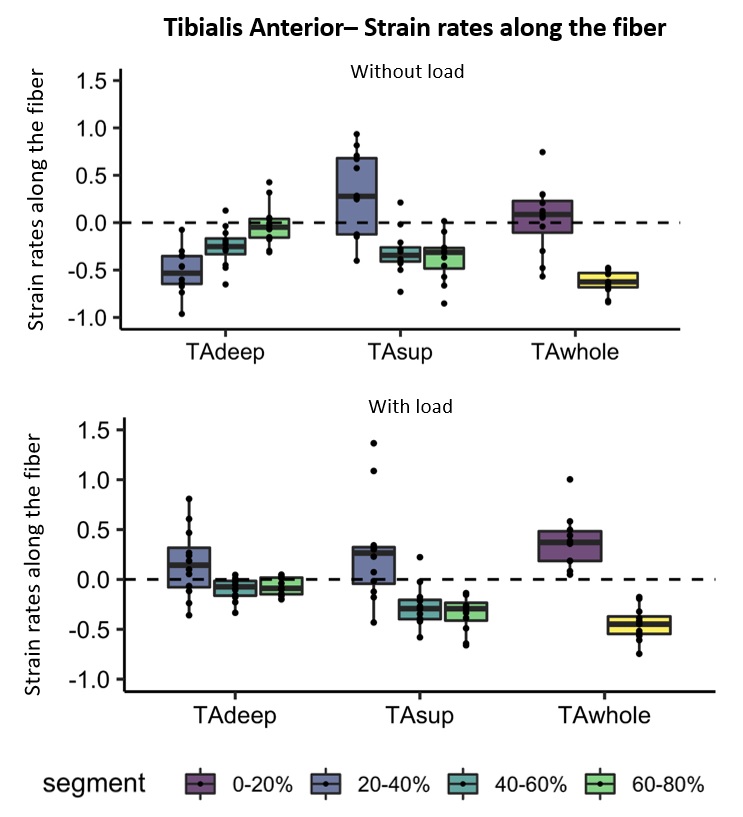
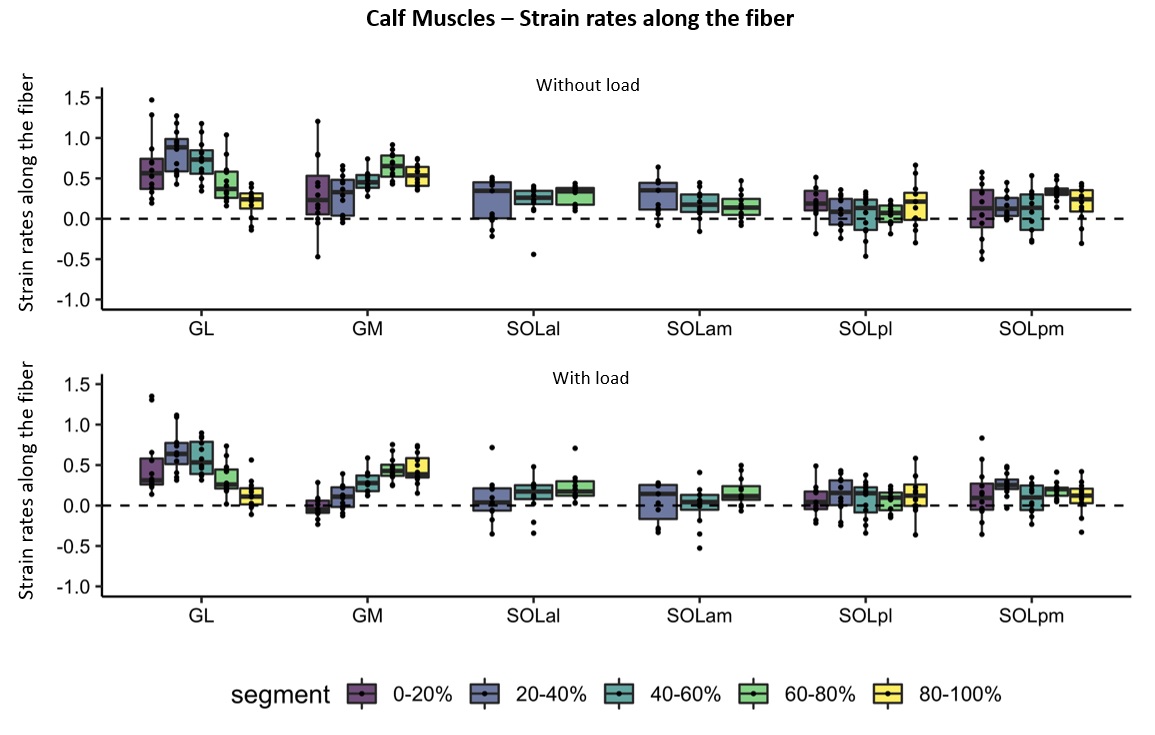
Figure 4. Box plots showing strain rates along the fiber during maximum dorsi-flexion phase without (top) and with load (bottom) for the individual lower-leg muscles and compartments of the Calf (GL, GM, SOLal, SOLam, SOLpl and SOLpm).The five segments are indicated different colors. The individual subjects are indicated with black dots. Note the almost absent strain rates in the compartments of the soleus muscle (SOLal, SOLam, SOLpl and SOLpm) and the heterogeneity in strain rates between segments in the GM and GL muscle.