0671
Quantitative MRI Analysis of Muscle Denervation1Weill Cornell Medical College, New York, NY, United States, 2Hospital for Special Surgery, New York, NY, United States
Synopsis
Macroscopic muscle volume evaluation and quantitative MRI of diffusion microstructure may provide objective, longitudinal assessment of muscle denervation. Analysis of subjects with Parsonage-Turner syndrome (neuralgic amyotrophy) showed both reduced muscle volume and reduced muscle diameter. Macroscopic muscle volume demonstrated a strong positive correlation with microscopic diffusion-based muscle diameter, and a strong negative correlation with T2-mapping. Denervated muscles exhibited longitudinal changes in quantitative MRI metrics, whereas non-denervated (control) muscles showed minimal quantitative changes.
Introduction
Parsonage-Turner syndrome (PTS or neuralgic amyotrophy) is a spontaneous, upper-extremity predominant neuropathy resulting in severe weakness secondary to muscle denervation1. Such denervation leads to muscle atrophy2, chronic fatty infiltration3, and subsequent increases in transverse relaxation (T2) due to increased extracellular fluid space4. Quantitative MRI methods—T2-mapping5 and diffusion-based apparent fiber diameter (AFD)6 — provide objective and quantitative evaluation of muscle denervation, and may apply to patients with PTS. Additionally, macroscopic muscle volume measurement may provide improved characterization of muscle health7. The goals of this work were to (1) evaluate relationships between macroscopic muscle volume and microscopic diameter and T2 measurements; and to (2) provide longitudinal, quantitative evaluation of macroscopic and microscopic muscle changes in patients with PTS. We hypothesize that macroscopic muscle volume would correlate with microscopic diameter and T2 measurements in denervated muscles.Methods
As part of a longitudinal study of PTS, eight out of a targeted 50 subjects (5 males, 3 females; mean age, 37 years; age range, 19-60 years) with a positive diagnosis of PTS within 6 months of symptom onset have been recruited prospectively under an approved IRB for baseline MRI and subsequent MRIs after 3, 6 and 12-months (total n=23 scans: 2 subjects completed 4 scans, 4 subjects completed 3, 1 subject completed 2).Denervation was determined by both electromyography (EMG) and diffuse edema pattern on T2-weighted Dixon water images. Subjects had denervation within either or both the supraspinatus and deltoid muscles, and no denervation was present within the subscapularis (n=69 muscles analyzed: 39 non-denervated and 30 denervated). MRI was performed on a 3-Tesla system (Signa Premier, GE Healthcare) utilizing two 16-channel flexible coil arrays. Apparent fiber diameter (AFD) was calculated from a multi-shell DTI (FOV=27 cm, TR/TE/ESP=3300/56/0.6 ms, mixing time=19.5-22.7 ms, 2-shots, b-values=375 s/mm2 and 750 s/mm2, 3 mm-isotropic, 35-38 slices). T2-maps were obtained with an 8-echo 2D fast-spin-echo (FSE) sequence (TR/ESP=3000/11 ms).
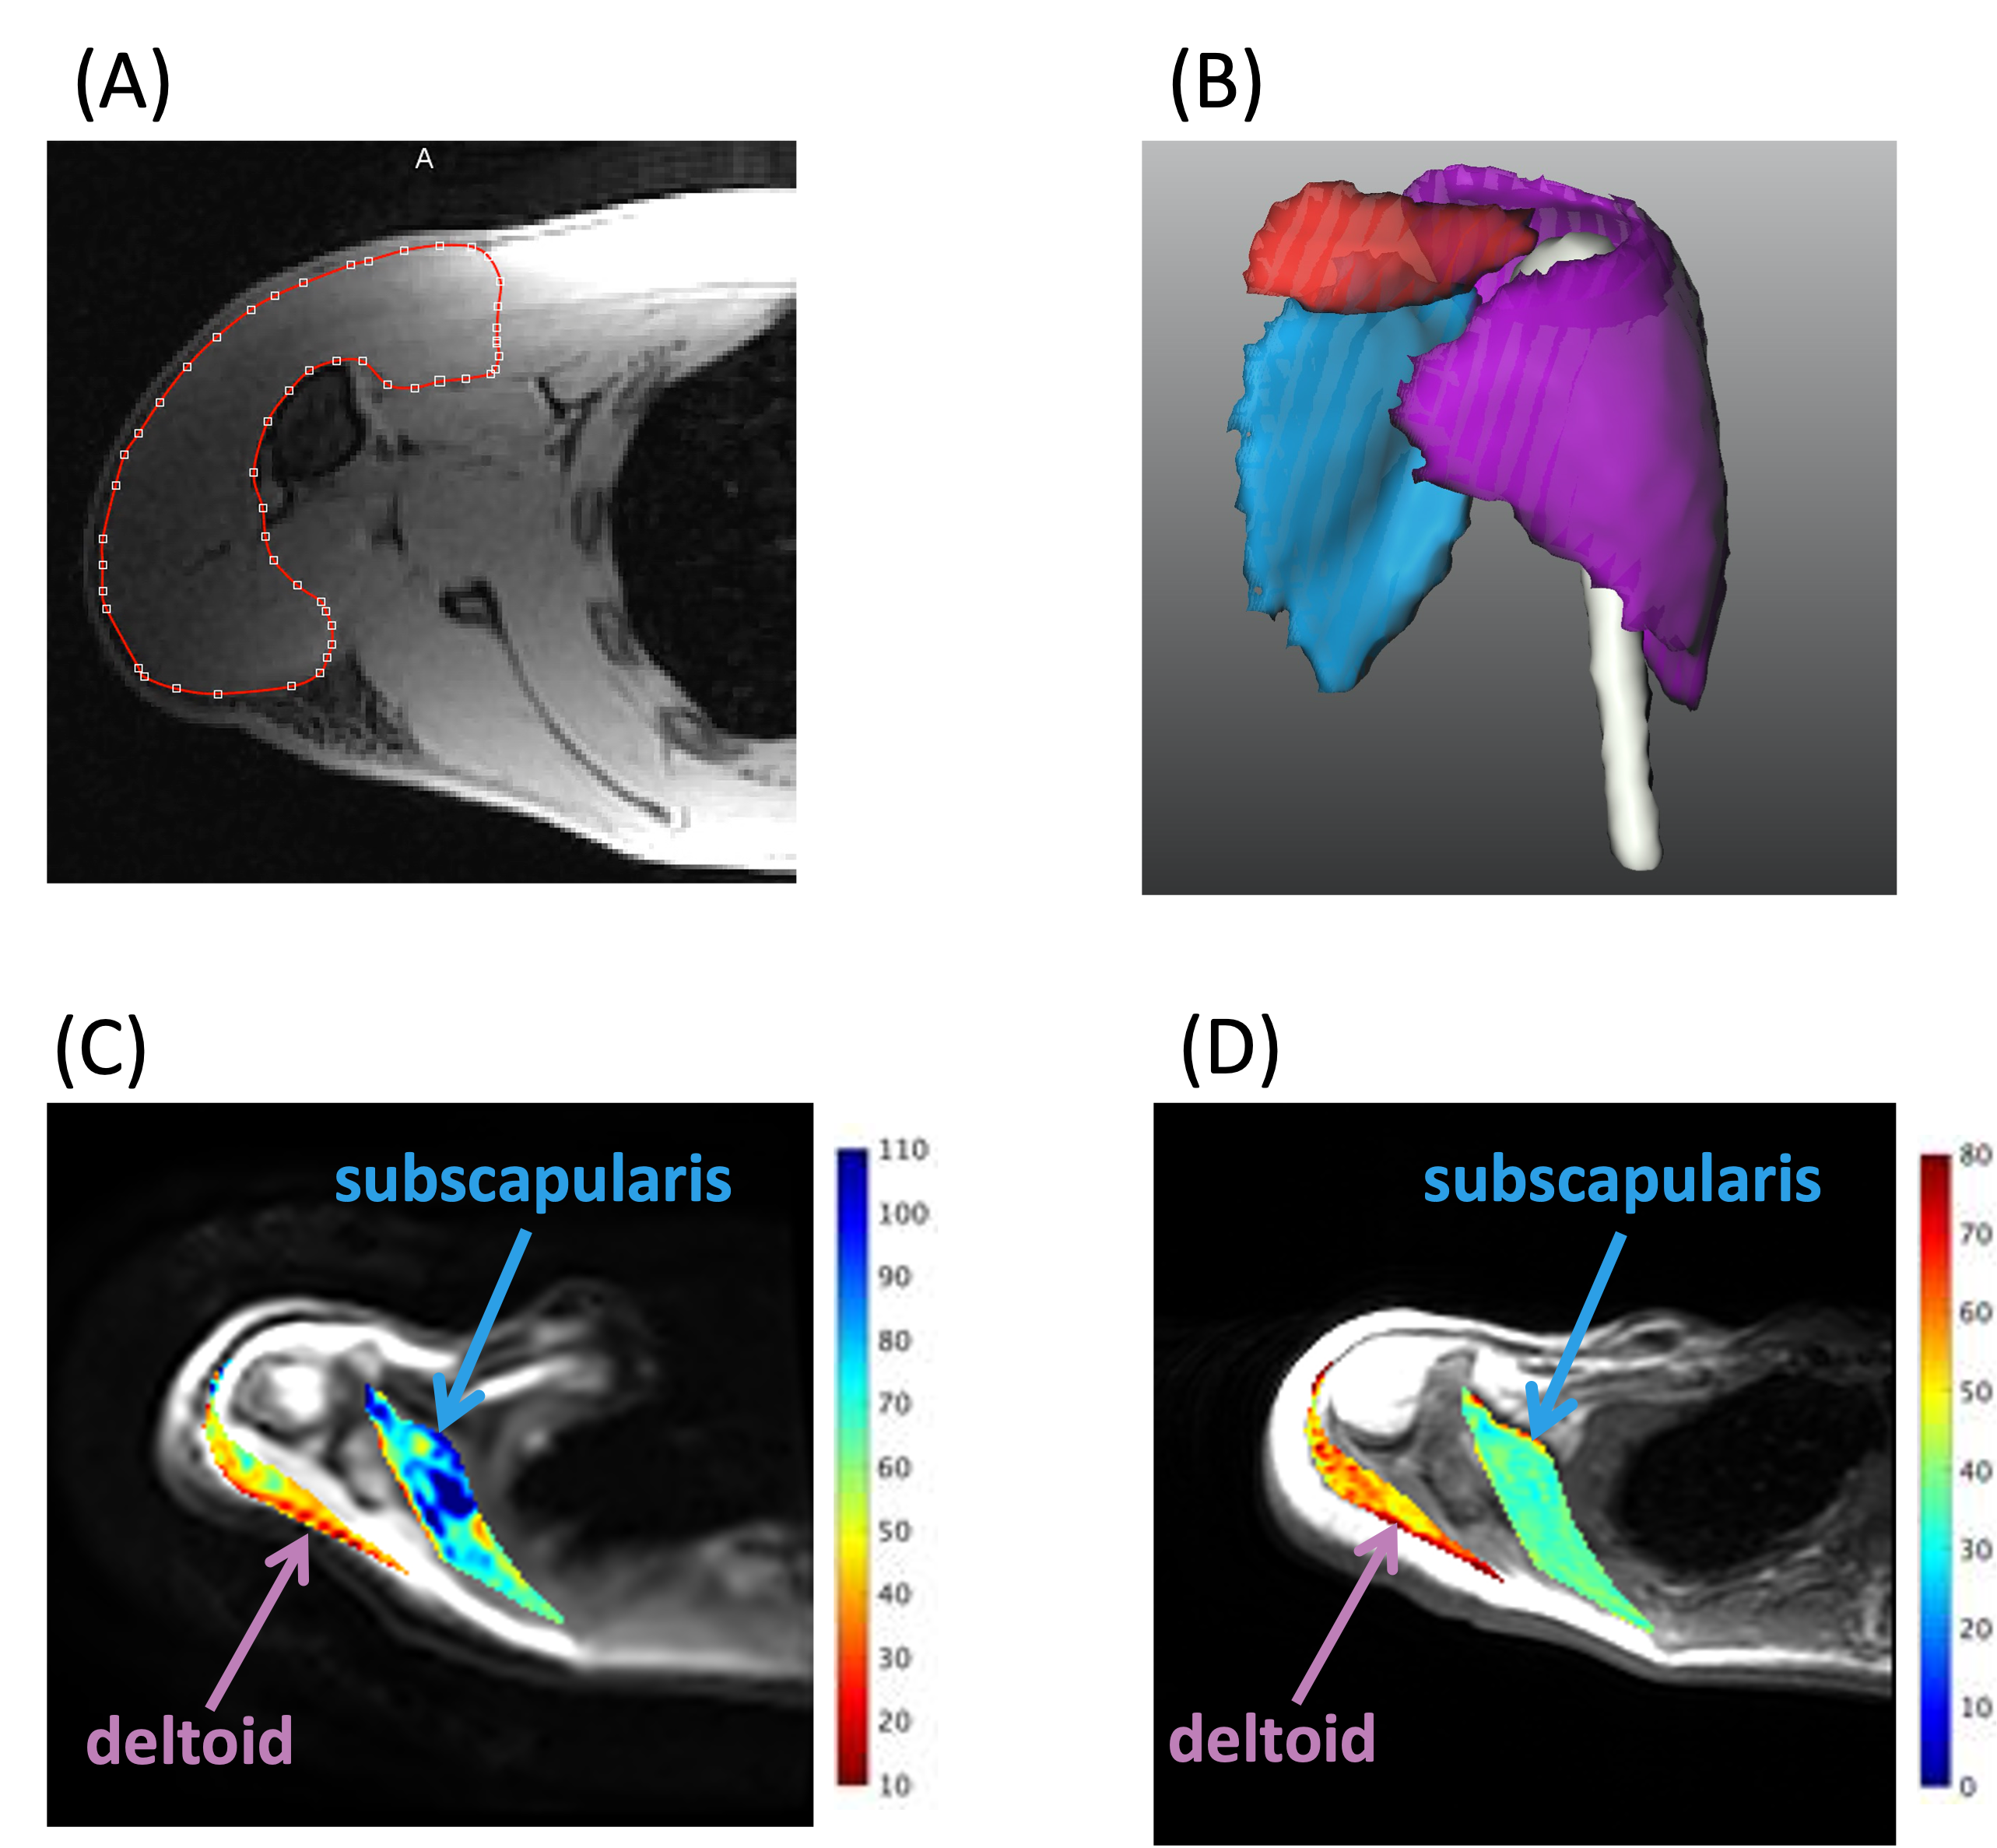
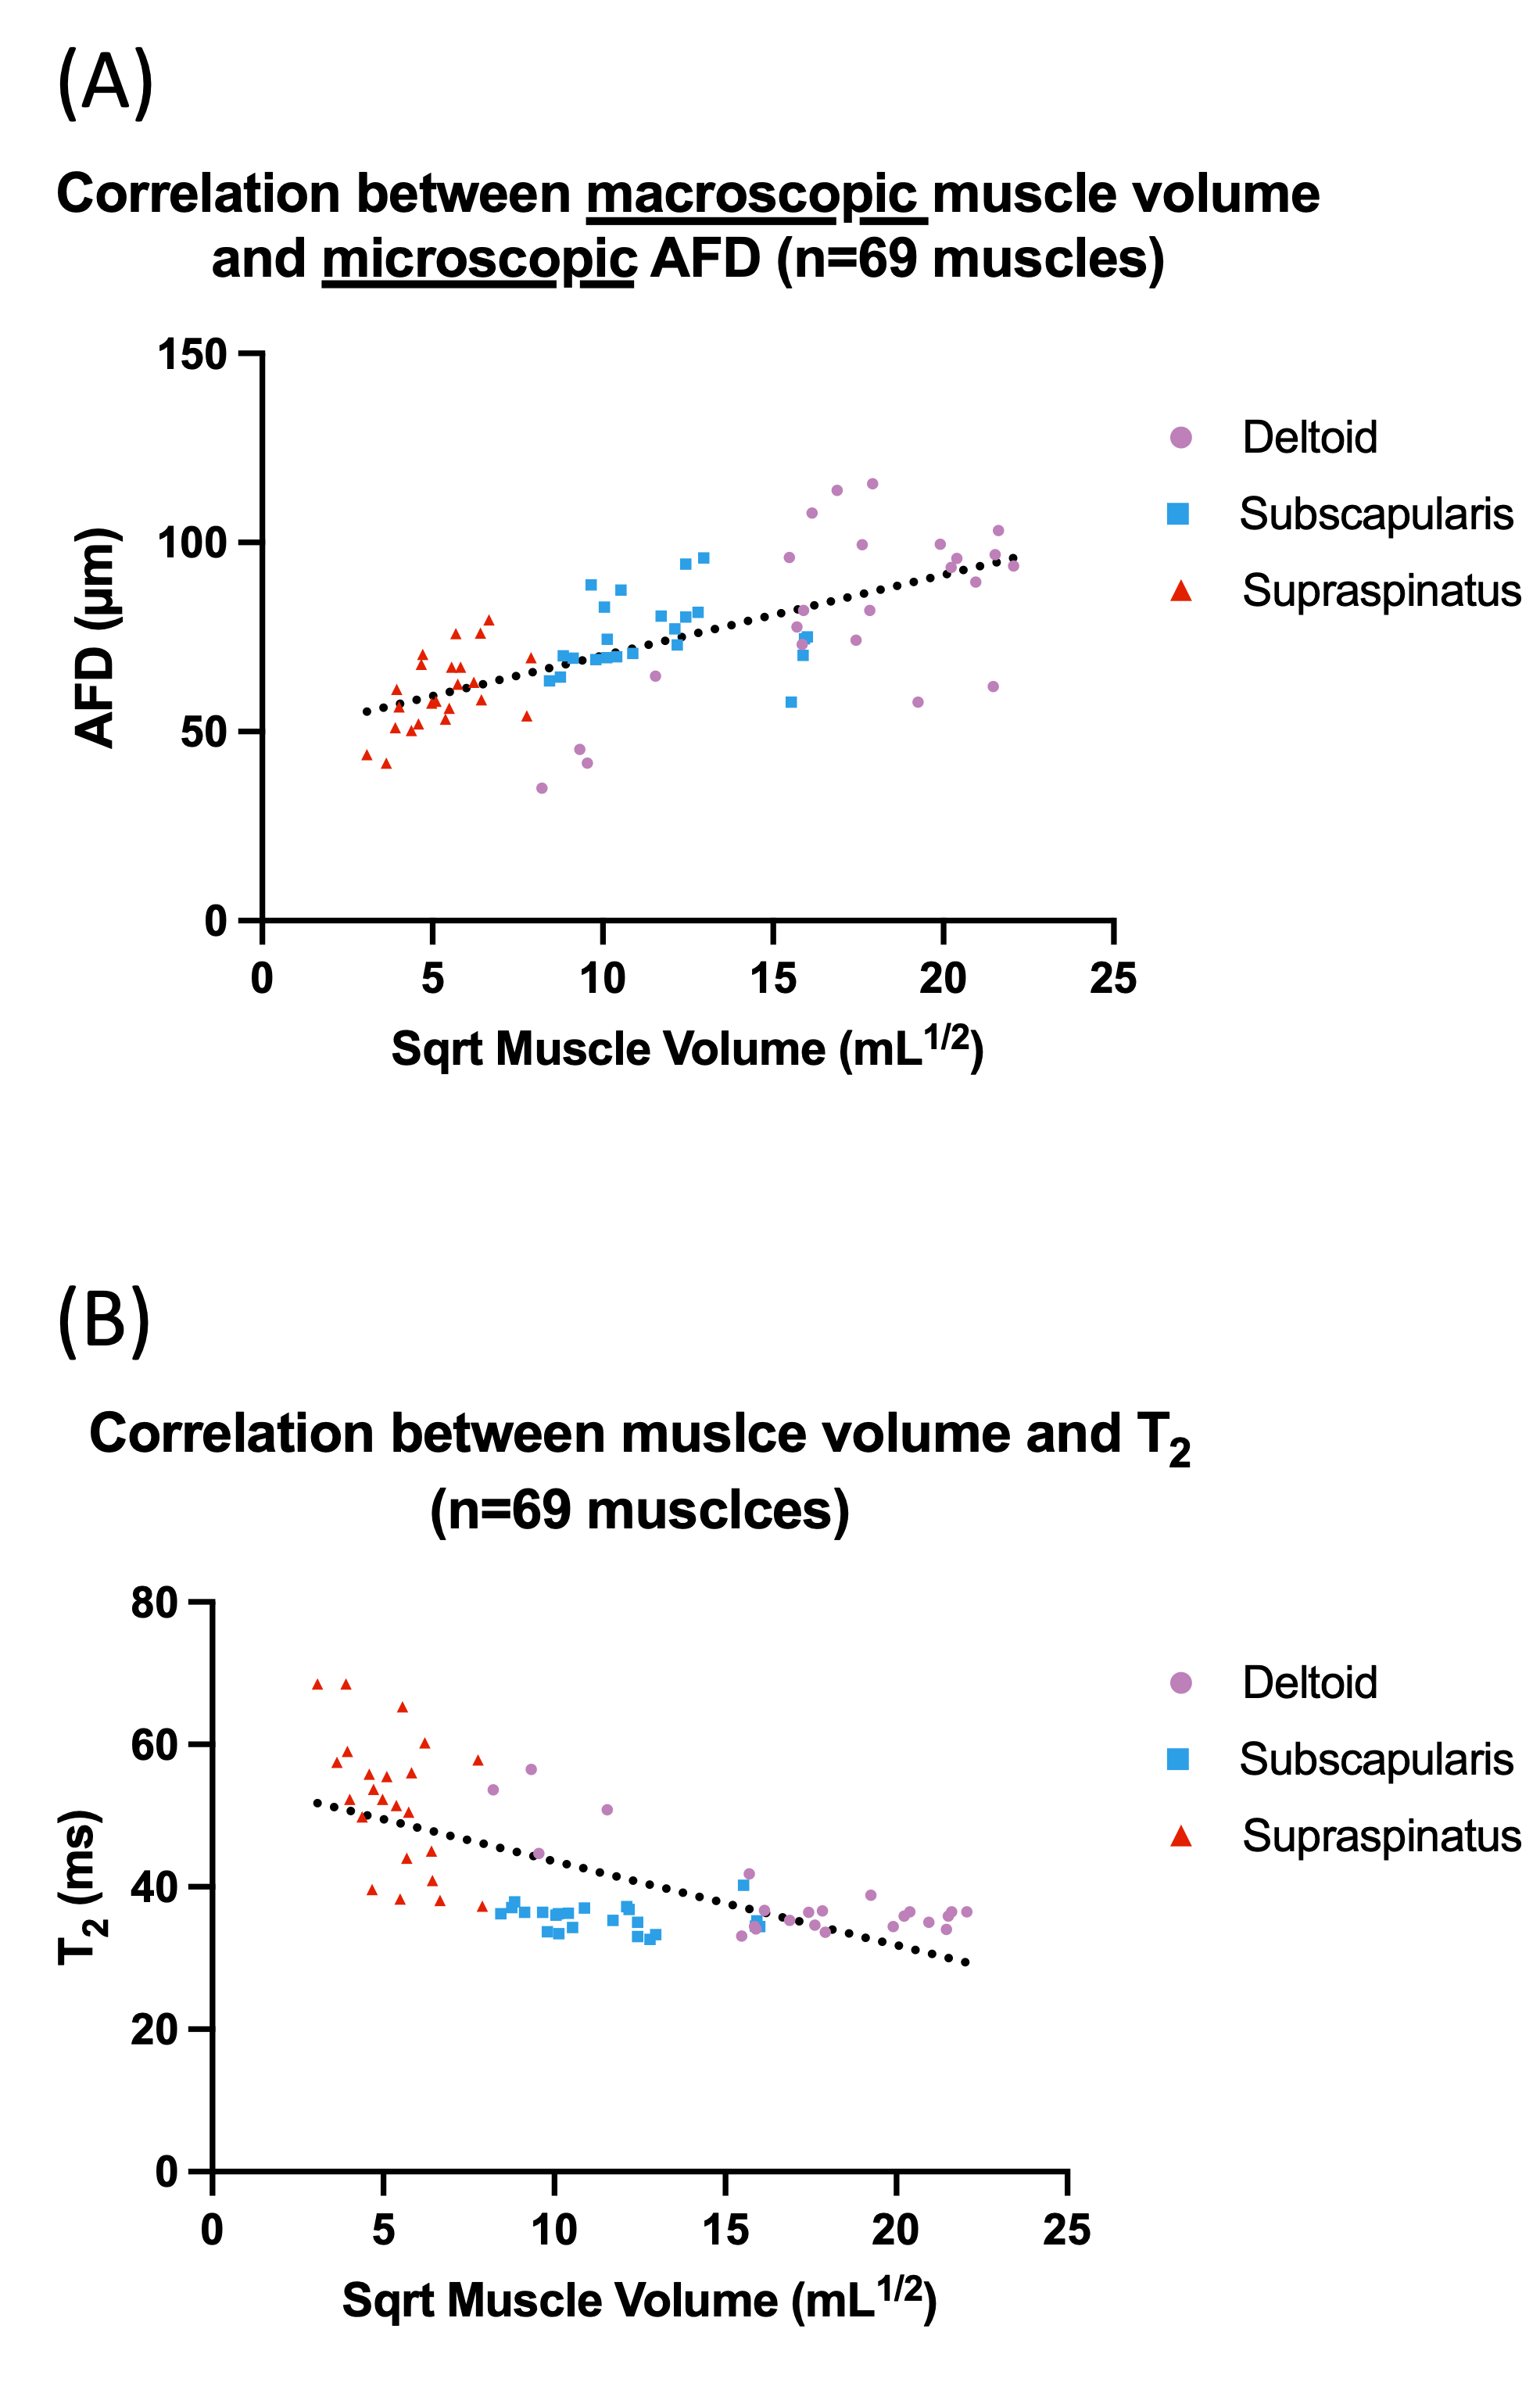
Water images from 3D 2-point Dixon gradient echo (FOV=34 cm, slice thickness=1.8mm, matrix=256x56x96) were used to identify and manually segment the borders of the supraspinatus, subscapularis, and deltoid muscles using custom software (MeVis Medical Solutions AG) (Fig.1A and 1B). Macroscopic muscle volume measurements were obtained and compared against microscopic AFD measurements (Fig.1C) as well as T2 (Fig.1D). Linear regression of muscle volume against AFD and T2 was performed. The square root of volume was used, as muscle fibers may be approximated as cylinders with no length change assumed. Muscle volume, AFD and T2 results were normalized to the first timepoint for analysis of longitudinal changes.
Results
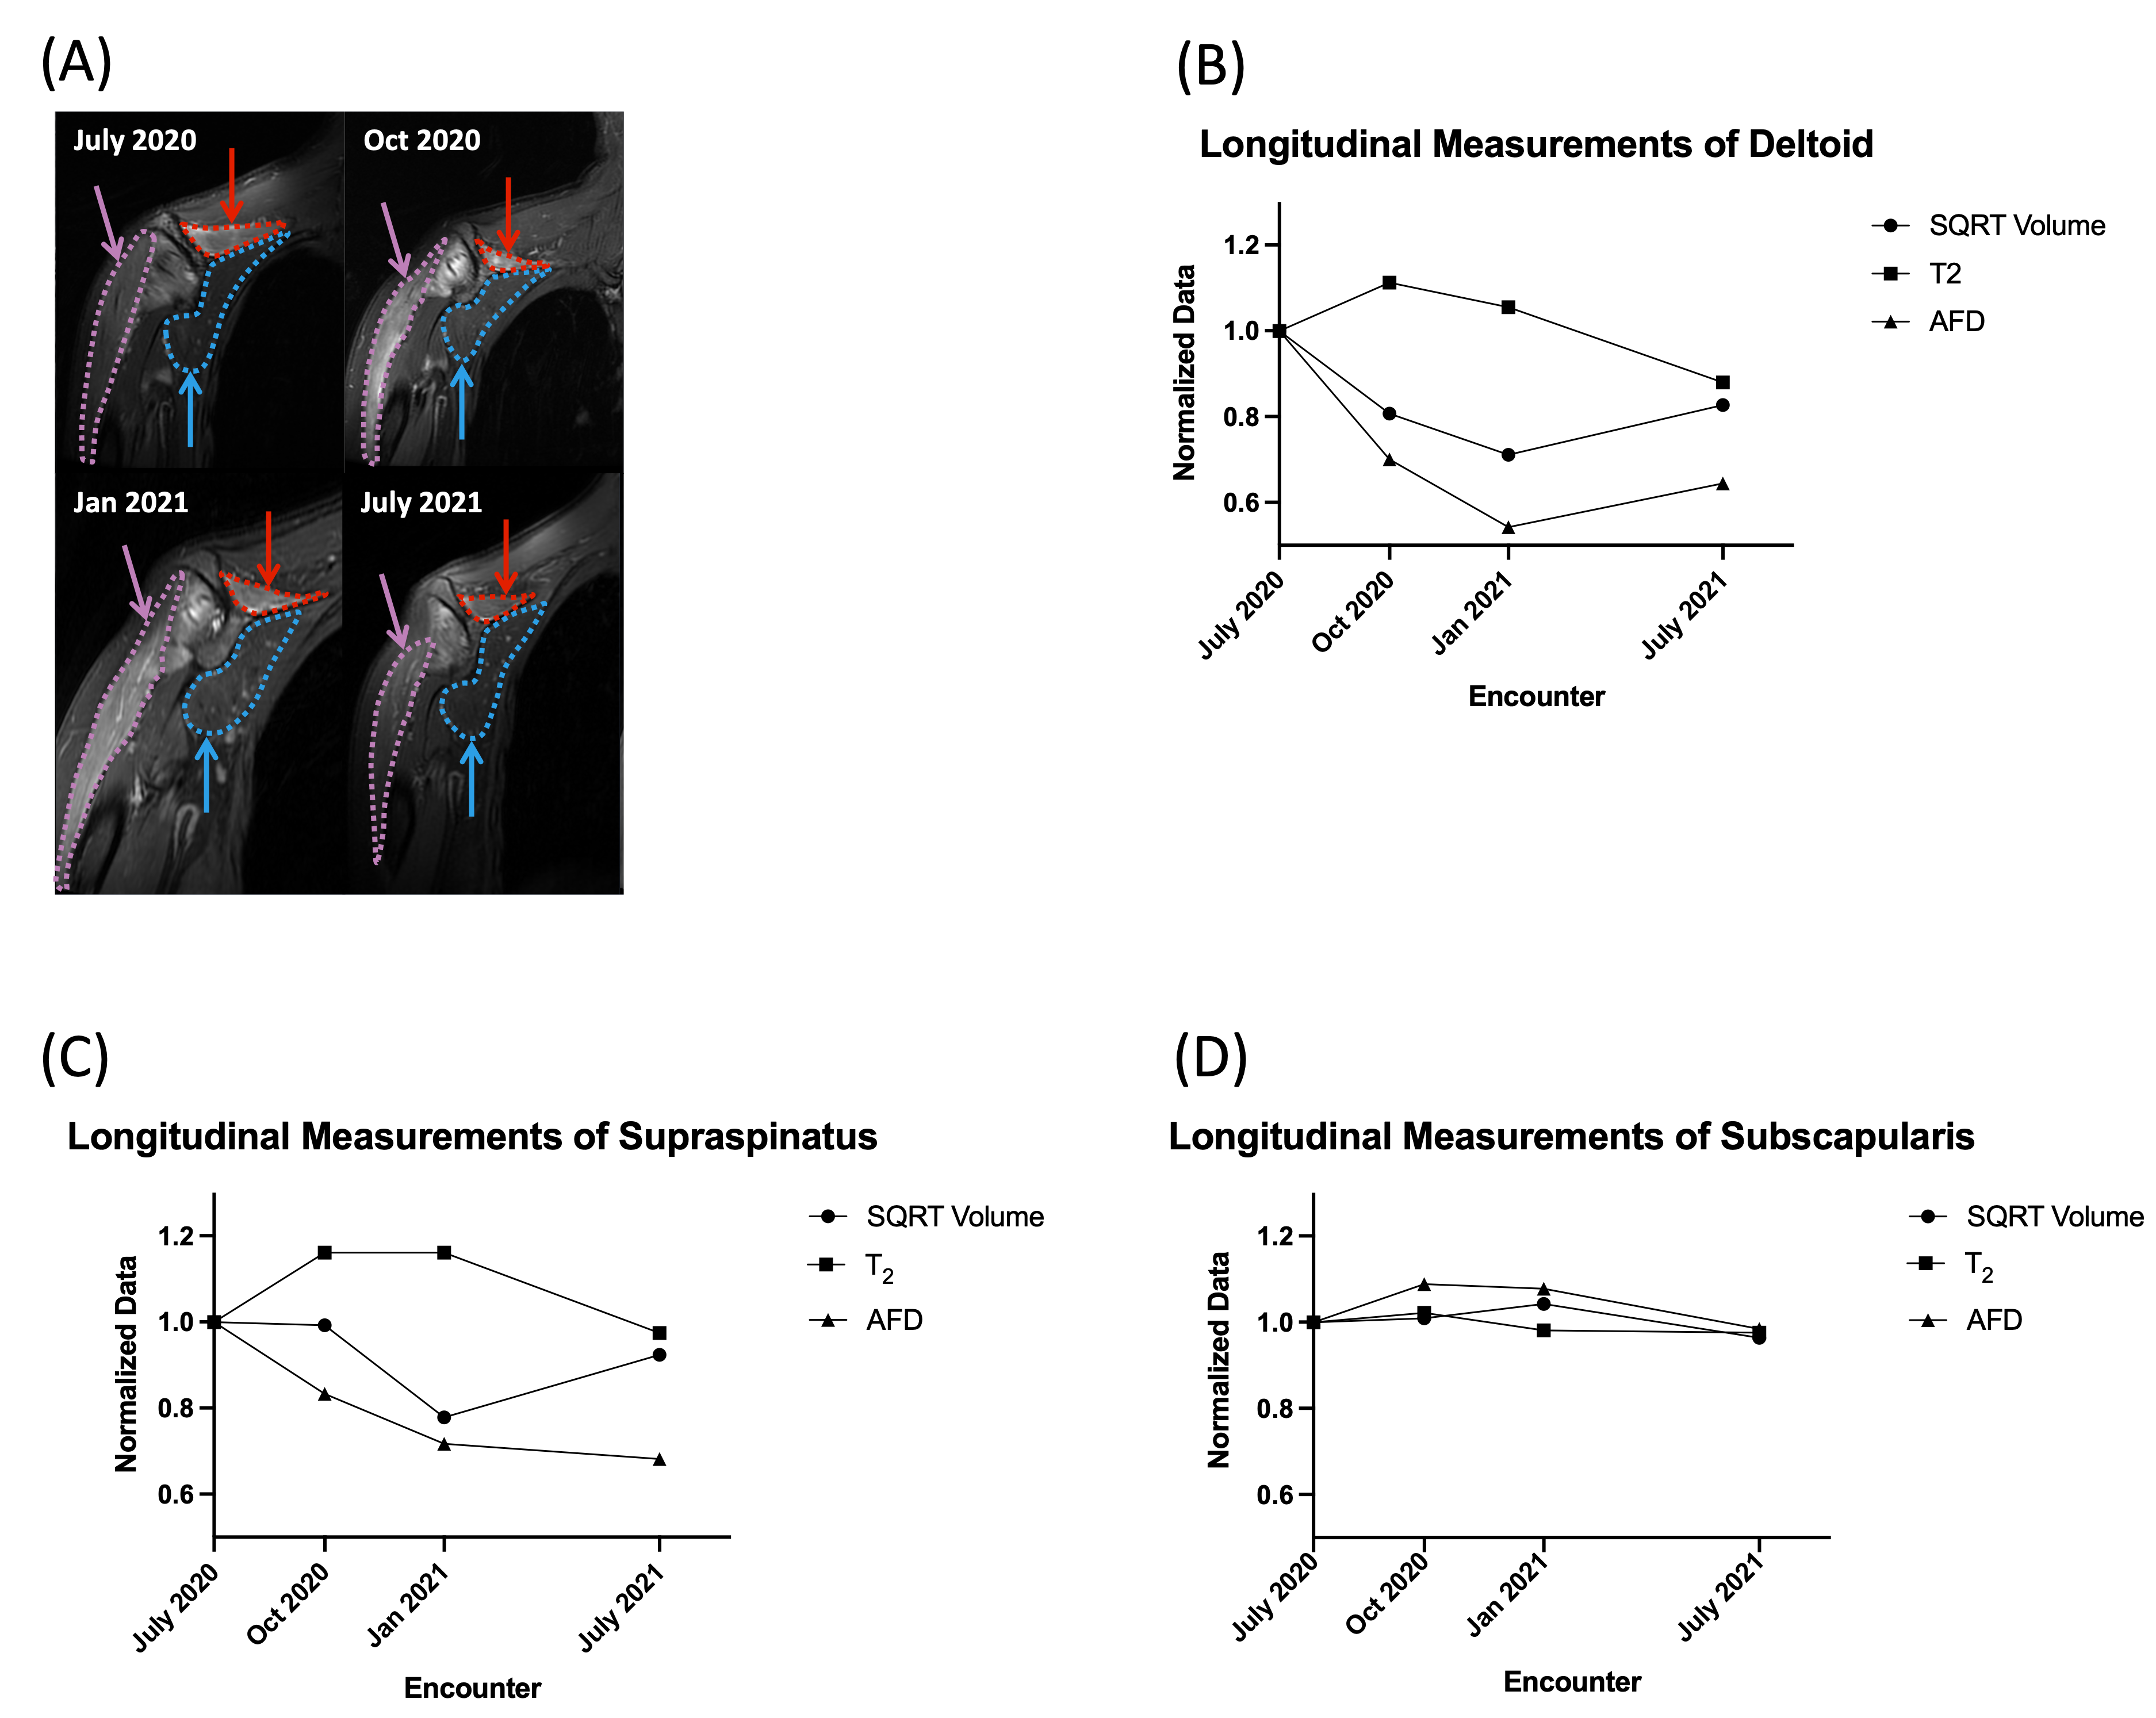
A strong-to-moderate positive correlation was found between volume and AFD across all muscles (r=0.6714, p<0.0001; Fig.2A). A strong-to-moderate negative correlation was observed between volume and T2 (r=-0.6732, p<0.0001; Fig.2B). Denervated muscles demonstrated moderate linear correlation between muscle volume and T2 (r=-0.5404, p=0.0021; Table 1), and weaker but significant correlation with AFD (r=0.3973, p=0.0297). For non-denervated muscles, there was moderate correlation between volume and AFD (r=0.5049, p=0.001), but no correlation between volume and T2 (r=-0.05805, p=0.7256). When analyzed by muscle type, the deltoid and supraspinatus volumes were correlated with AFD and T2, whereas the subscapularis had no correlation with AFD and T2.Preliminary longitudinal analysis showed that muscle volume and AFD tended to decrease following the initial scan (within 6 months of disease onset), whereas T2 tended to increase (Fig.3). At the third and fourth timepoints, changes in muscle volume, AFD and T2 may suggest muscle recovery. For example, in one subject, quantitative, longitudinal measurements of denervated deltoid and supraspinatus muscles showed initial muscle volume decrease, AFD decrease and T2 increase, but opposite trends at subsequent timepoints that were consistent with EMG findings (Fig.4B and 4C). In contrast, quantitative changes were constant in the non-denervated subscapularis (control; Fig.4D).
Discussion
The muscle volume of non-denervated shoulder muscles (subscapularis mean:140mL, range: 71-241mL) compared well with literature values8,9. Linear correlation of quantitative metrics was primarily observed in denervated muscles. Correlation of muscle volume and diameter in non-denervated muscles may be due to variation between subjects and muscle types. No correlation was observed between volume and T2 in non-denervated muscles, as expected.Preliminary longitudinal analysis shows quantitative changes in denervated muscles and not in non-denervated muscles; quantitative MRI may provide an objective means for evaluating disease progression in muscle denervation. Specifically, muscle volume, T2 and AFD can together provide multiparametric characterization of muscle changes in PTS. As more subject scans become completed in this ongoing study, we plan to further analyze correlations and develop longitudinal models for EMG and motor function using quantitative muscle metrics.
Conclusion
Macroscopic volume of denervated muscles demonstrated strong-to-moderate correlations with both AFD and T2, suggesting that muscle volume may also depict muscle denervation in PTS (neuralgic amyotrophy). The information provided by macroscopic muscle volume may be complementary to quantitative T2 and AFD, and together, may provide a comprehensive non-invasive assessment of muscle denervation and nerve recovery, and may also provide insights into disease severity and prognosis.Acknowledgements
This work was supported in part by NIH R21-TR003033. The opinions or assertions contained herein are the private views of the authors and are not to be construed as official or reflecting the views of the NIH. ETT and DBS also receive research support from GE Healthcare. The authors thank Sophie Queler and Yan Wen for their technical assistance.References
1. van Alfen, N. and B.G. van Engelen, The clinical spectrum of neuralgic amyotrophy in 246 cases. Brain, 2006. 129(Pt 2): p. 438-50.
2. Maier, F. and A. Bornemann, Comparison of the muscle fiber diameter and satellite cell frequency in human muscle biopsies. Muscle Nerve, 1999. 22(5): p. 578-83.
3. West, G.A., et al., Magnetic resonance imaging signal changes in denervated muscles after peripheral nerve injury. Neurosurgery, 1994. 35(6): p. 1077-85; discussion 1085-6.
4. Polak, J.F., F.A. Jolesz, and D.F. Adams, Magnetic resonance imaging of skeletal muscle. Prolongation of T1 and T2 subsequent to denervation. Invest Radiol, 1988. 23(5): p. 365-9.
5. Argentieri, E.C., et al., Quantitative T2 -mapping magnetic resonance imaging for assessment of muscle motor unit recruitment patterns. Muscle Nerve, 2021. 63(5): p. 703-709.
6. Tan, E.T., K.C. Zochowski, and D.B. Sneag, Diffusion MRI fiber diameter for muscle denervation assessment. Quantitative Imaging in Medicine and Surgery, 2021.
7. Pons, C., et al., Quantifying skeletal muscle volume and shape in humans using MRI: A systematic review of validity and reliability. PLoS One, 2018. 13(11): p. e0207847.
8. Holzbaur, K.R., et al., Upper limb muscle volumes in adult subjects. J Biomech, 2007. 40(4): p. 742-9.
9. Tingart, M.J., et al., Magnetic resonance imaging in quantitative analysis of rotator cuff muscle volume. Clin Orthop Relat Res, 2003(415): p. 104-10.
Figures