0670
Evaluating correlations of quantitative muscle MRI of leg muscles and clinical outcome measurements in patients with LGMD2A1Neurology, University Clinic Bergmannsheil Bochum gGmbH, Bochum, Germany, 2Neurology, Klinikum Dortmund, University Witten-Herdecke, Dortmund, Germany, 3Radiology, UMC Utrecht, Utrecht, Netherlands
Synopsis
Quantitative MRI (qMRI) techniques like Dixon fat-fraction (FF) and quantitative water-T2 relaxation time (T2) are promising non-invasive tools in the evaluation of neuromuscular diseases like LGMD2A. In this study, we were able to show moderate to strong correlations between quantitative MRI values, especially FF, with clinical outcome measures and daily life activities. Analysis of T2 relaxation time in non-fat-infiltrated leg muscles of LGMD2A patients showed a significantly higher water T2 values compared to healthy controls. Therefore, T2 relaxation times may offer an earlier detection of disease-related change of muscular tissue in limb girdle muscular dystrophy compared to irreversible fat-fractions.
Introduction
Limb Girdle Muscular Dystrophy (LGMD) 2A is the most common form of LGMD in Europe with a prevalence of 1:15.000 – 1:150.000.1 Patients face difficulties to walk, and frequently a complete loss of ambulance over the years. To assess disease progression and success of emerging therapeutic options, non-invasive biomarkers are needed. Quantitative MRI (qMRI) techniques like Dixon fat fraction (FF) and water-T2 relaxation times (T2) are promising non-invasive tools in the evaluation of neuromuscular diseases.2 Increase of FF has been shown to precede clinical deterioration of muscle function in different longitudinal studies, while quantitative T2 measures have been associated with myoedema, inflammation and fat infiltration.3 In patients with LGMD correlations of qMRI values in thigh muscles with clinical scores been shown by Arrigoni et al. in a cohort of 11 LGMD2A with advanced disease.4 In this study we aimed to analyse quantitative imaging parameters of calf and thigh muscles in a large cohort of patients with genetically confirmed calpainopathy (LGMD2A) and to correlate the quantitative values FF and T2 with clinical findings and daily life activities assessed by questionnaires.Methods
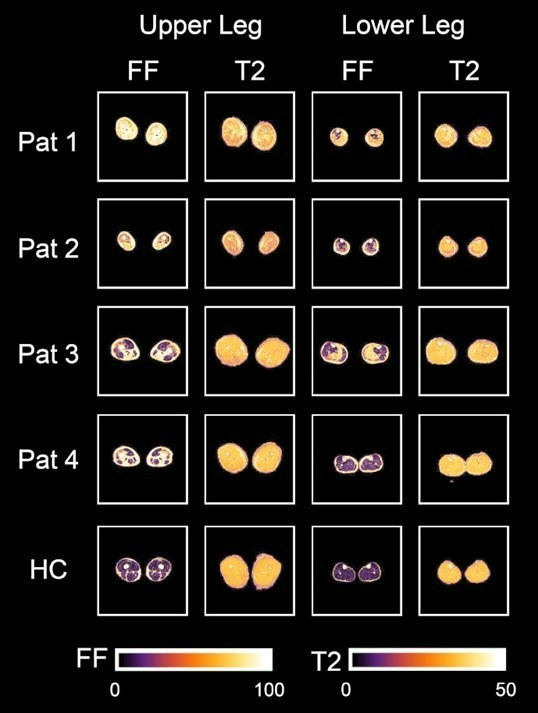
In total, 19 individuals with genetically confirmed calpainopathy (10 females, aged 25–69 years; mean age 39.8 ± 13.4 years) and 19 age- and gender-matched healthy volunteers (10 females, aged 26–60 years; mean age 39.2 ± 12.6 years) participated in this study. Clinical assessments included Quick Motor Function Measure (QMFM) by an experienced clinical neurologist (5 years of experience), the 6-Minute Walk Test (6-MWT), time to walk 10 meters (T10m) and timed up- and-go test (TUG) and the assessments of daily life activities by the ACTIVLIM and the Neuromuscular Symptom Score (NSS).5,6 All participants underwent a 3.0T MRI of the leg muscles in a Philips Achieva system using a 16CH Torso XL coil. The protocol consisted of a Dixon sequence (voxel size 1.5 × 1.5 × 6.0 mm3; TR/TE 210/2.6, 3.36, 4.12, 4.88ms; flip angle 8°, SENSE: 2), a multi‐echo spin‐echo (MESE) sequence for quantitative water mapping including 17 echoes and Cartesian k‐space sampling (voxel size 3.0 × 3.0 × 6.0 mm3; TR/TE 4598/17x∆7.6; flip angle 90/180°, SENSE: 2, slice gap 6 mm) [Figure 1]. Data were pre-processed as described before by Schlaffke et al.7 The IDEAL method was used for the Dixon data considering a singleT2* decay and resulting in a separated water and fat map.8 Seven calf muscles (extensor digitorum, gastrocnemius lateralis and medialis, peroneal group, soleus, tibialis anterior and tibialis posterior) and eight thigh muscles (biceps femoris, gracilis, sartorius, semimembranosus, semitendinosus, rectus femoris, vastus lateralis and vastus medialis) were segmented manually in both legs, based on the water maps. The segmentations were then registered to T2 data to correct for subject motion between sequences using sequential rigid b-spline transformations (elastix, http://elastix.isi.uu.nl).9 Average values per muscle of T2 and FF were obtained. Pearson and Spearman rank correlation coefficients were calculated between qMRI values FF, T2 and clinical outcome measurements in both groups and daily life activities in LGMD group. Using a MANOVA FF and T2 were compared between LGMD and healthy control group. In a second step an ANOVA was performed in muscles with a fat fraction lower than 10% to evaluate T2 changes between study groups as a possible marker of inflammation in LGMD group.Results
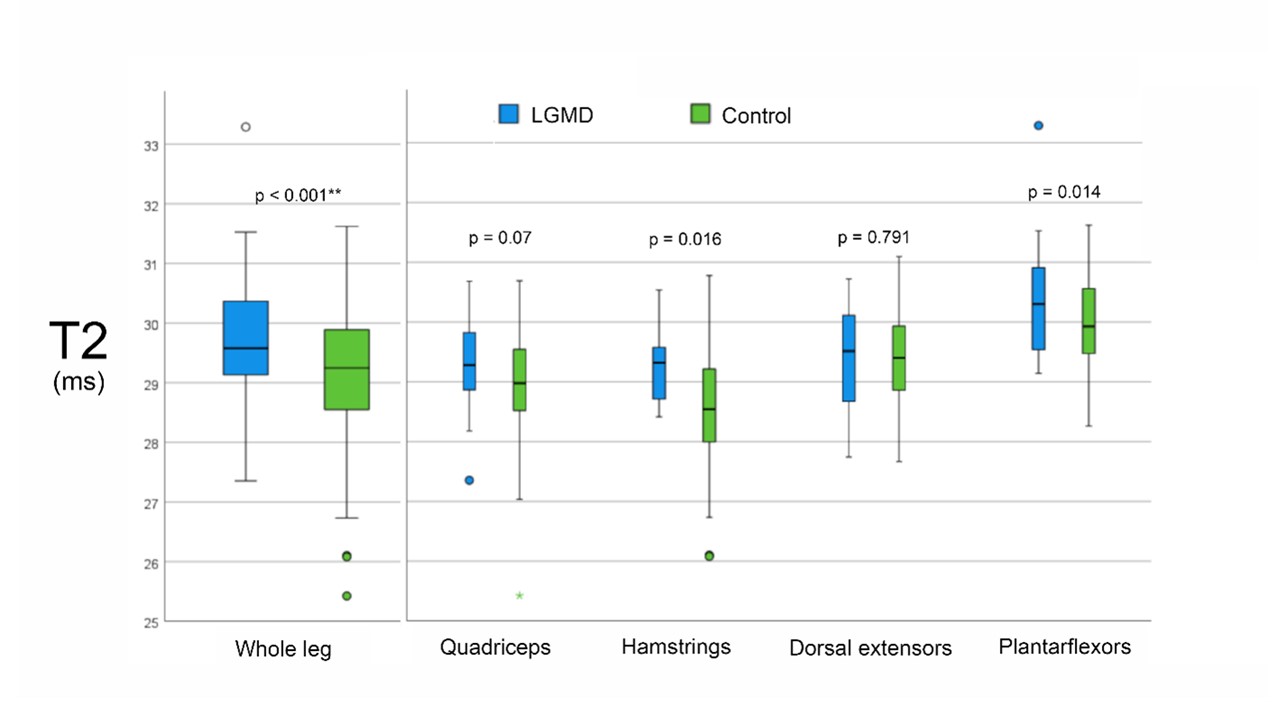
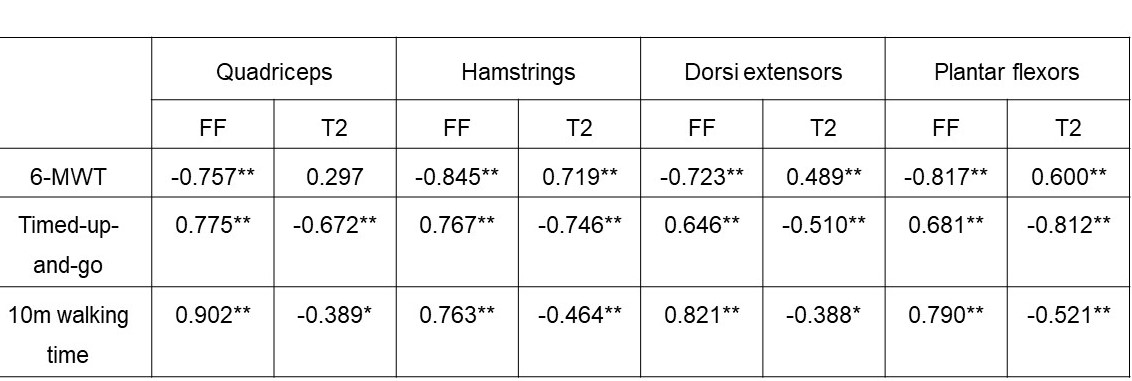
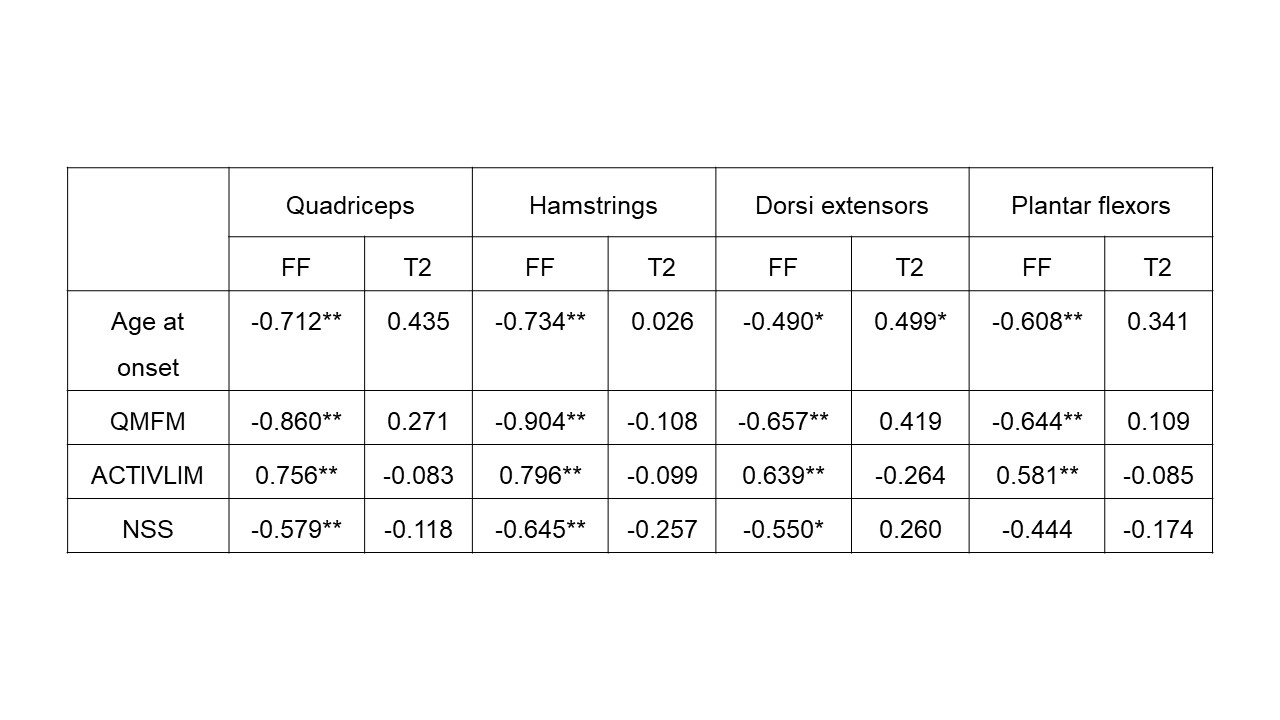
We found significant strong negative correlations between 6-MWT and FF (r ≤ -0.719, p < 0.001; Table 1), moderate to strong positive correlations between TUG and T10m and FF for all muscle groups (r ≥ 0.646, p < 0.001) and moderate to high correlation of daily activities and FF (r ≥ 0.550, p < 0.001). Opposite moderate, but significant correlations were found between gait measurements and T2 with exception of 6-MWT in the quadriceps muscle group. Furthermore, significant differences of FF and T2 were found between LGMD and healthy control group and significant differences of T2 between study groups in not fatty infiltrated muscles (Main Effect: p < 0.001; Figure 2).Discussion
Advanced qMRI techniques like Dixon FF and quantitative T2 measures can offer quantitative information about fat infiltration and inflammation. In this study FF in all muscle groups correlated strongly with clinical findings while T2 showed moderate correlation with gait measurements. Fatty replacement in the muscle goes a long with a loss of muscle tissue and therefore reduces its function. These findings are in line with the results of the previous mentioned study by Arrigoni. In this study we were able to show significantly higher T2 values in non-fatty-infiltrated muscles of LGMD2A patients. T2 relaxation time seems to add some valuable information about inflammatory processes occurring in the muscle prior to fatty degeneration and therefore prior to a loss of function, which explains the missing correlation to clinical findings. These findings suggest that T2 is an early marker of inflammatory changes like myoedema before the irreversible process of fat infiltration.Conclusion
qMRI values, especially FF correlate strongly with clinical findings. T2 relaxation time can show inflammation in non-fat-infiltrated leg muscles of LGMD2A and may offer early detection of disease-related change of muscular tissue.Acknowledgements
We thank Philips Germany for continuous scientific support and specifically Dr. Burkhard Mädler for valuable discussion. LS received funding from the DFG (Project number: 122679504, SFB874, TP-A5). MR and JF reveiced grants from the FoRUM-programm of the Ruhr-University Bochum (MR: F960R-2020; JF: K139-20,AG: K-144-20) MR,AG and MV are funded by the Heimer Institut. LS and RR received funding from Sanofi Genzyme (Project number: SGZ-2019-12541).References
Protein Abnormalities to Patient Impact. Protein J. 2021;(0123456789). doi:10.1007/s10930-021-10006-9
2. Aivazoglou LU, Guimarães JB, Link TM, et al. MR imaging of inherited myopathies: a review and proposal of imaging algorithms. Eur Radiol. Published online April 21, 2021. doi:10.1007/s00330-021-07931-9
3. Burakiewicz J, Sinclair CDJ, Fischer D, Walter GA, Kan HE, Hollingsworth KG. Quantifying fat replacement of muscle by quantitative MRI in muscular dystrophy. J Neurol. 2017;264(10):2053-2067. doi:10.1007/s00415-017-8547-3
4. Arrigoni F, De Luca A, Velardo D, et al. Multiparametric quantitative MRI assessment of thigh muscles in limb-girdle muscular dystrophy 2A and 2B. Muscle and Nerve. 2018;58(4):550-558. doi:10.1002/mus.26189
5. Vandervelde L, Van den Bergh PYK, Goemans N, Thonnard JL. ACTIVLIM: A Rasch-built measure of activity limitations in children and adults with neuromuscular disorders. Neuromuscul Disord. 2007;17(6):459-469. doi:10.1016/j.nmd.2007.02.013
6. Dalakas MC, Stein DP, Otero C, Sekul E, Cupler EJ, Mccrosky S. Effect of High-Dose Intravenous Immunoglobulin on Amyotrophic Lateral Sclerosis and Multifocal Motor Neuropathy. Arch Neurol. 1994;51(9):861-864. doi:10.1001/archneur.1994.00540210031010
7. Schlaffke L, Luca A De, Weidlich D, et al. Multi ‐ center evaluation of stability and reproducibility of quantitative MRI measures in healthy calf muscles. NMR Biomed. 2019;32(9):e4119. doi:10.1002/nbm.4119
8. Reeder SB, Pineda AR, Wen Z, et al. Iterative Decomposition of Water and Fat With Echo Asymmetry and Least-Squares Estimation ( IDEAL ): Application With Fast Spin-Echo Imaging. Magnenetic Reson Med. 2005;644:636-644. doi:10.1002/mrm.20624
9. Klein S, Staring M, Murphy K, Viergever M a., Pluim J. elastix: A Toolbox for Intensity-Based Medical Image Registration. IEEE Trans Med Imaging. 2010;29(1):196-205. doi:10.1109/TMI.2009.2035616
Figures