0669
Extra-ocular muscle volume, T2water and fat fraction are slightly increased in patients with myasthenia gravis
Kevin R. Keene1,2, Jan J.G.M. Verschuuren1, Irene C. Notting3, Martijn R. Tannemaat1, Jan-Willem M. Beenakker2,3, and Hermien E. Kan2
1Department of Neurology, Leiden University Medical Center, Leiden, Netherlands, 2C.J. Gorter Center of High Field MRI, Department of Radiology, Leiden University Medical Center, Leiden, Netherlands, 3Department of Opthalmology, Leiden University Medical Center, Leiden, Netherlands
1Department of Neurology, Leiden University Medical Center, Leiden, Netherlands, 2C.J. Gorter Center of High Field MRI, Department of Radiology, Leiden University Medical Center, Leiden, Netherlands, 3Department of Opthalmology, Leiden University Medical Center, Leiden, Netherlands
Synopsis
Quantitative MRI of the extra-ocular muscles might have diagnostic value and play a role in therapeutic monitoring in myasthenia gravis (MG). Our data show a slight increase in volume, fat fraction and T2water in extra-ocular muscles of MG patients compared to controls. Volume and fat fraction changes were most pronounced in chronic MG patients, T2water changes were most pronounced in recently diagnosed and untreated MG patients. The absence of gross structural changes implies that eye muscle weakness might be reversible, even in chronic patients with residual ophthalmoplegia.
Introduction
Quantitative MRI of the eye muscles, or the extra-ocular muscles (EOM), might have diagnostic value and play a role in therapeutic monitoring in myasthenia gravis (MG).1 Diplopia, double vision, is a hallmark of myasthenia gravis and caused by relative weakness of the four recti eye muscles (lateral rectus [LR], medial rectus [MR], inferior rectus [IR] and superior rectus [SR]) in this synaptic disease.2 In Chronic progressive external ophthalmoplegia, a mitochondrial disease with EOM involvement, atrophy and fat replacement of the EOM was previously observed.3 Quantitative MRI of the EOM was shown to be feasible in a small group of patients.4 Now we aimed to explore structural differences of the eye muscles in a large group of myasthenia gravis (MG) patients using quantitative MRI and compared this to healthy controls and CPEO patients.Methods
18 recently diagnosed MG (58±20yrs), 18 chronic MG (51±17yrs), 11 seronegative MG (58±8yrs), 5 CPEO patients (52±12yrs) and 11 healthy controls (58±13yrs) were scanned at 7T (Philips). Scans included a 3-point-Dixon (TE/TR/FA/ΔTE:2.4ms/10ms/3°/0.33ms) and two multi-echo spin-echo (ME-SE) sequences (20 echoes, ΔTE/TR: 9m/4000ms) planned perpendicular on the EOM for each eye. Example scans for EOM volume and fat fraction measurements are demonstrated respectively in figure 1A and 1B. MR-scans were semi-automatically 3D-segmented to determine EOM volume and fat fractions (FF) (figure 1C). Data from the Dixon acquisition were fitted using an in-house developed water-fat separation Matlab script. T2water data obtained by fitting the ME-SE echoes using a dictionary fitting method using extended phase graph (EPG) algorithms including B1 in the model.5,6 Measurements were compared between CPEO, MG groups and healthy controls groups using an ANOVA per EOM with Tukey post-hoc analysis. A separate ANOVA was performed including only the healthy controls and MG groups to test whether the MG groups differ from the healthy controls. Correlations between qMRI measurements were tested using Pearson correlations, after pooling the MG groups. The T2water between the left and the right orbit was compared using an independent-T-test.Results
Differences in volume between healthy controls, CPEO and MG groups were observed (e.g. respectively for MR, 569±129, 603±106, 635±140, 520±85 and 442±114 mm3, healthy controls, recent MG, chronic MG, seronegative MG and CPEO, p<0.01, figure 2). The volume differences where overall IR>MR>LR. For the CPEO patients post-hoc tests showed the volume of the LR, MR and the SR to be significantly smaller than the other groups. Fat fraction was slightly elevated in CPEO and all MG groups, (e.g. respectively for LR, 12±2%, 15±4%, 15±5%, 12±3% and 20±10%)., figure 3) and were overall SR>IR>LR. In CPEO patients the fat fraction was significantly higher than the other groups for all four EOM. A positive correlation between EOM volume and fat fraction was present for the SR (r=0.41, p<0.0001) and the IR (r=0.24, p < 0.05) in MG patients. On the contrary, a strong negative correlation between EOM volume and fat fraction was observed in the LR (r=-0.86, p < 0.005) and MR (r=-0.74, p<0.05) in CPEO patients. The T2water was significantly different between the groups in the MR and post-hoc analysis shows the difference is caused by a higher T2water in the recently diagnosed MG patients (respectively 25.5±2.9, 27.3±3.2, 24.6±3.6, 26.3±3.9 and 27.3±2.8 ms, p<0.05, figure 5). Given the high variation in the T2water measurements between subjects in the groups, we pooled all the muscles and found a positive correction between the fitted B1 and T2water (r = 0.43, p<0.0001). Additionally, we found a significant difference in T2water between the left and right orbit (87% and 75% respectively, p<0.0001).Discussion
We show that qMRI of the EOM was able to detect subtle differences between MG patients, CPEO patients and controls. EOM volume and fat fraction was increased, most pronounced in chronic MG. No severe atrophy was observed as was expected in patients with residual ophthalmoplegia7. We hypothesize that the unexpected increase in EOM volume in MG is due to compensatory hypertrophy, where the muscle volume increases to compensate for the muscle weakness. The atrophy and severe fat replacement in CPEO patients was expected based on the disease pathophysiology and is in line with literature3. The increase in T2water in the MR of the recently diagnosed MG group could be due to inflammation, as complement activation has previously been shown to occur in muscles in MG8 and these patient are immunosuppressant naive. However, a high variation in T2water measurements between subjects was observed that could be obscuring differences. This may be caused by B1 influences that are not fully corrected in our EPG model, given the remaining relationship between T2water and B1. Moreover, we observed a B1 difference between the left and right orbit, which might be explained by regional B1 variation due to the field strength and challenging orbital anatomy. Improving the EPG model for this specific case is subject of future work.Conclusion
We observed small increases in volume and FF in eye muscles of MG patients, most pronounced in chronic MG patients. This absence of gross structural changes implies that eye muscle weakness might be reversible, even in chronic patients with residual ophthalmoplegia. Additionally, we observed an increase in T2water in the MR in recently diagnosed MG patients.Acknowledgements
No acknowledgement found.References
- Verschuuren JJGM, Palace J, Erik Gilhus N. Clinical aspects of myasthenia explained. Autoimmunity. 2010;43(5-6):344-352. doi:10.3109/08916931003602130
- Nair AG, Patil-Chhablani P, Venkatramani D V., Gandhi RA. Ocular myasthenia gravis: A review. Indian J Ophthalmol. 2014;62(10):985-991. doi:10.4103/0301-4738.145987
- Pitceathly RDS, Morrow JM, Sinclair CDJ, et al. Extra-ocular muscle MRI in genetically-defined mitochondrial disease. Eur Radiol. 2016;26(1):130-137. doi:10.1007/s00330-015-3801-5
- Keene KR, van Vught L, van de Velde NM, et al. The feasibility of quantitative MRI of extra-ocular muscles in myasthenia gravis and Graves’ orbitopathy. NMR Biomed. 2020. doi:10.1002/nbm.4407
- Keene KR, Beenakker JWM, Hooijmans MT, et al. T2 relaxation time mapping in healthy and diseased skeletal muscle using extended phase graph algorithms. Magn Reson Med. April 2020:mrm.28290. doi:10.1002/mrm.28290
- Marty B, Baudin PY, Reyngoudt H, et al. Simultaneous muscle water T2 and fat fraction mapping using transverse relaxometry with stimulated echo compensation. NMR Biomed. 2016;29(4):431-443. doi:10.1002/nbm.3459
- Mantegazza R, Antozzi C. When myasthenia gravis is deemed refractory: Clinical signposts and treatment strategies. Ther Adv Neurol Disord. 2018;11. doi:10.1177/1756285617749134
- Silvestri NJ, Wolfe GI. Myasthenia gravis. Semin Neurol. 2012;32(3):215-226. doi:10.1055/s-0032-1329200
Figures
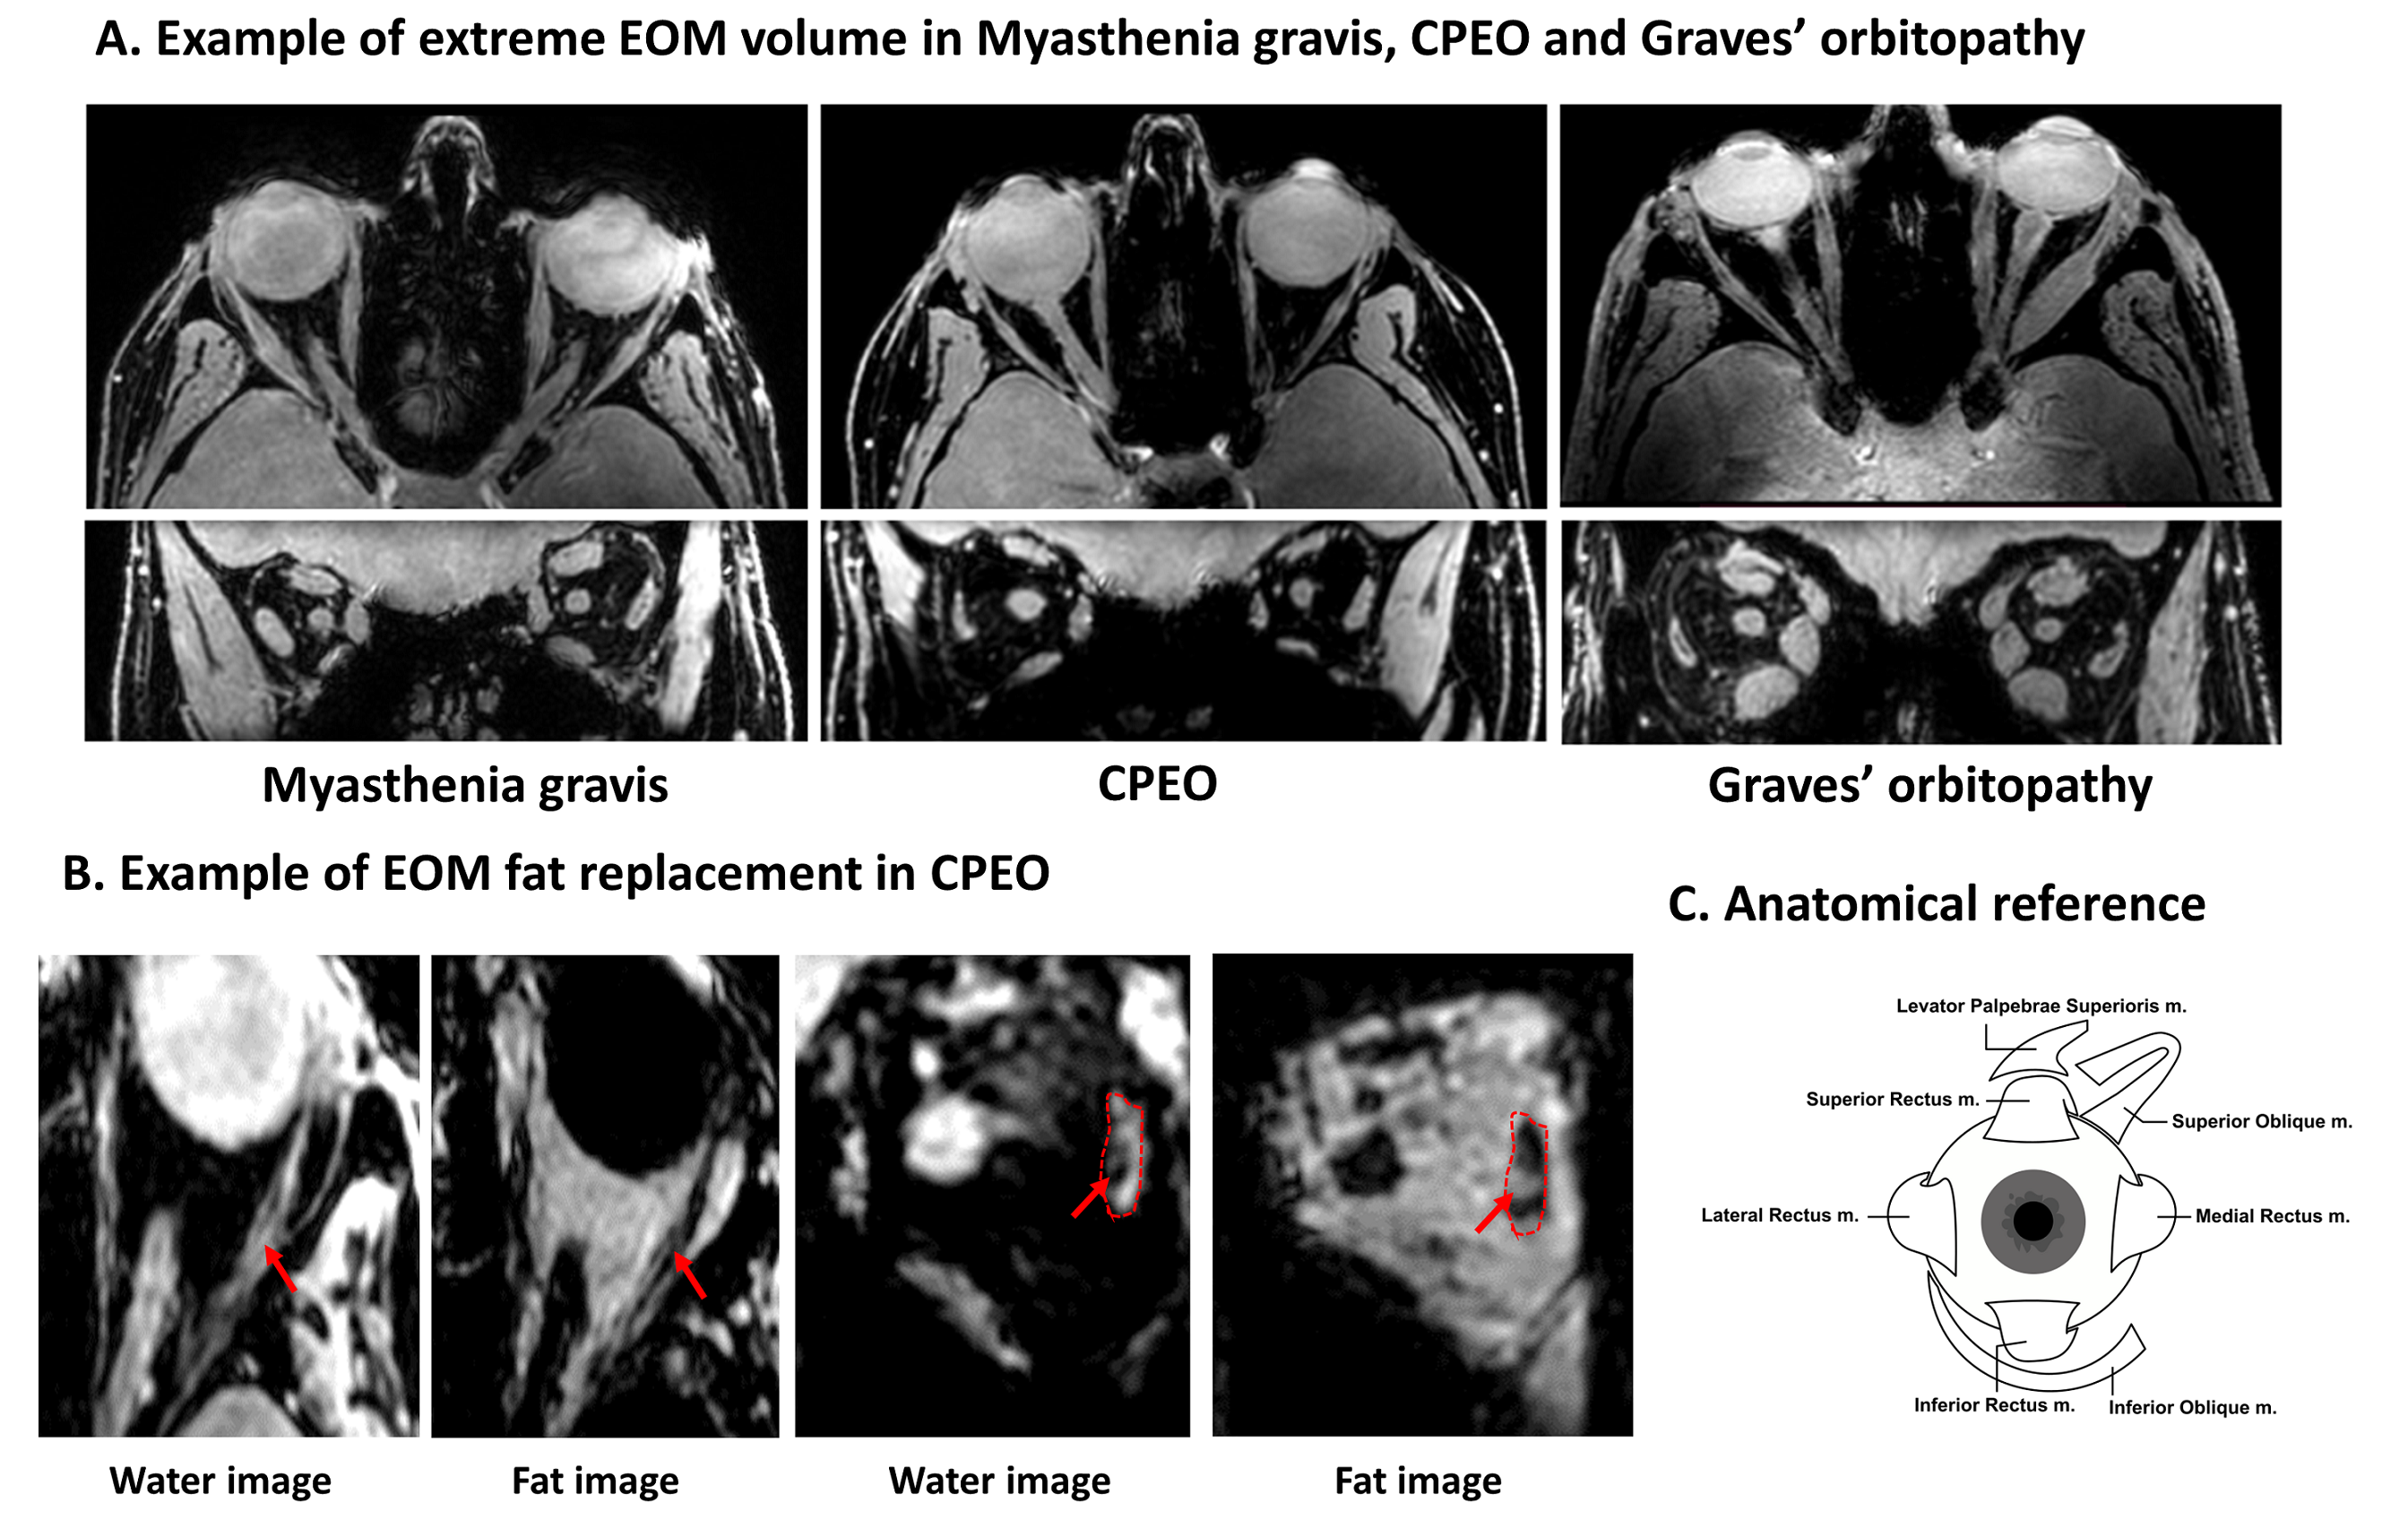
Figure 1: Dixon images depicting the eye muscles. A:
Transverse water image on top and coronal water image below. Demonstration of
volume changes in MG, CPEO and Graves’ orbitopathy. Notice the decrease in eye
muscle volume in CPEO and swelling in the Graves’ orbitopathy patient. B: Example
of extreme fat replacement of the eye muscles in CPEO, with the transverse
water and fat image on the left and the coronal water and fat image on the
right. Example of one orbit is shown and the fat replacement is indicated by an arrow. C: Anatomical reference of all eye muscles.
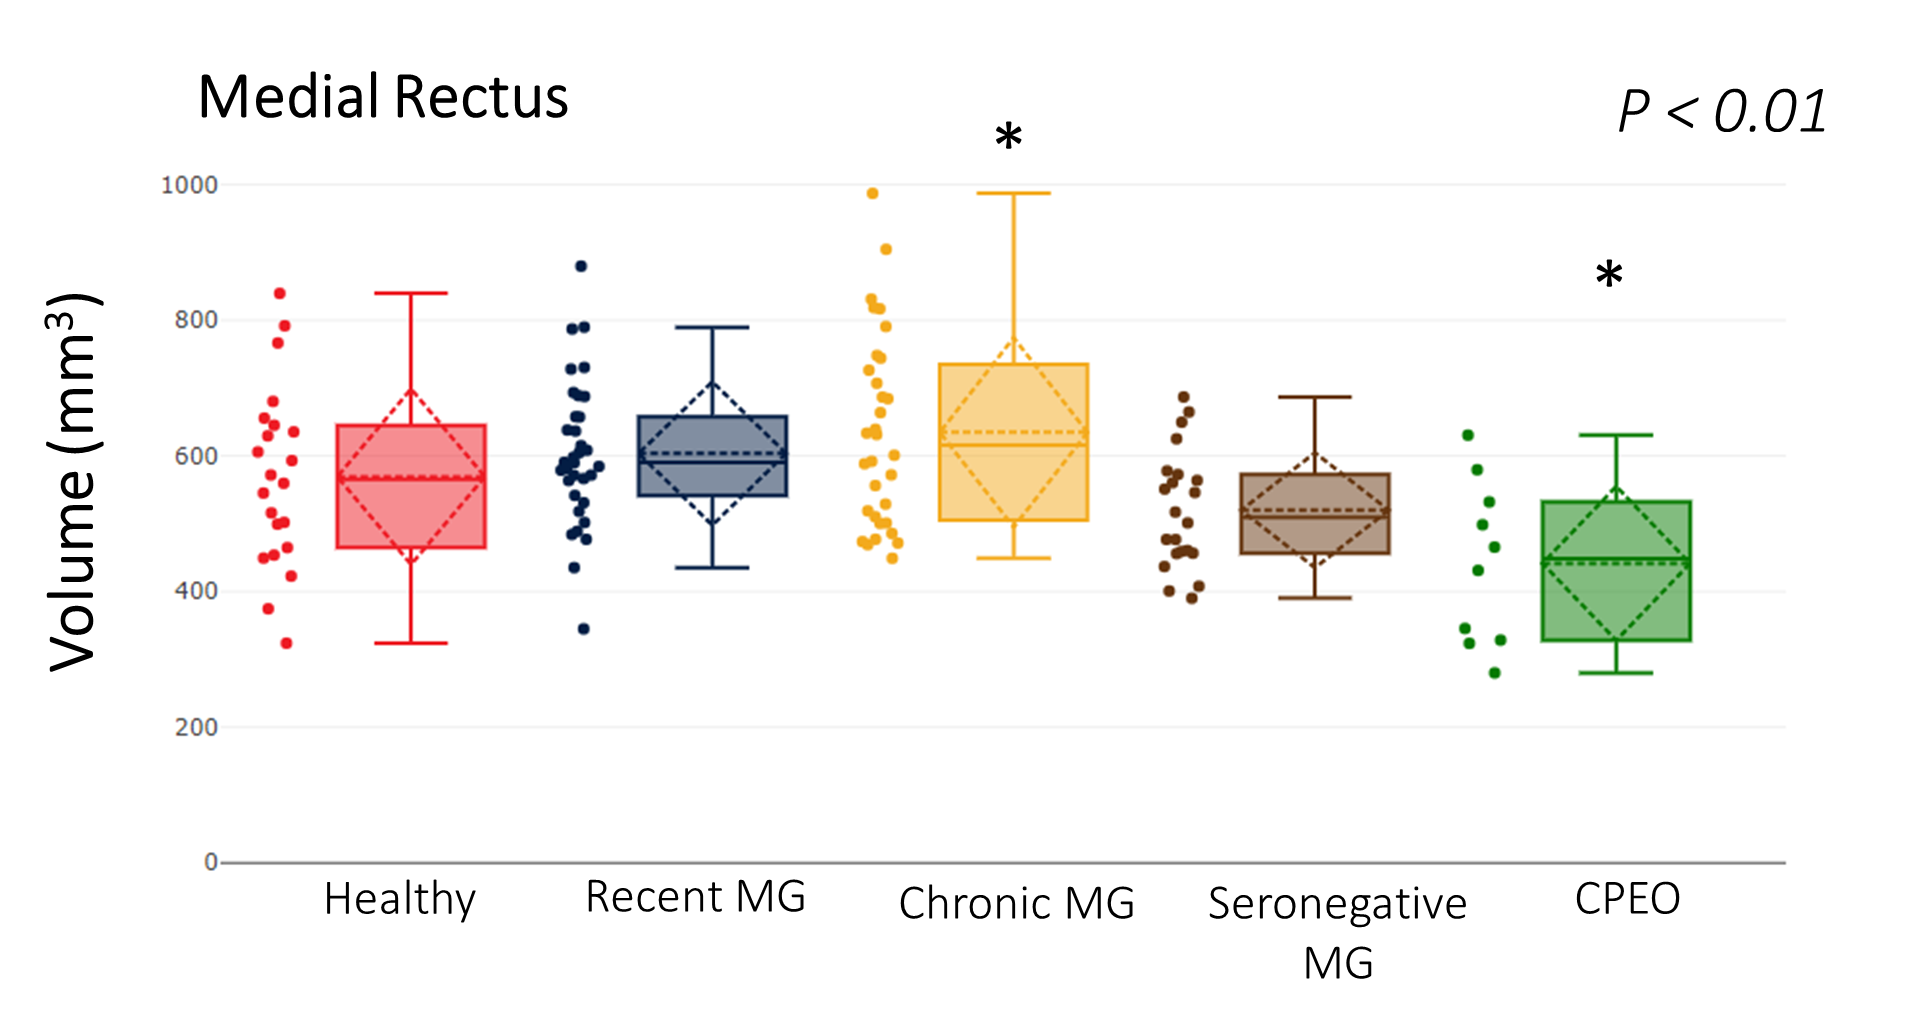
Figure 2: Muscle volume of the medial rectus eye muscle for all groups (healthy controls, recent MG, chronic MG, seronegative MG and CPEO). Increases in volume were observed for the chronic MG patients and a decrease in volume was observed for the CPEO patients (e.g. respectively for MR, 569±129, 603±106, 635±140, 520±85 and 442±114 mm3, p<0.01).
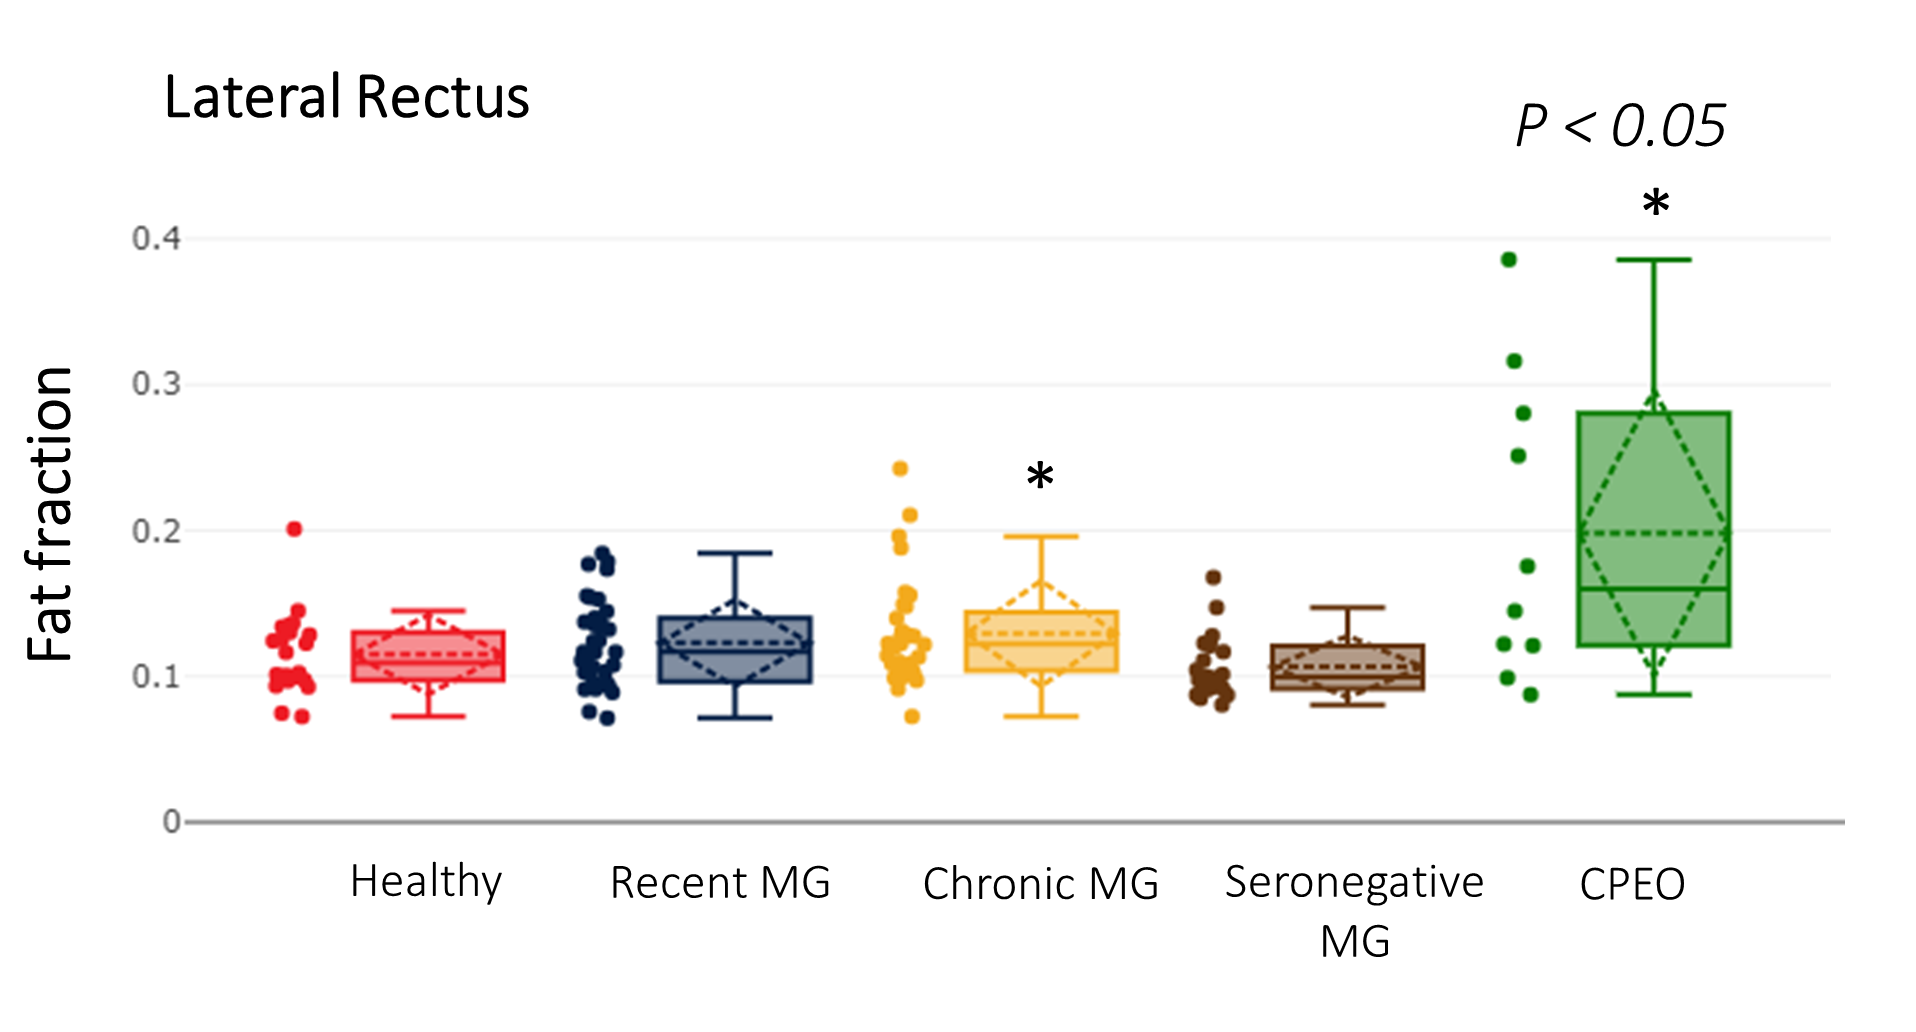
Figure 3: Fat fraction of all the superior rectus eye muscle for all groups (healthy controls, recent MG, chronic MG, seronegative MG and CPEO). Fat fractions were different between groups: slightly elevated in chronic MG patients and severely elevated in CPEO patients (e.g. respectively for LR, 12±2%, 15±4%, 15±5%, 12±3% and 20±10%).
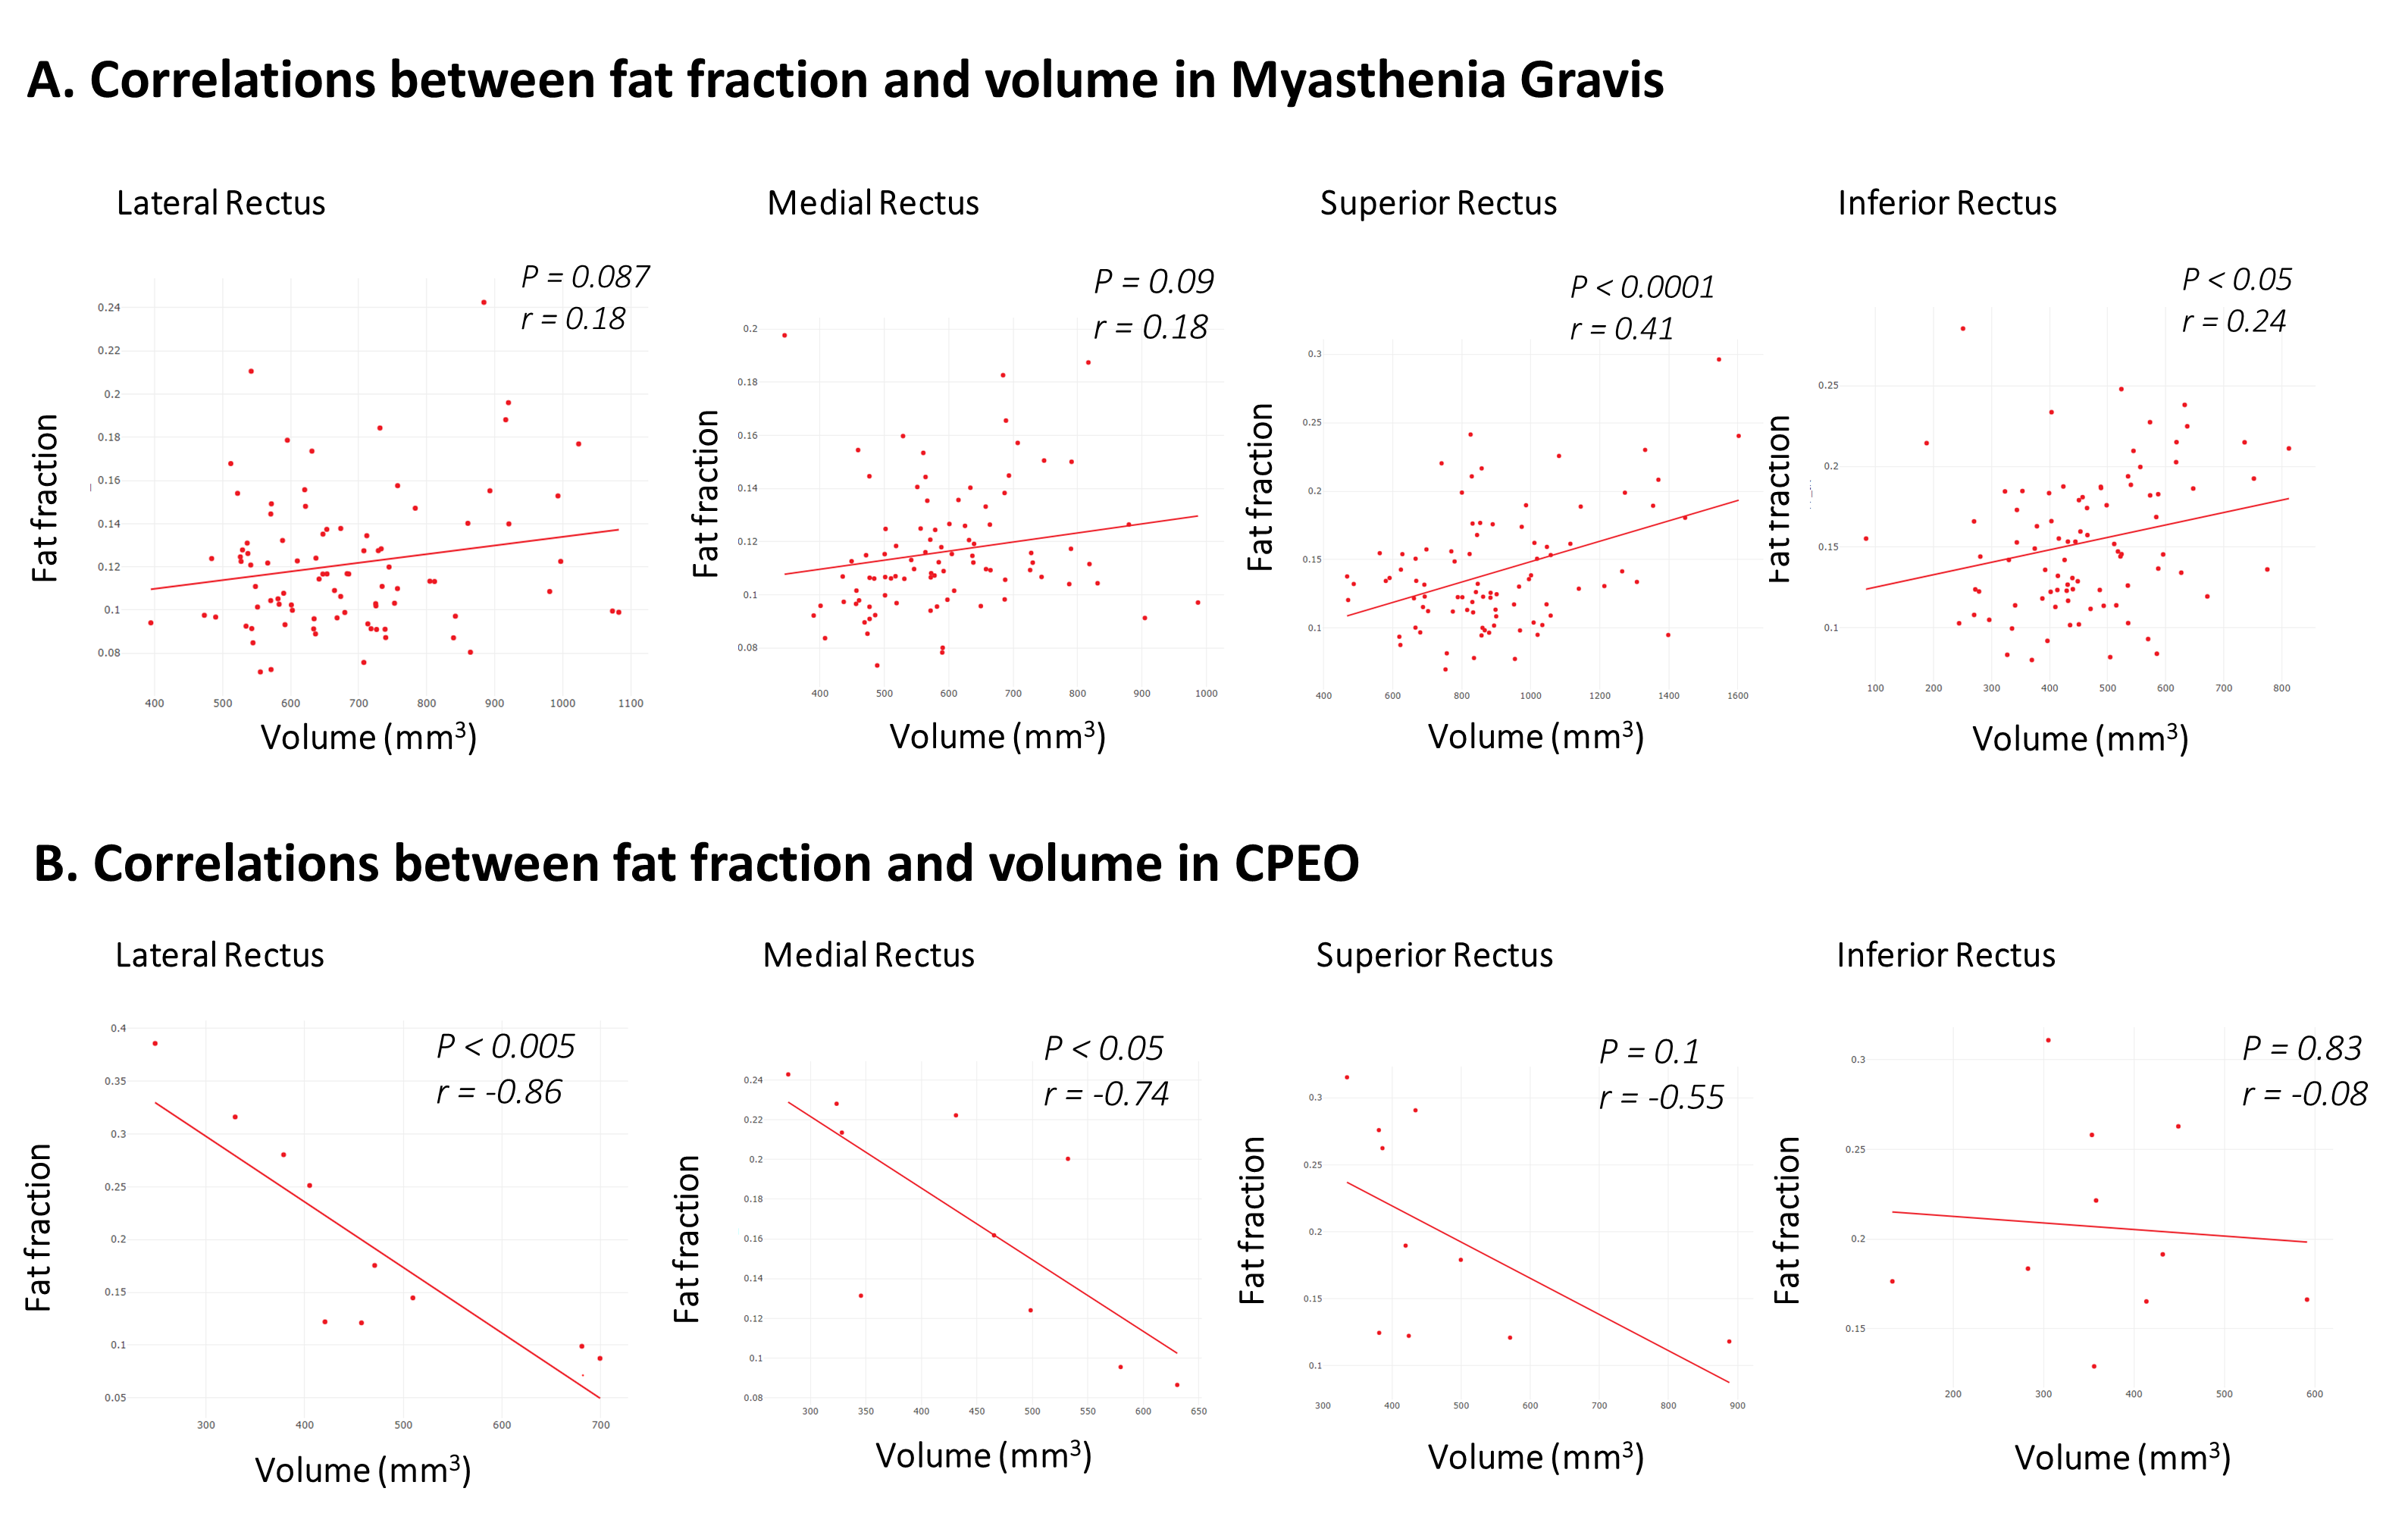
Figure 4: Correlations between eye muscle
volume and fat fraction. A positive correlation between eye muscle volume and
fat fraction was present for the SR (r=0.41, p < 0.0001) and the IR (r=0.24,
p < 0.05) in MG patients. On the contrary, a strong negative correlation
between eye muscle volume and fat fraction was observed in the LR (r=-0.86, p
< 0.005) and MR (r=-0.74, p < 0.05) in CPEO patients.
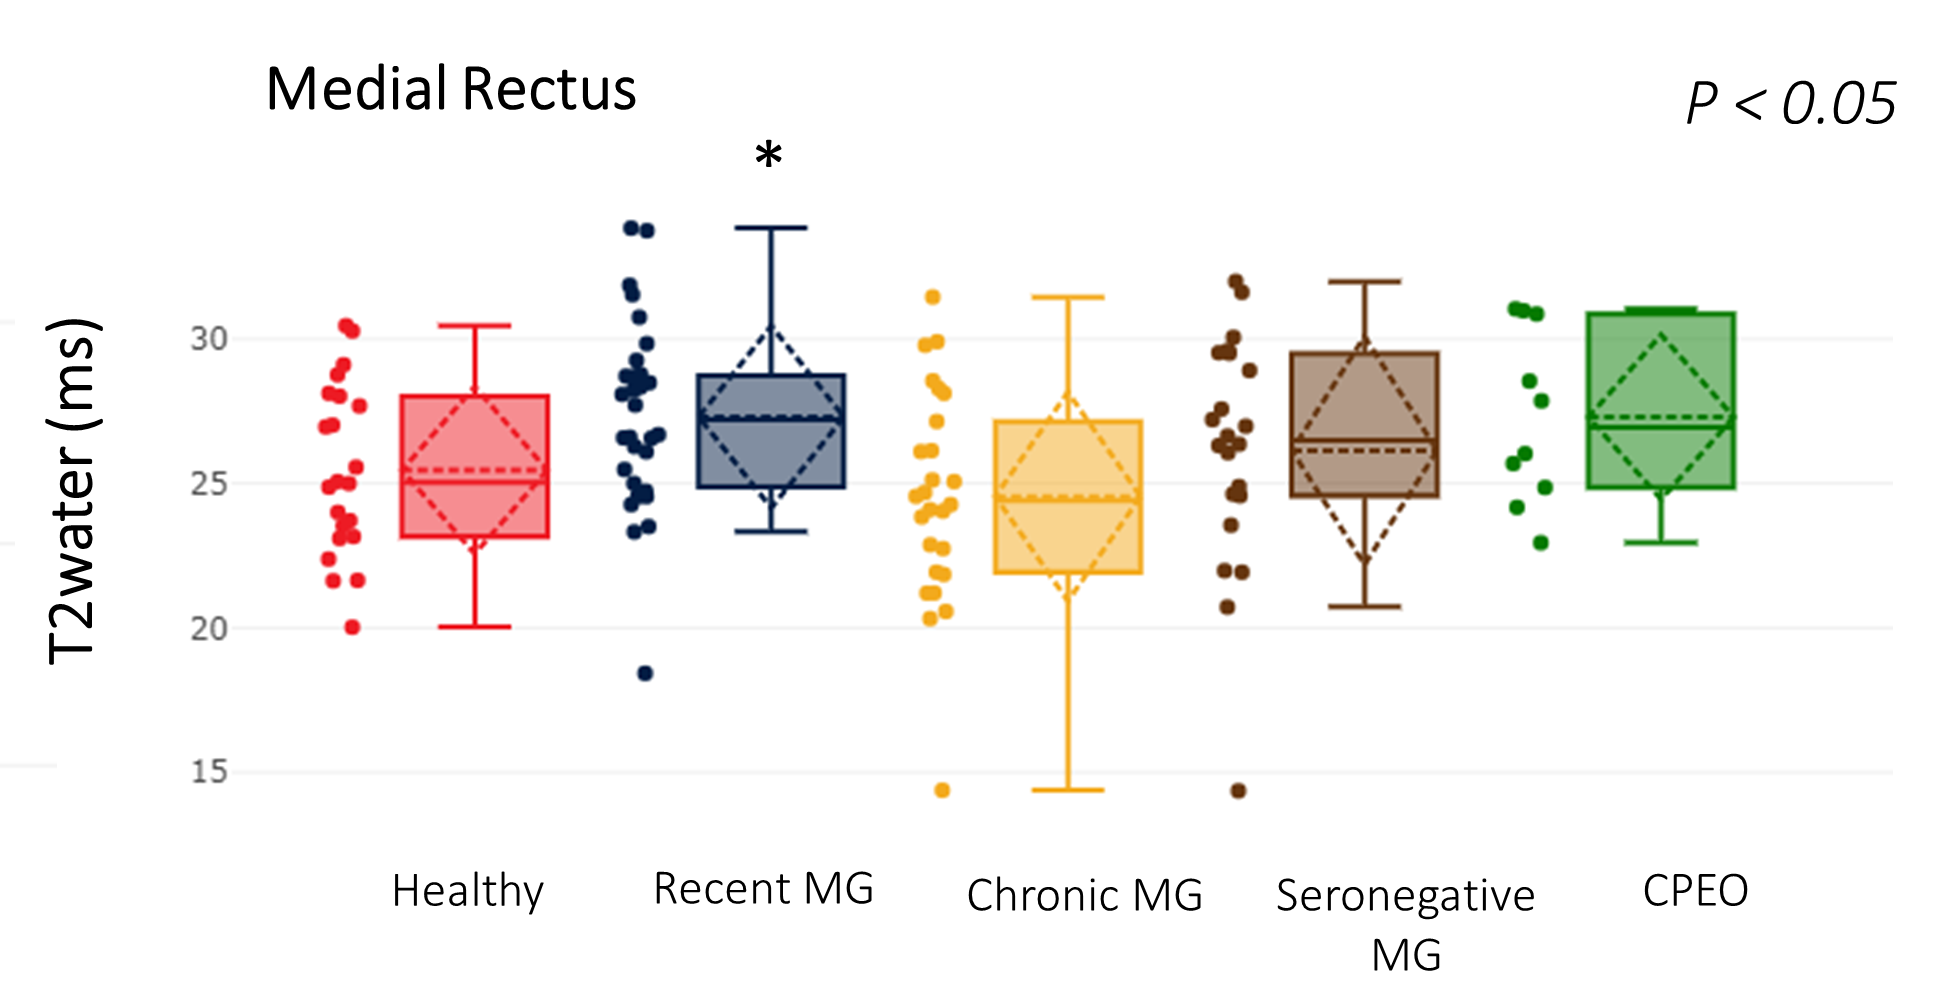
Figure 5: T2water of the medial rectus eye muscle for all groups (healthy controls, recent MG, chronic MG, seronegative MG and CPEO). The T2water was significantly different between groups in the MR and post-hoc analysis shows the difference is caused by a higher T2water in the recently diagnosed MG patients (respectively 25.5, 27.31, 24.55, 26.3 ms and 27.3±2.8, p < 0.05).
DOI: https://doi.org/10.58530/2022/0669