0668
Muscle hypertrophy in resistance training assessed with Diffusion Tensor Imaging1Department of Radiology, Stanford University, Stanford, CA, United States
Synopsis
5 healthy subjects consistently performed a declined squad training routine for 3 months. Every subject received an MRI scan before undergoing the training and subsequently every month until the end of the training. We observed a decrease in AD, MD and FA over the course of training, with a significant change after 1 month. Muscle volume increased, with changes only apparent at 3 months. Changes in diffusion parameters were predictive of changes in global volume. Our study shows that DTI can be a sensitive tool to study muscle hypertrophy and could be used for early monitoring of training and rehabilitation.
Introduction
The increase in muscle volume due to enlarged cell size (hypertrophy) is a goal of resistance training and rehabilitation, which typically results in increased functionality and increase in global muscle volume (1). Imaging methods such as ultrasound, MRI and CT are used to assess changes in global volume but fail at detecting early microscopic hypertrophy induced by interventions. The only method available to assess microscopic hypertrophy is biopsy, which is invasive and poorly tolerated (2). In order to provide better monitoring and optimize rehabilitation strategies, novel non-invasive methods to investigate early signs of muscle hypertrophy are needed (3). In this work we propose Diffusion Tensor Imaging (DTI) as a fast and non-invasive method to assess cellular hypertrophy in the thigh following a 12-weeks resistance training program. We hypothesize that DTI parameters in the quadriceps will show hypertrophic changes before changes in global volume become apparent.Methods
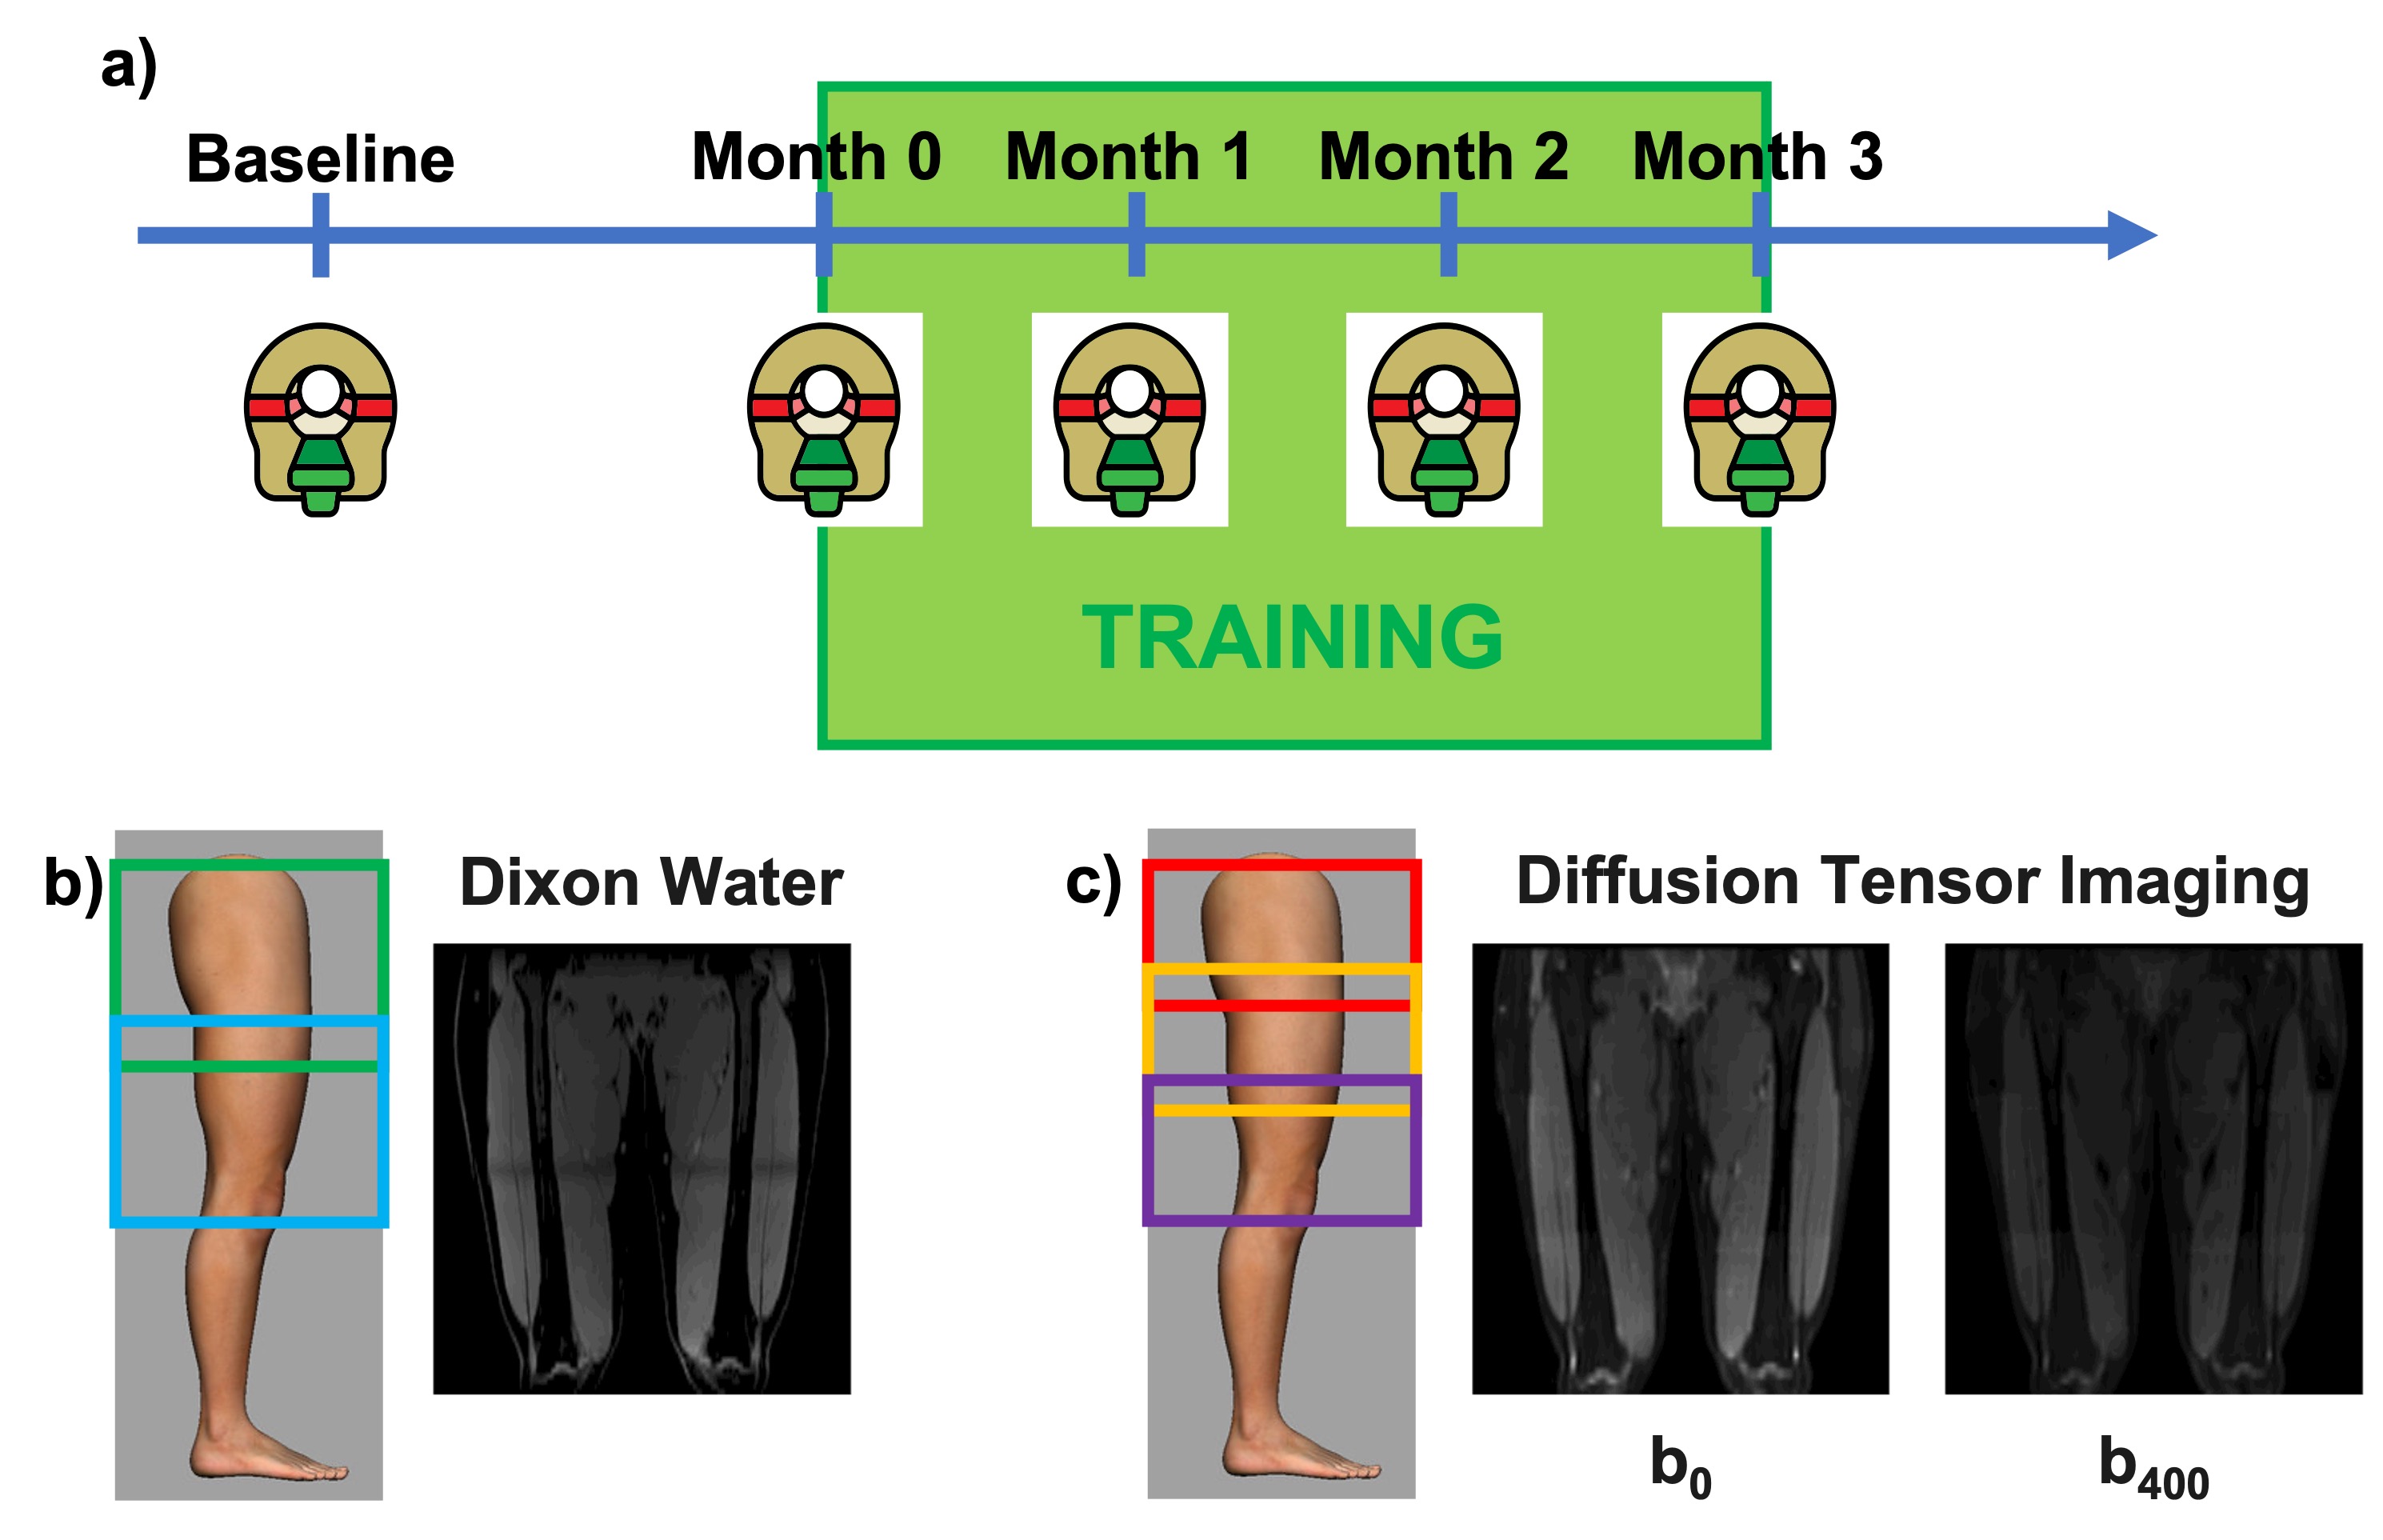
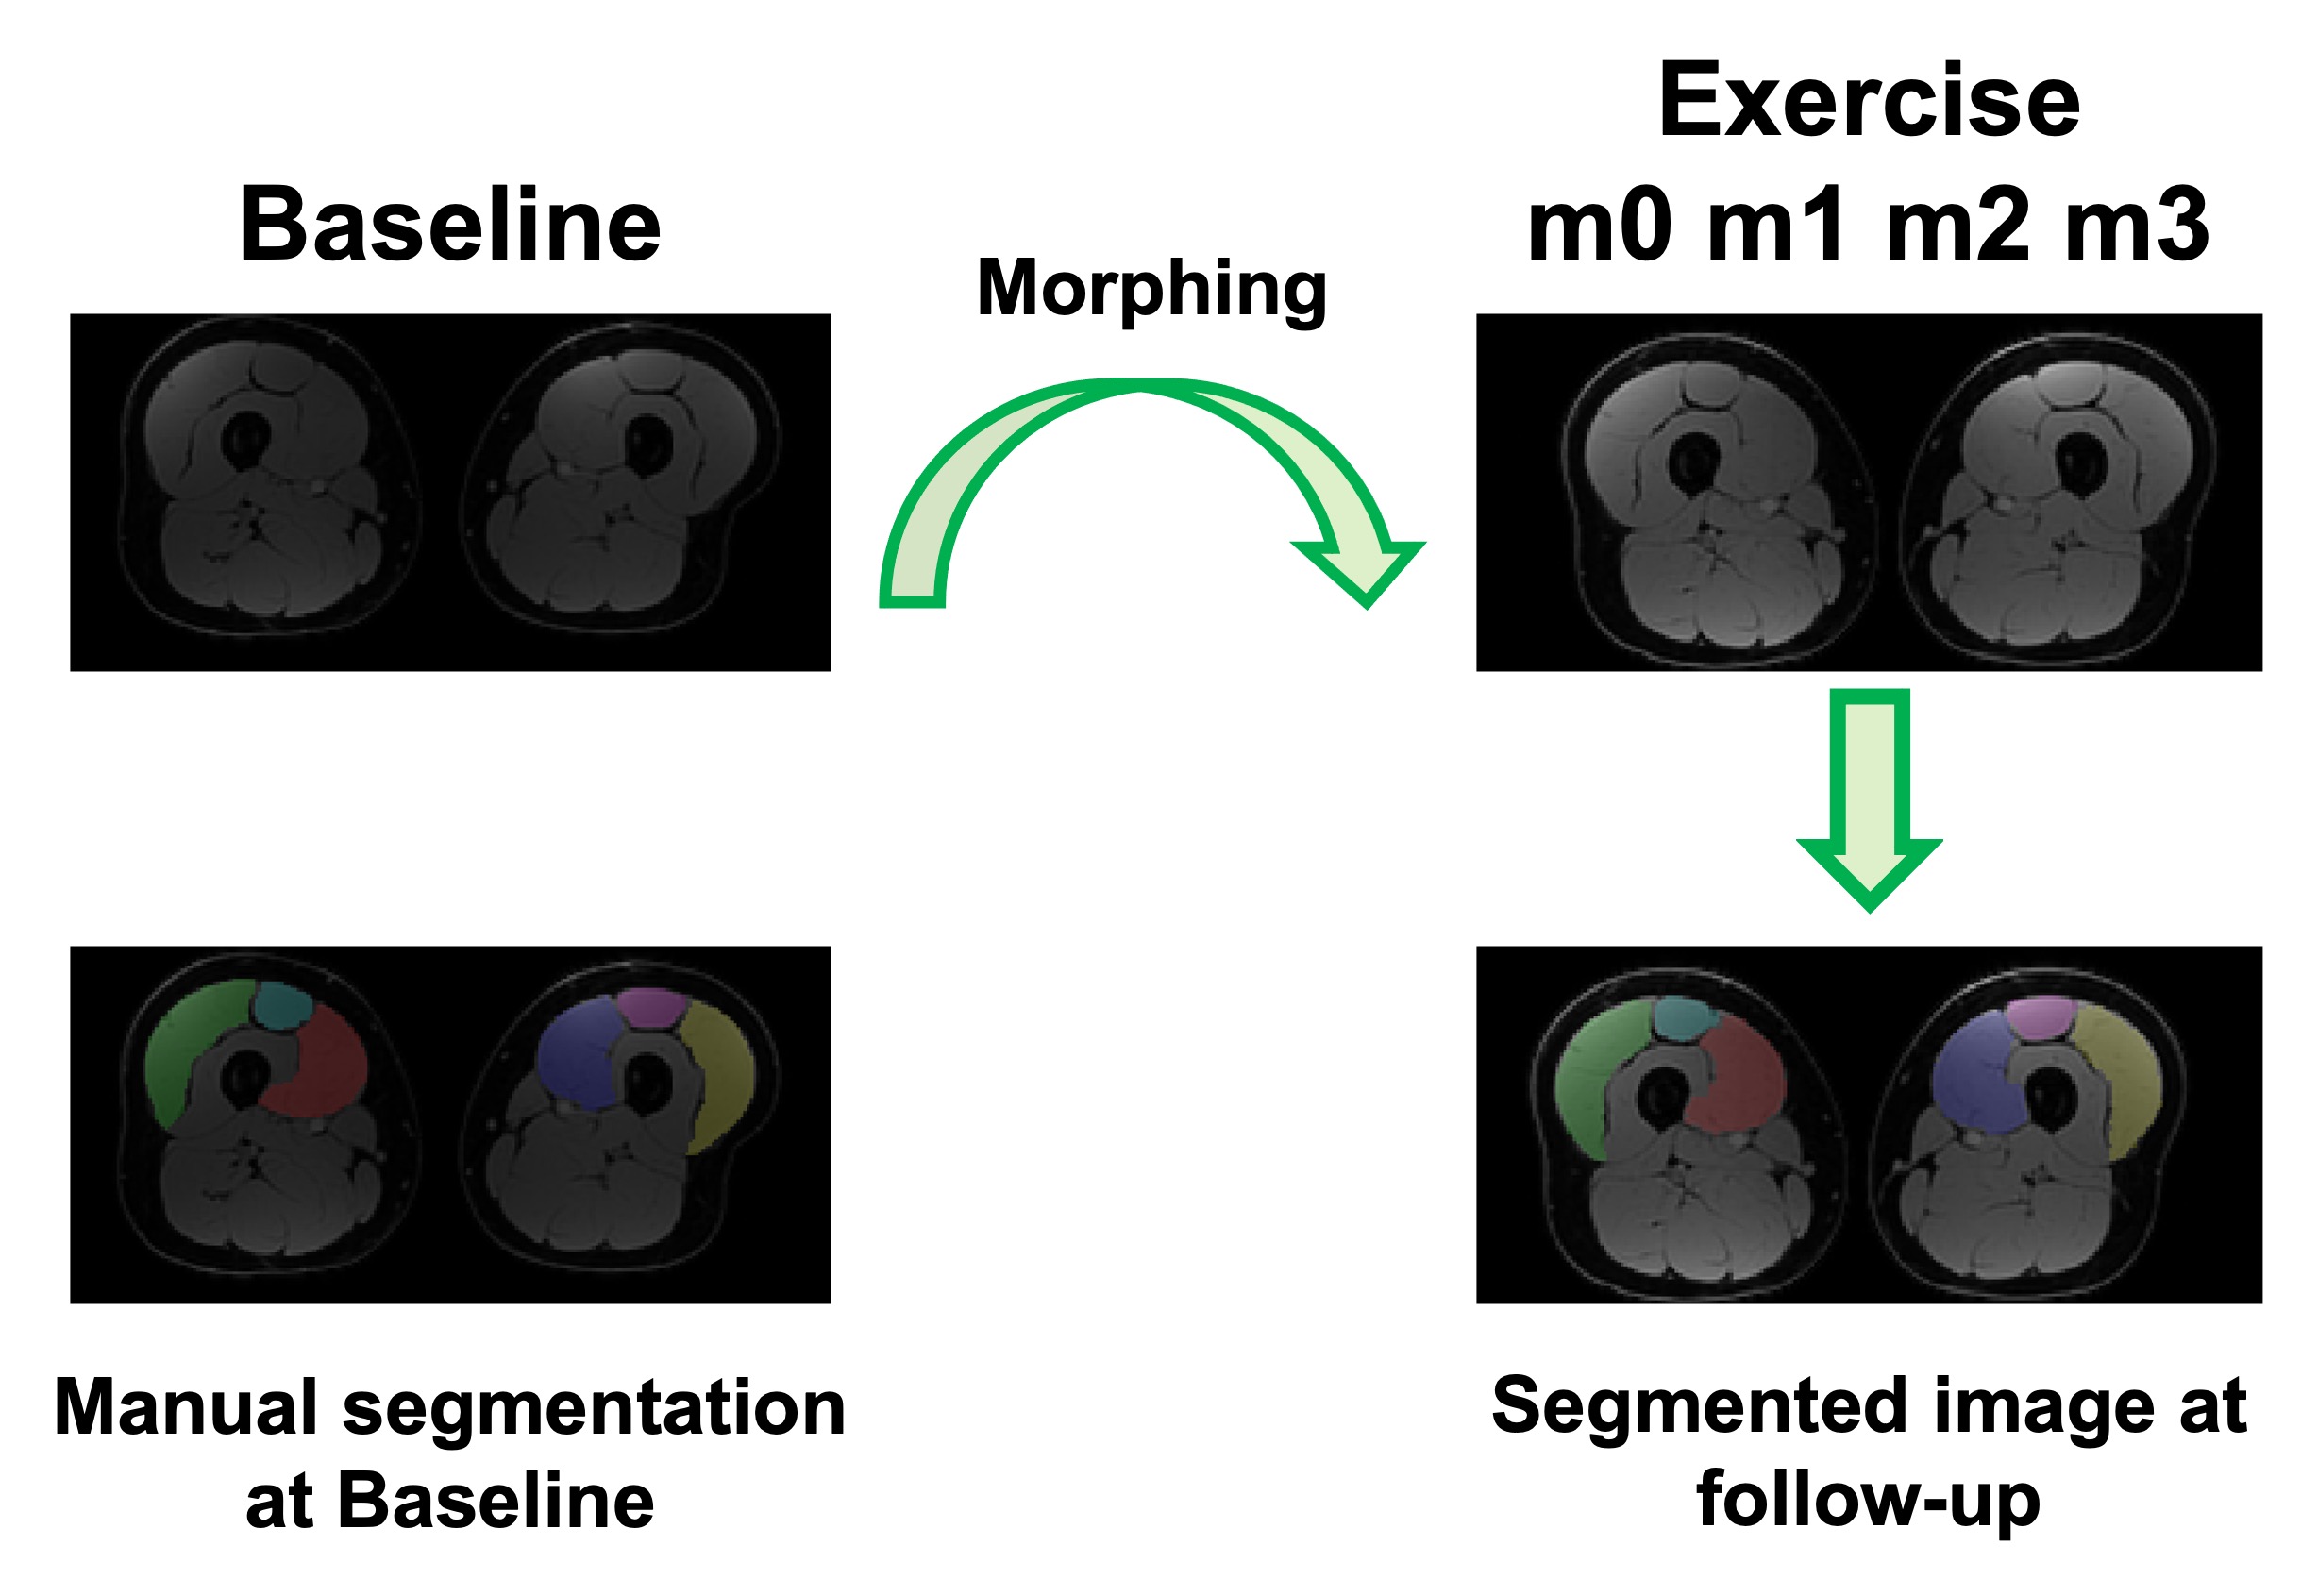
Five healthy participants (3 female, age:27±2 years, BMI:25±3kg/m2) underwent an exercise program consisting of three sets of 15 slow unilateral squats on a 25º decline board, which the subjects performed with both legs twice daily for 3-4 times a week for 12 consecutive weeks(4). MRI evaluation was performed at baseline and every subsequent 4 weeks (Figure 1).For each MRI timepoint, participants underwent a multi-stack upper leg bilateral scan that included DTI and Dixon water/fat-separated images, to assess morphology (Dixon: 3D GRE, ETL=6, matrix size=256x256x46, voxel size=1.56x1.56x5 mm3, TR=14 ms, TE1=1.2 ms, Flip Angle=5, NSA=1, 3min58s. DTI: single-shot EPI readout, b=0 s/mm2 (3 volumes) and b=400 s/mm2 (15 volumes), spectral fat saturation + SSGR, matrix =256x256x26, voxel=1.56x1.56x6 mm3, TR=3000ms, TE=43 ms, NSA=3, 8min15s). The vastus medialis (VM), vastus lateralis (VL), and rectus femoris (RF) were manually segmented in the right and left leg from the water images and used to extract Volume, Cross-Sectional Area (CSA), Fractional Anisotropy (FA), Axial Diffusivity (AD), Radial Diffusivity (RD), and Mean Diffusivity (MD) (Figure 2). A non-parametric Friedman test with a Nemenyi post-hoc was used to determine which parameters changed significantly over the course of training. Correlations between anatomical and diffusion parameters were investigated using Pearson correlation.
Results
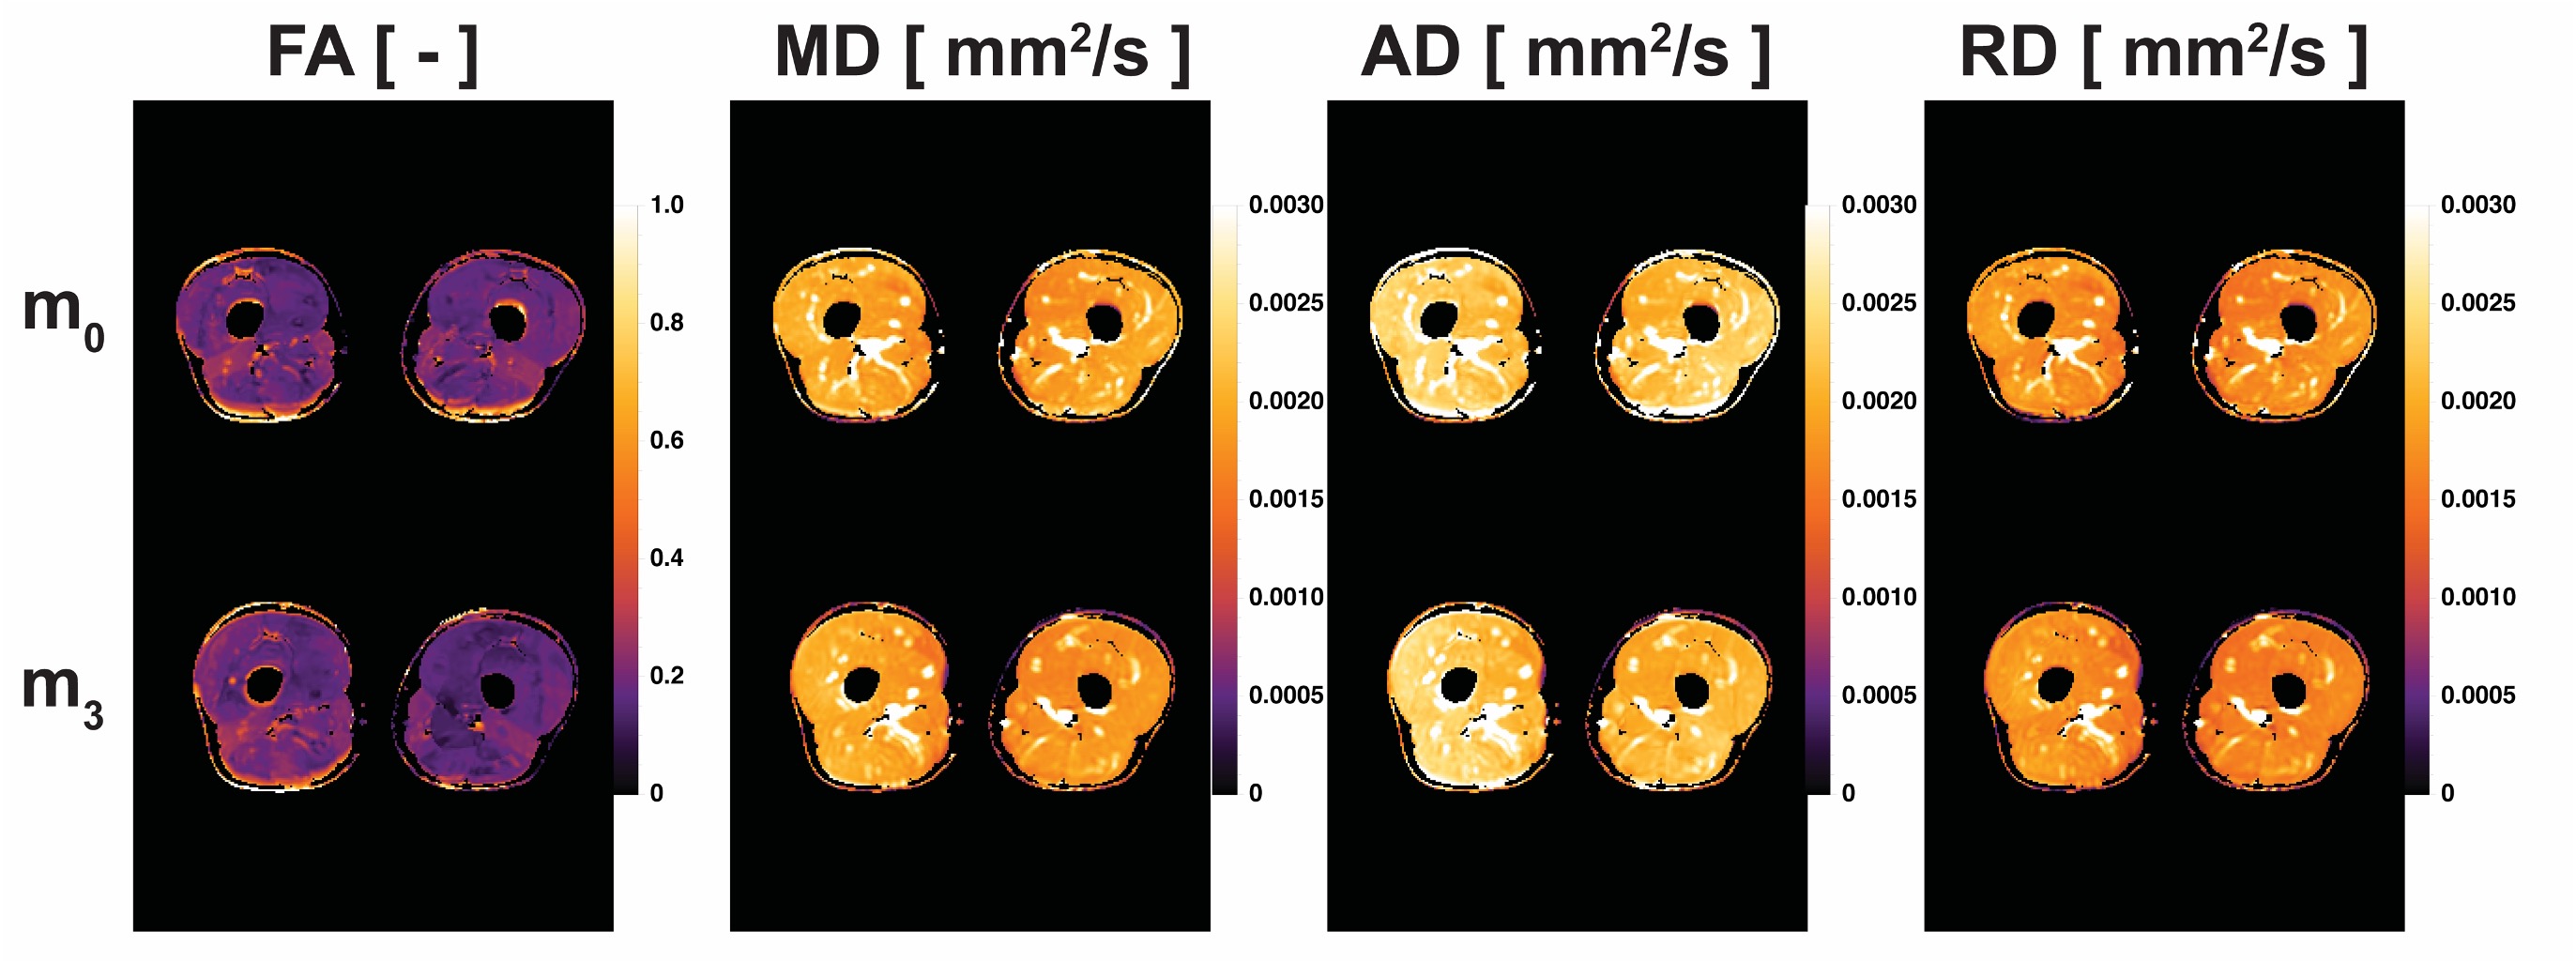
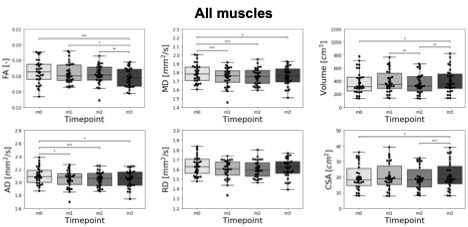
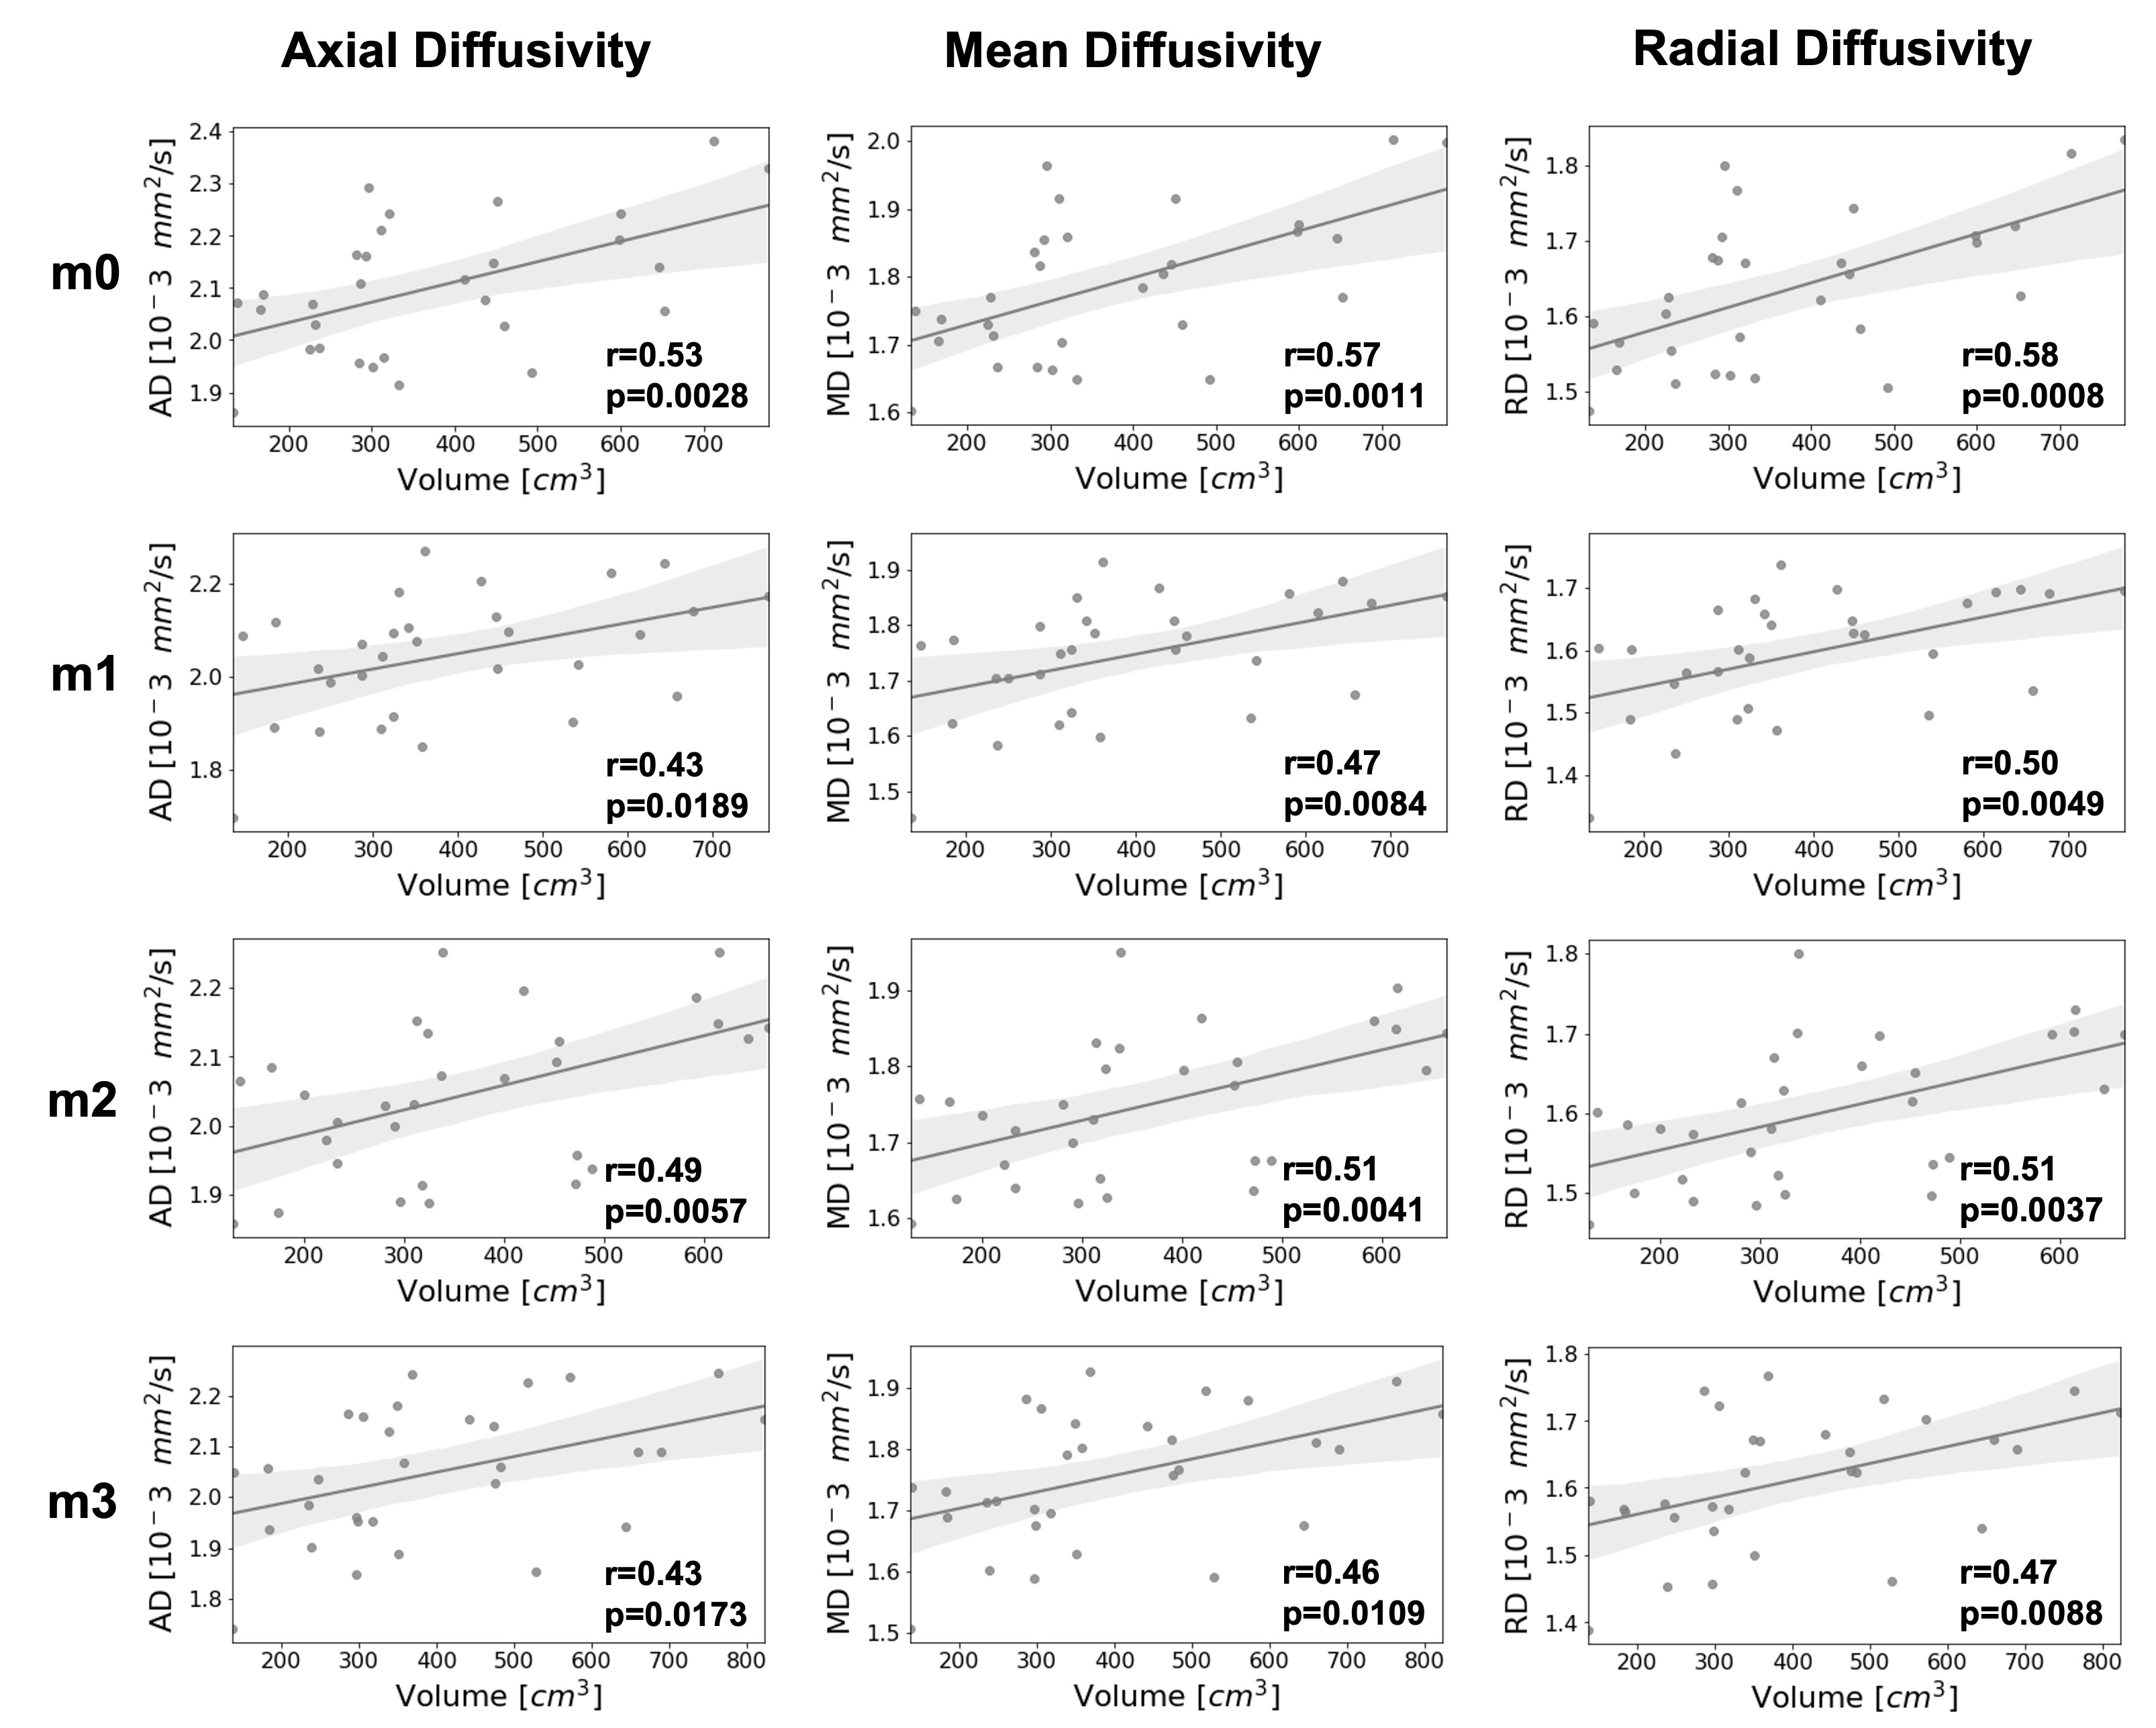
FA, MD, AD and RD were calculated at each time point (Figure 3). The training intervention had a statistically significant effect on FA (p = 0.0492), AD (p = 0.0116) and MD (p = 0.0116) with a decrease in all diffusion parameters over time except RD (p = 0.2583). The mean changes between timepoints m0 and m3 were -3,9%, -2.4% and -1.9% for FA, AD and MD respectively. Besides changes in diffusion parameters, we also observed a significant effect of exercise on quadriceps volume (p = 0.0001), with a 7.4% increase from m0 to m3 (p = 0.0118). Similarly, there was a significant effect of exercise on CSA (p = 0.0116), with a 4.9% increase from m0 to m3 (p = 0.0153). Interestingly, AD an MD showed a significant decrease after only 1 month of training (p=0.0118 and p=0.0010 respectively), while differences in Volume were only detected at 3 months (Figure 4).At every timepoint, bigger muscles were characterized by higher AD, MD and RD (Figure 5). The best predictor of percent changes in volume at 3 months were percent changes in AD (β=-1.37, R2=0.23, p=0.006), followed by changes in MD (β=-1.42, R2=0.18, p=0.016), and changes in RD (β=-1.28, R2=0.14, p=0.042).
Discussion and Conclusions
We measured a significant decrease in all DTI parameters (FA, MD, and AD) except RD over the course of training, together with an increase in Volume and CSA. MD and AD could detect microstructural differences from m0 induced by resistance training after 1 month, while morphological analysis based on muscle volume only showed changes after 3 months. These results suggest the ability of DTI to measure early changes in skeletal muscle size, which are undetectable when only looking at gross morphology.Hypertrophy is a well-known response to resistance training, which typically increases muscle strength by increasing the myofibrillar protein content and leading to an expansion in the number of sarcomeres in parallel and/or an increase in myofibril number. While it is not fully understood how specific micro- and macrostructural features of skeletal muscle affect the diffusion signal, the decrease in AD and MD as a function of training that we observed in this study could reflect the higher macromolecular content, which would hinder the motion of water molecules.Correlations between changes in Volume and diffusion parameters suggest that increase in individual muscle size could partially explain the increase in global muscle volume. Geometrical rearrangement, such as elongation of individual muscle fibers and changes in pennation angle (5) could explain some of the additional variance in the global volume.
Despite the limited number of subjects, our results suggest that DTI can detect microstructural hypertrophic changes in the quadriceps induced by resistance training. We also showed that DTI offers the opportunities to study early muscle adaptations that are not yet visible with morphological measurements. Taken together, our preliminary results demonstrate the potential of skeletal muscle DTI as a non-invasive tool to optimize and monitor training and rehabilitation.
Acknowledgements
No acknowledgement found.References
(1) Zacharia E, Spiliopoulou P, Methenitis S, et al.: Changes in muscle power and muscle morphology with different volumes of fast eccentric half-squats. Sports 2019.
(2) Haun CT, Vann CG, Roberts BM, Vigotsky AD, Schoenfeld BJ, Roberts MD: A critical evaluation of the biological construct skeletal muscle hypertrophy: Size matters but so does the measurement. Front Physiol 2019; 10(MAR):1–23.
(3) Lemberskiy G, Feiweier T, Gyftopoulos S, Axel L, Novikov DS, Fieremans E: Assessment of myofiber microstructure changes due to atrophy and recovery with time-dependent diffusion MRI. NMR Biomed 2021; 34:1–11.
(4) Lee D, Lee S, Park J: Impact of decline-board squat exercises and knee joint angles on the muscle activity of the lower limbs. J Phys Ther Sci 2015; 27:2617–2619.
(5) Brook MS, Wilkinson DJ, Mitchell WK, et al.: Skeletal muscle hypertrophy adaptations predominate in the early stages of resistance exercise training, matching deuterium oxide-derived measures of muscle protein synthesis and mechanistic target of rapamycin complex 1 signaling. FASEB J 2015; 29:4485–4496.
(6) Garyfallidis E, Brett M, Amirbekian B, et al.: Dipy, a library for the analysis of diffusion MRI data. Front Neuroinform 2014; 8(FEB):1–17.
Figures