0667
Age-related changes in human skeletal muscle microstructure and architecture assessed by DT-MRI and their association with muscle strength1Norwich Medical School, University of East Anglia, Norwich, United Kingdom, 2Department of Radiology, Leiden University Medical Center, Leiden, Netherlands, 3Emory University School of Medicine, Atlanta, GA, United States, 4Vanderbilt University Institute of Imaging Science, Vanderbilt University, Nashville, TN, United States, 5Translational Gerontology Branch, National Institute on Aging, National Institutes of Health, Baltimore, MD, United States, 6Laboratory of Clinical Investigation, National Institute on Aging, National Institutes of Health, Baltimore, MD, United States, 7Department of Neurology, University of Maryland School of Medicine, Baltimore, MD, United States
Synopsis
Here we apply diffusion-tensor-(DT)-MRI to study muscle microstructural and architectural changes with healthy ageing in 94 participants (median age=56, range=22-89yrs). Fractional anisotropy (FA) and mean diffusivity (MD), were calculated for 12 thigh muscles, as were pennation angle, fascicle length, fibre curvature, and physiological cross-sectional area (PCSA) for the rectus femoris and biceps femoris longus. Knee extension/flexion torques were also measured. FA and MD were significantly associated with age (β=0.34 and −0.34, p<0.05), as were architecture parameters. Pennation angle and PCSA were positively associated with strength. This may prove useful for studying muscle response to interventions designed to delay sarcopenia.
INTRODUCTION
Diffusion-tensor (DT)-MRI is proving increasingly useful for studying human skeletal muscle architecture. Parameters such as fractional anisotropy (FA) and mean diffusivity (MD) are sensitive to histological features such as the decrease in muscle fibre size that occurs in sarcopenia—the loss of muscle mass and function with ageing. Only a few pre-clinical and human studies have investigated changes in DT-MRI metrics with age;1-8 however, these studies were conducted in relatively small samples with somewhat narrow age ranges, or show data for only one sex. A more comprehensive application in a larger cohort of male and female participants could elucidate age-related effects in DT-MRI and tractography metrics.In this work we use DT-MRI to probe thigh muscle microstructure and architecture in a large healthy-ageing cohort, with the aim of characterising age-related skeletal muscle microstructural and architectural differences using DT-MRI and comparing these to functional measures such as muscle strength.
METHODS
A total of 94 participants (median age=56, range=22-89yrs) were recruited as part of the GESTALT longitudinal study of ageing. Imaging experiments were conducted on a 3T scanner (Achieva, Philips Healthcare, NL) with a 32-channel cardiac coil for signal reception.Two-point 2D Dixon was applied in the left thigh as an anatomical reference. DT-MRI was applied with the following parameters: spin echo single-shot EPI, TR/TE=3,500/33ms; FOV=256×225mm; 30 slices, thickness=6mm; in-plane resolution=2.56×2.61mm; 8 averages; SENSE factor=2; spectral adiabatic inversion recovery and slice-select gradient reversal fat suppression; and 15 gradient directions, with b=0 and 450s/mm2. After DT-MRI, B0 maps were collected to correct for susceptibility-related distortions. Noise scans, without RF or gradients, were collected calculate signal-to-noise ratios (SNRs).
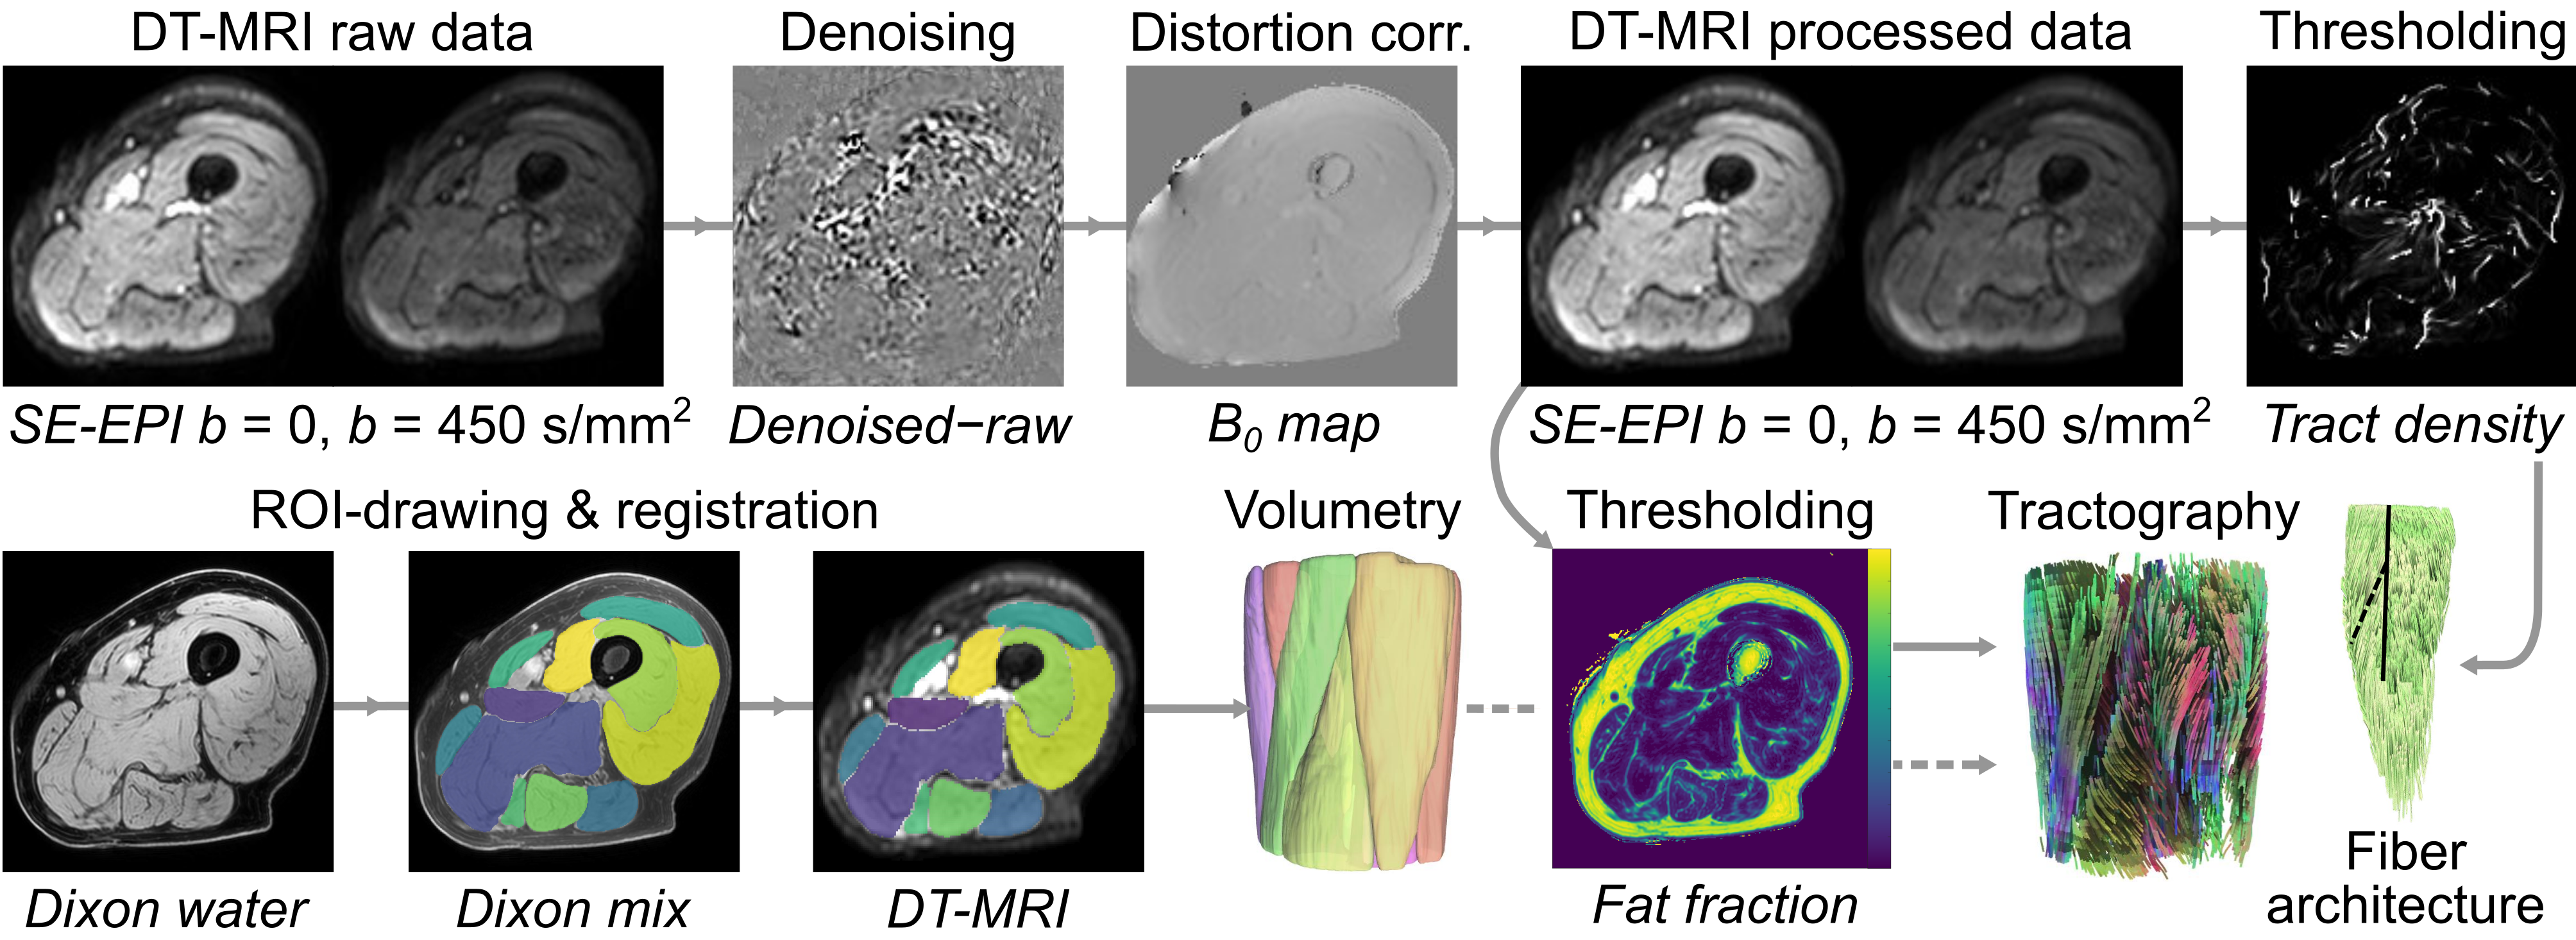
Our processing pipeline is summarised in Figure 1. Briefly, DT-MRI data were denoised via an overcomplete local principal component analysis filter,9 and distortion and eddy-current corrected in FSL (FMRIB, University of Oxford, UK). SNR was estimated using a region-of-interest (ROI) drawn over the muscle area of the thickest part of the thigh.10 Muscle ROIs were drawn on Dixon water images in the: rectus femoris (RF); vastus intermedius, medialis, and lateralis; sartorius; gracilis; adductor magnus; adductor longus; semimembranosus; semitendinosus; and biceps femoris short and long (BFL) heads. To transform ROIs into DT-MRI image space, Dixon images were aligned to DT-MRI data using elastix (v5.0.0), and transformations were applied per ROI.
Diffusion-tensor calculation and fibre tractography were performed in DSI Studio (Fang-Cheng Yeh, Carnegie Mellon University, USA), with muscle ROIs serving as seed regions for fibre tracking, and regions of high tract density or fat fraction>35%, serving as terminative regions. Muscle fascicle lengths, fibre pennation angles, and curvatures were estimated in the RF and the BFL as the length of a polynomial curve fitted to each fibre tract, the angle between the origin-insertion of a fascicle and the muscle’s long axis, and via the Frenet-Serret formula, respectively. Physiological cross-sectional area (PCSA) was determined by dividing muscle volumes by mean fascicle length.
Finally, left-leg strength was evaluated during concentric knee-extension and flexion exercises using an isokinetic dynamometer (Biodex Medical Systems, Inc., USA)
RESULTS
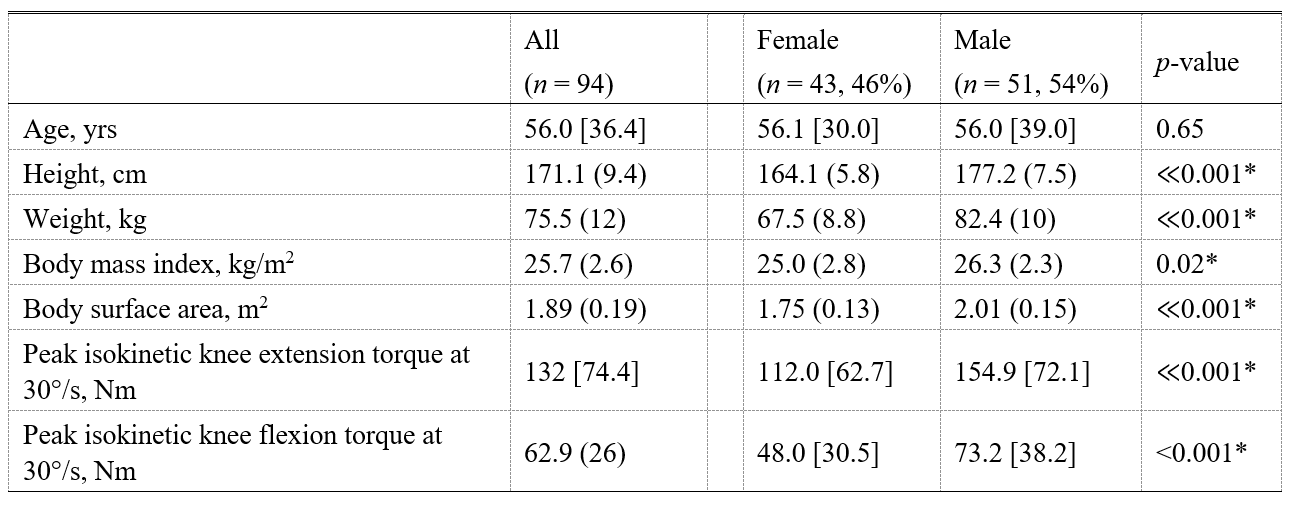
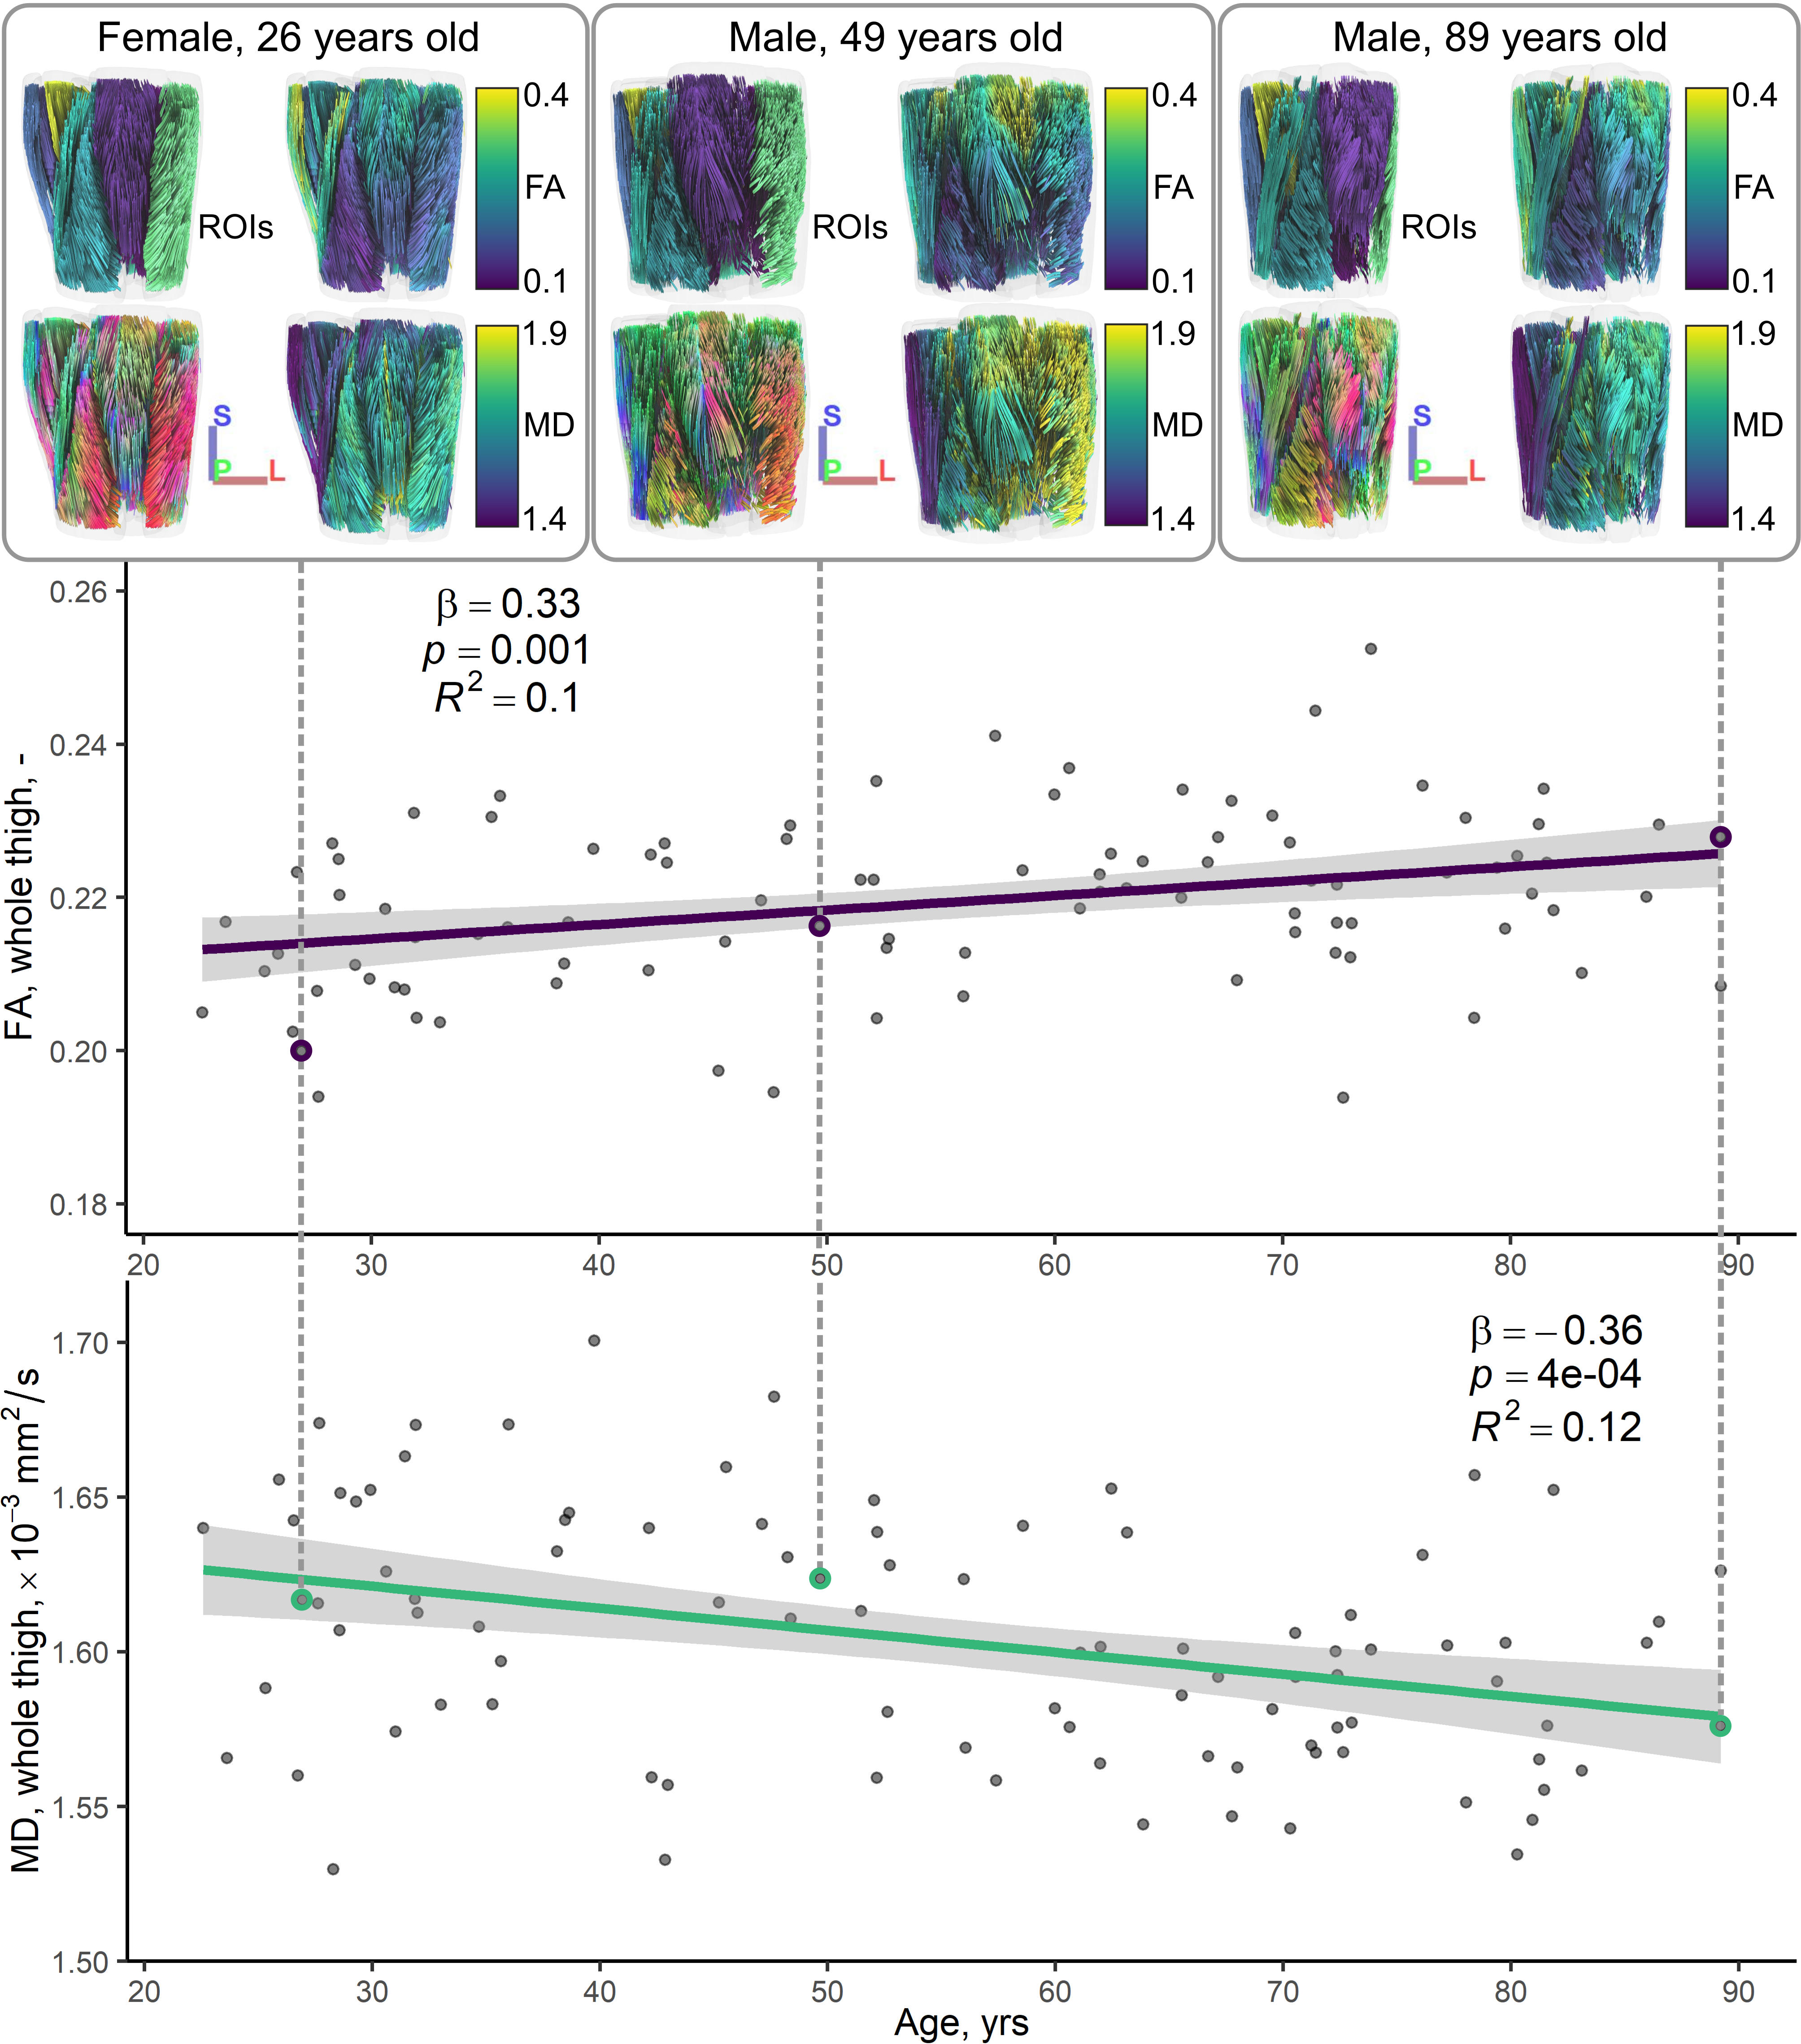
Table 1 shows demographic and strength data for our cohort. All DT-MRI datasets showed SNRs greater than the minimum of 25 recommended for tractography.11Figure 2 illustrates relationships between conventional DT-MRI measures and age, showing volume-weighted averages of FA and MD for the whole thigh. Both measures were significantly associated with age after adjusting for sex (β=0.34 for FA, β=−0.34 for MD; p<0.05).
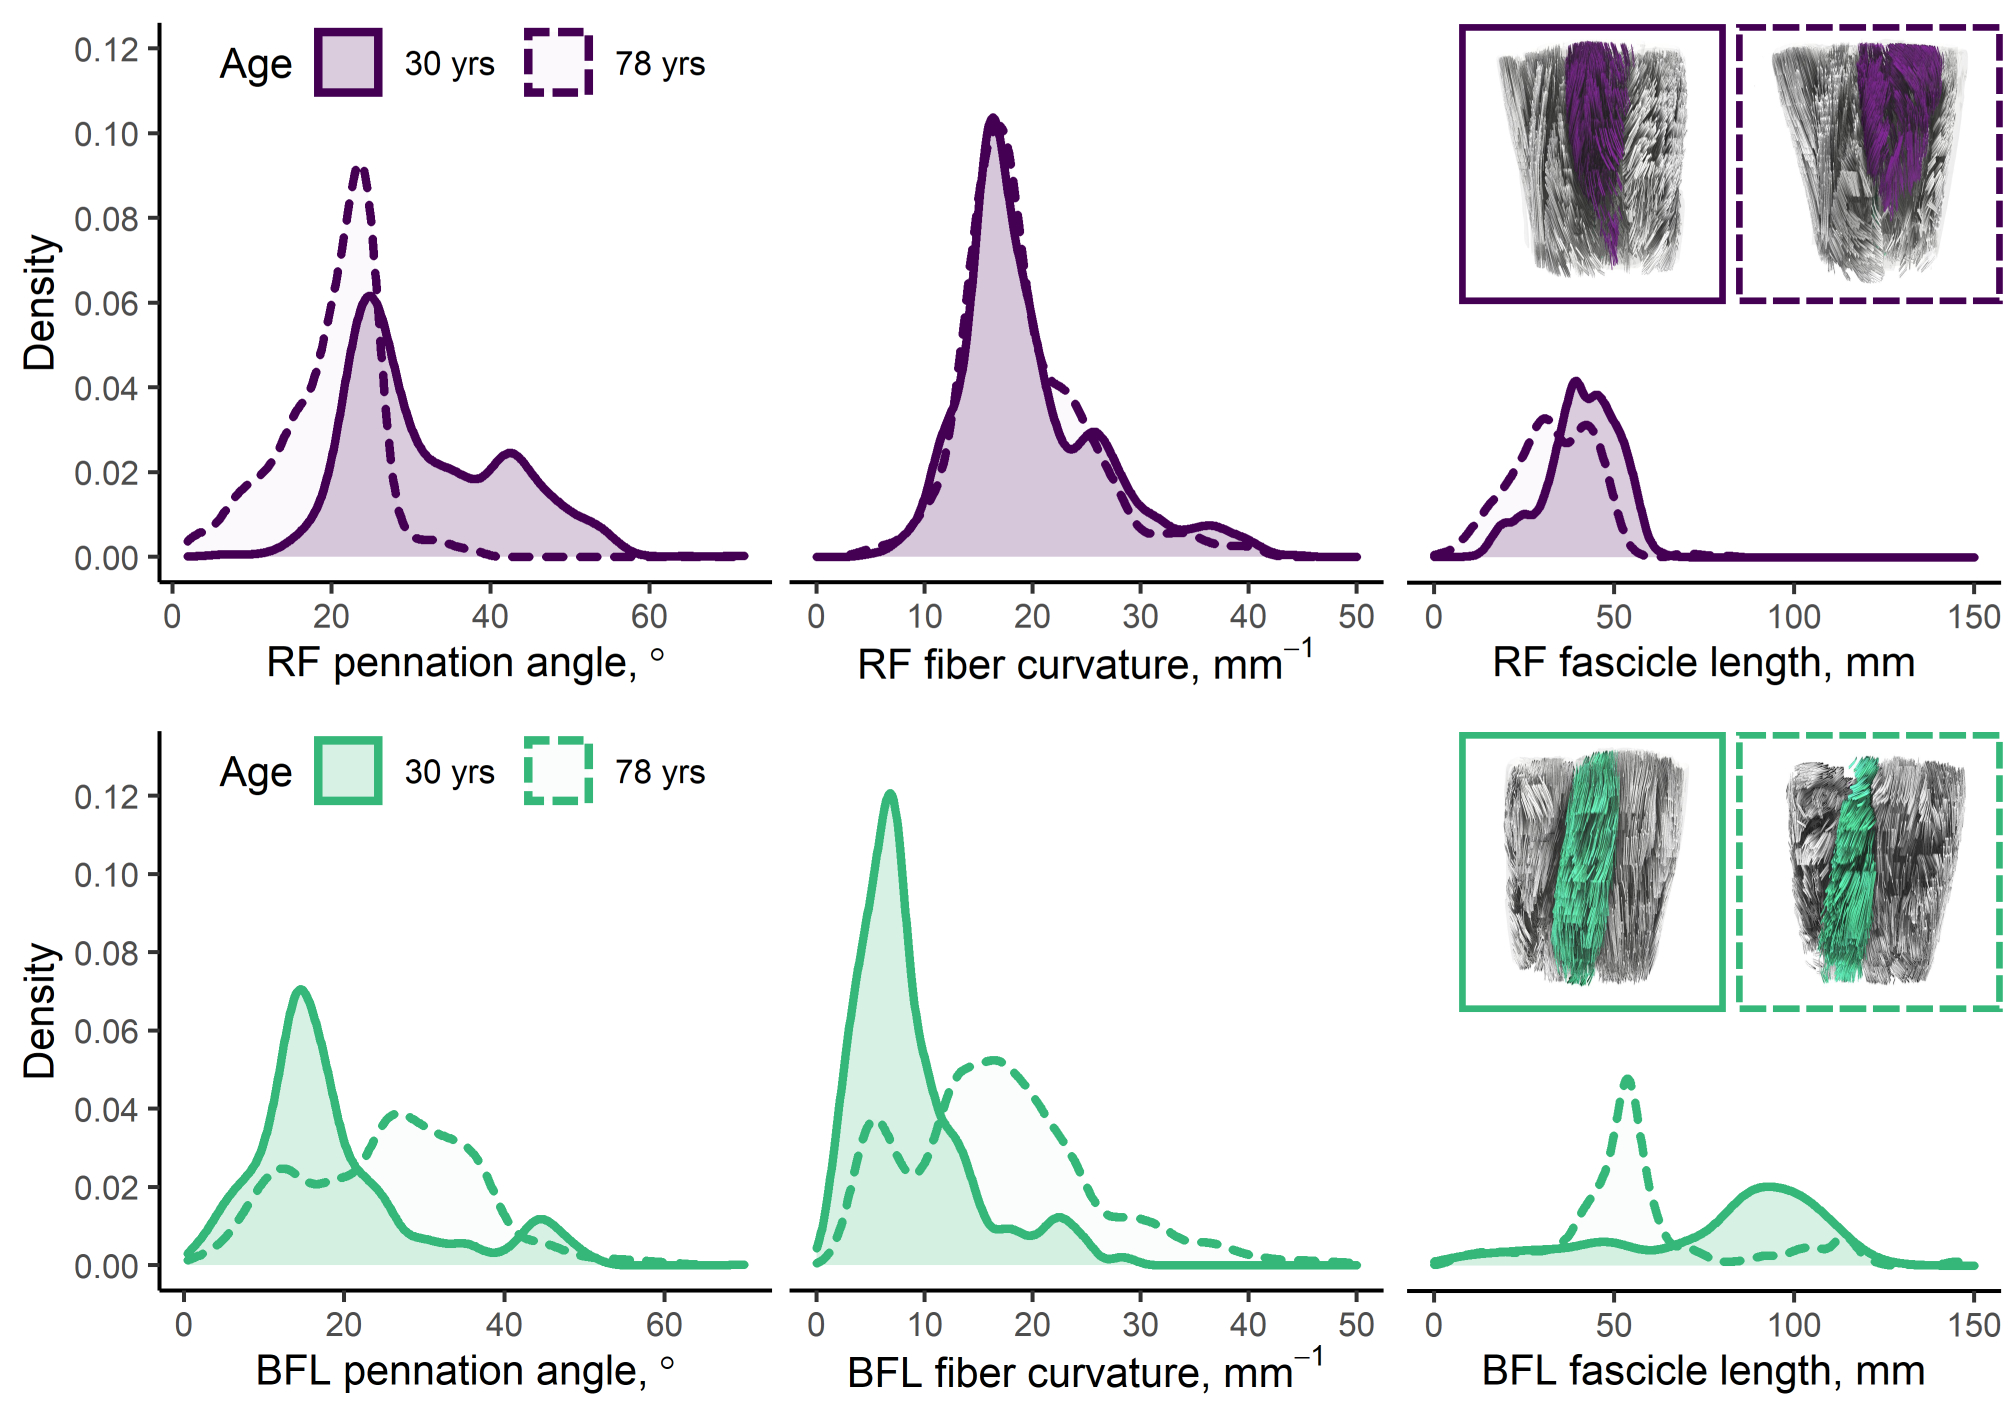
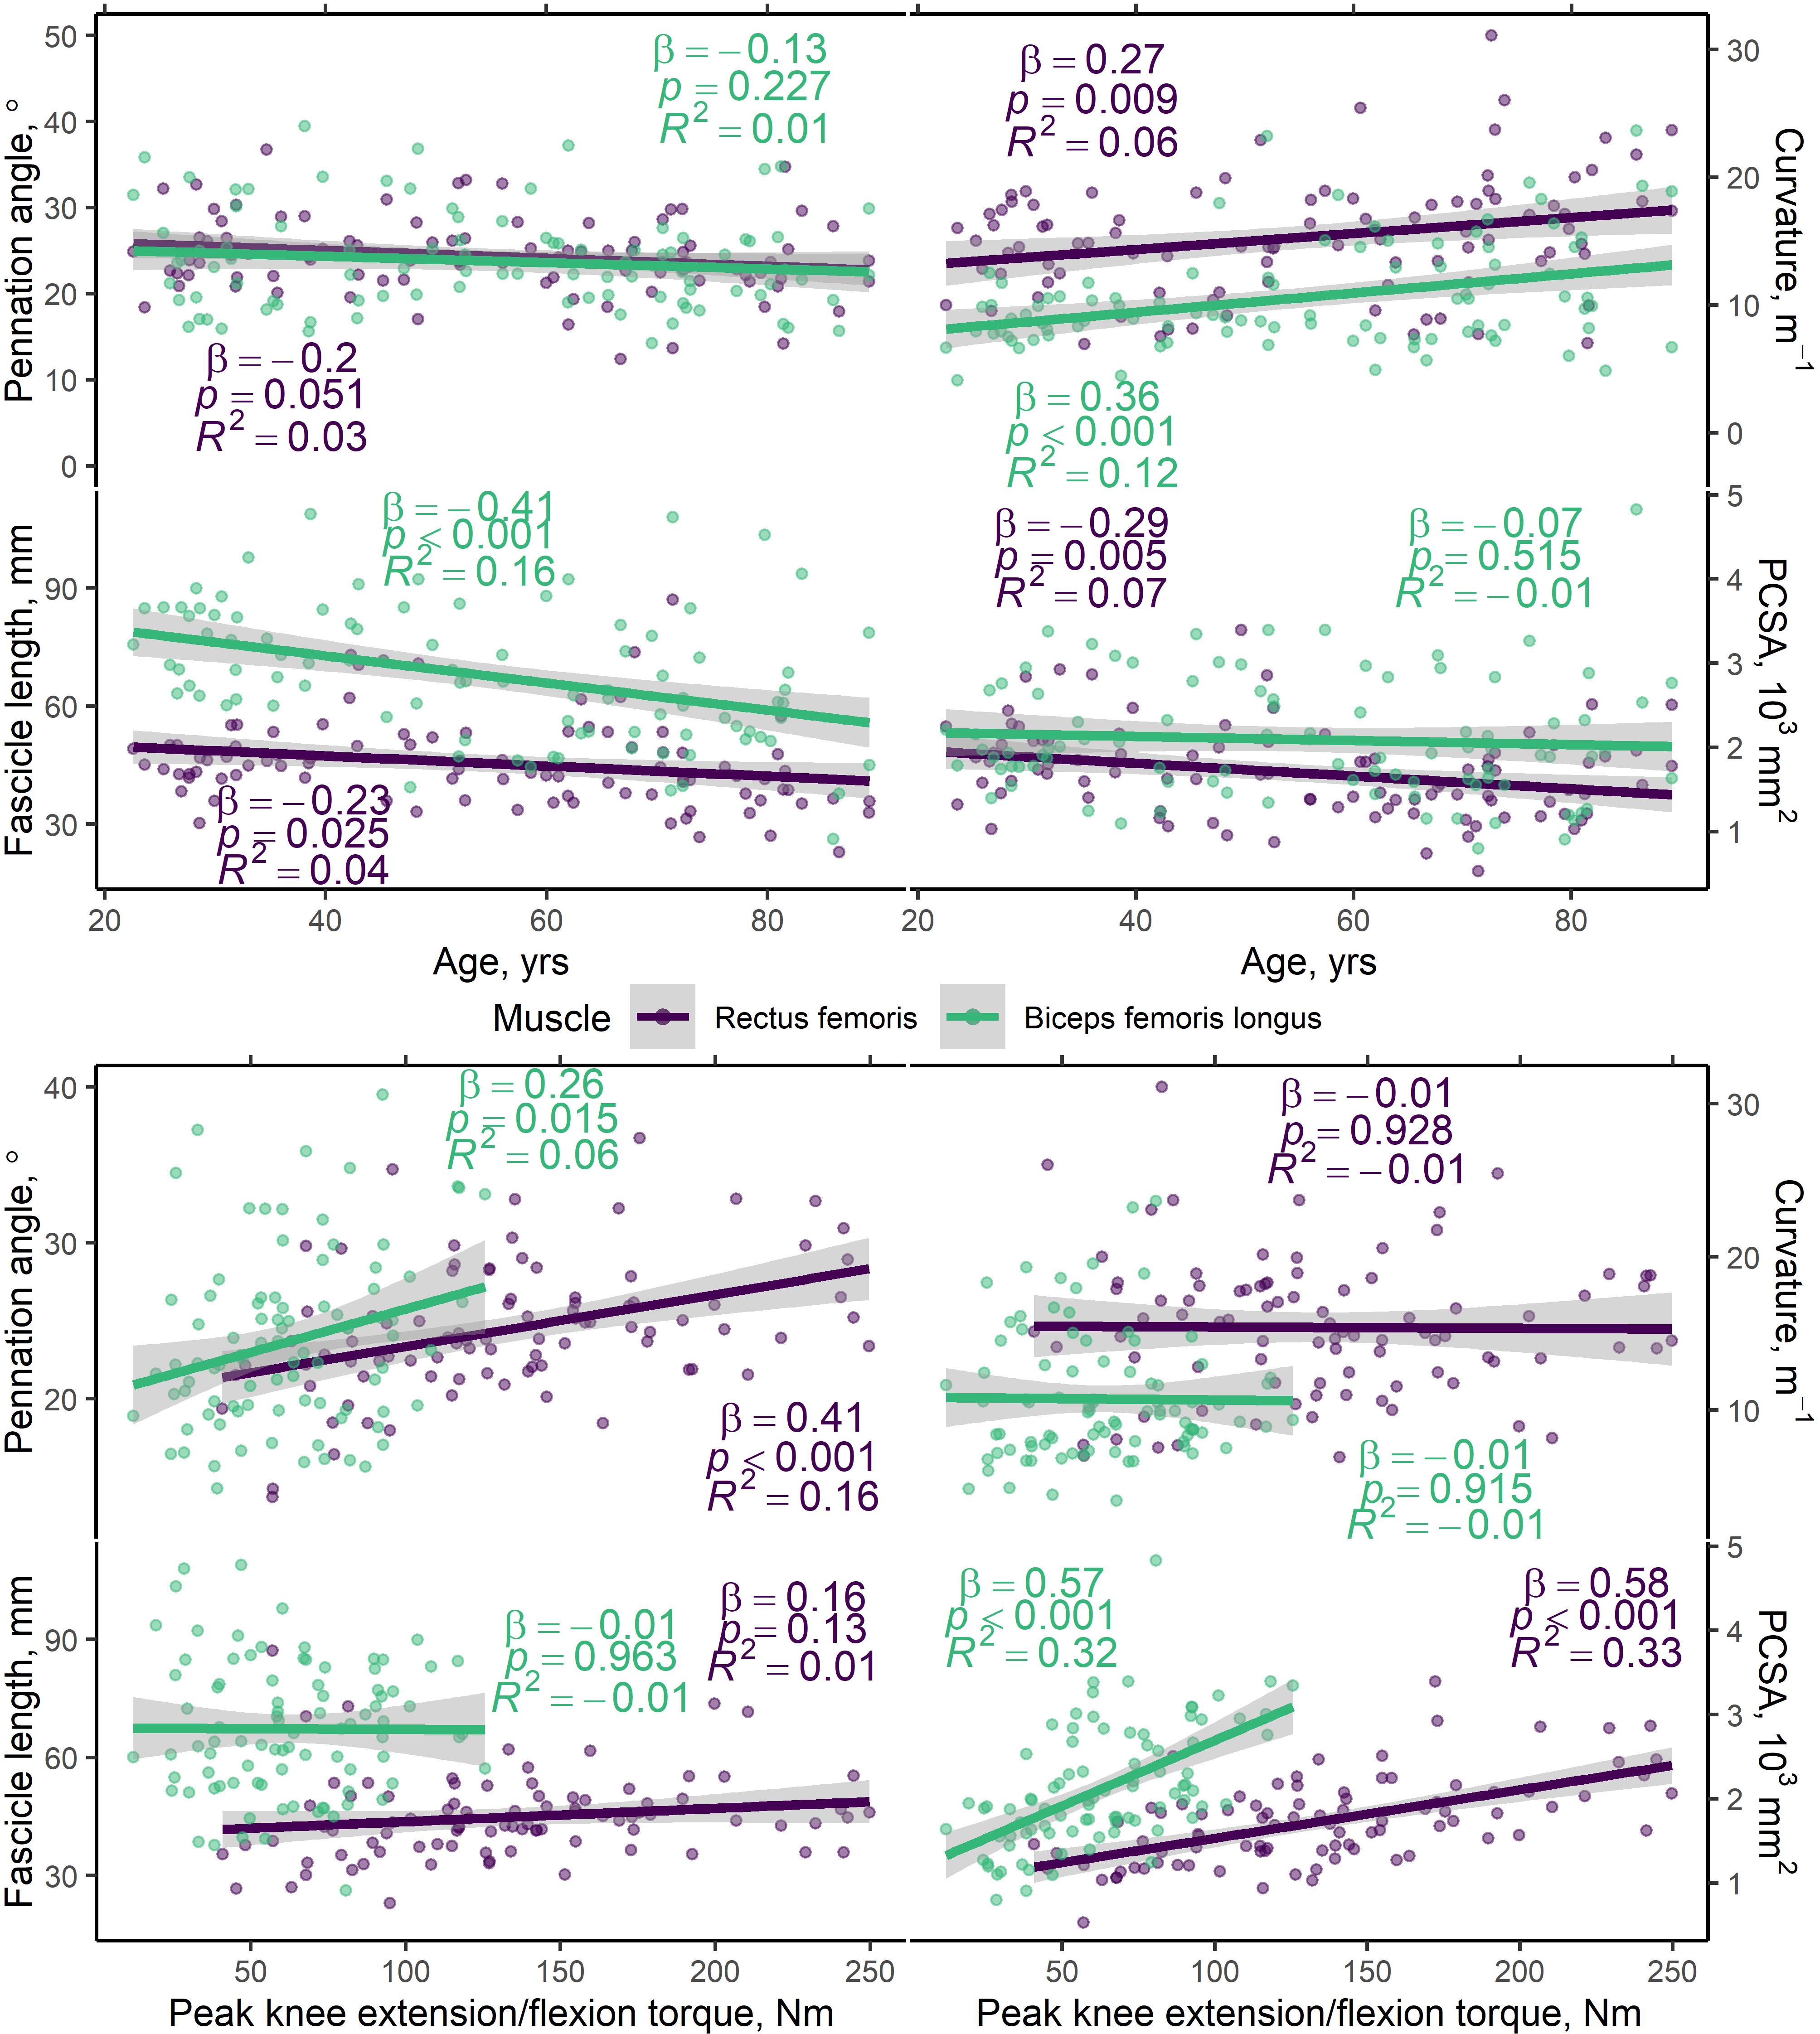
Figure 3 shows representative distributions of DT-MRI muscle architecture measures in individuals, and Figure 4 (top panel) shows scatter plots of these versus age, prior to adjustment, for the whole cohort. In the RF, pennation angle, fibre curvature, fascicle length, and PCSA were all significantly associated with age (β =−0.22, 0.26, −0.23, and −0.31, respectively; p<0.05), after adjusting for sex, while in the BFL only curvature and fascicle length were associated with age (β =0.36, and −0.40, respectively; p<0.001). Figure 4 (bottom panel) shows scatter plots of architecture parameters versus knee extension/flexion strength, prior to adjustment. In the RF, pennation angle and PCSA were associated with strength (β =0.31, and 0.47, respectively; p<0.01), adjusting for sex, whereas only PCSA was associated with strength in the BFL (β =0.43; p<0.001).
DISCUSSION
To our knowledge, ours is the first study to relate DT-MRI skeletal muscle architecture measures to ageing and muscle strength. In our large cohort of healthy participants, we found that FA tends to increase while MD decreases with ageing, in the whole muscle volume of the thigh. In terms of muscle architecture measured in the RF and BFL, we show that pennation angle, fascicle length, and PCSA tend to decrease with increasing age, while curvature increases. Lastly, we found that pennation angle and PCSA are positively associated with muscle strength, suggesting these metrics capture muscle tissue characteristics that are important for muscle quality.In conclusion, we have shown the utility of DT-MRI for exploring muscle architectural changes with ageing in a large cohort. Our approach may be used in the future to better understand progression of age-related changes into sarcopenia, and for monitoring training interventions, where effects on different muscles and muscle regions would be accessible within a single measurement.
Acknowledgements
We are grateful to Palchamy Elango and Marta Zampino for their help with obtaining data, and Fang-Cheng Yeh for his assistance with tractography in DSI Studio.References
1. Esposito A, Campana L, Palmisano A, De Cobelli F, Canu T, Santarella F, Colantoni C, Monno A, Vezzoli M, Pezzetti G, Manfredi AA, Rovere-Querini P, Maschio AD. Magnetic Resonance Imaging at 7T Reveals Common Events in Age-Related Sarcopenia and in the Homeostatic Response to Muscle Sterile Injury. PLoS One (2013) 8(3):e59308. doi: 10.1371/journal.pone.0059308.
2. Yanagisawa O, Shimao D, Maruyama K, Nielsen M, Irie T, Niitsu M. Diffusion-weighted magnetic resonance imaging of human skeletal muscles: gender-, age-and muscle-related differences in apparent diffusion coefficient. Magnetic Resonance Imaging (2009) 27(1):69-78. doi: 10.1016/j.mri.2008.05.011.
3. Kermarrec E, Budzik J-F, Khalil C, Le Thuc V, Hancart-Destee C, Cotten A. In vivo diffusion tensor imaging and tractography of human thigh muscles in healthy subjects. American Journal of Roentgenology (2010) 195(5):W352-W6. doi: 10.2214/AJR.09.3368.
4. Lorbergs AL, Noseworthy MD, MacIntyre NJ. Age-related differences in the response of leg muscle cross-sectional area and water diffusivity measures to a period of supine rest. Magnetic Resonance Materials in Physics, Biology and Medicine (2015) 28(3):279-90. doi: 10.1007/s10334-014-0464-1.
5. Yoon MA, Hong S-J, Ku MC, Kang CH, Ahn K-S, Kim BH. Multiparametric MR Imaging of Age-related Changes in Healthy Thigh Muscles. Radiology (2017) 287(1):235-46. doi: 10.1148/radiol.2017171316.
6. Galbán CJ, Maderwald S, Stock F, Ladd ME. Age-related changes in skeletal muscle as detected by diffusion tensor magnetic resonance imaging. The Journals of Gerontology Series A: Biological Sciences and Medical Sciences (2007) 62(4):453-8. doi: 10.1093/gerona/62.4.453.
7. Sinha U, Csapo R, Malis V, Xue Y, Sinha S. Age‐related differences in diffusion tensor indices and fiber architecture in the medial and lateral gastrocnemius. Journal of Magnetic Resonance Imaging (2015) 41(4):941-53. doi: 10.1002/jmri.24641.
8. Farrow M, Biglands J, Tanner S, Clegg A, Brown L, Hensor E, O’Connor P, Emery P, Tan A. The effect of ageing on skeletal muscle as assessed by quantitative MR imaging: an association with frailty and muscle strength. Aging Clinical and Experimental Research (2021) 33:291-301. doi: 10.1007/s40520-020-01530-2.
9. Manjón JV, Coupé P, Concha L, Buades A, Collins DL, Robles M. Diffusion weighted image denoising using overcomplete local PCA. PLoS One (2013) 8(9):e73021. doi: 10.1371/journal.pone.0073021.
10. Yu J, Agarwal H, Stuber M, Schär M. Practical signal-to-noise ratio quantification for sensitivity encoding: application to coronary MR angiography. Journal of Magnetic Resonance Imaging (2011) 33(6):1330-40. doi: 10.1002/jmri.22571.
11. Froeling M, Nederveen AJ, Nicolay K, Strijkers GJ. DTI of human skeletal muscle: the effects of diffusion encoding parameters, signal-to-noise ratio and T2 on tensor indices and fiber tracts. NMR in Biomedicine (2013) 26(11):1339-52. doi: 10.1002/nbm.2959.
Figures