0666
Whole-body fasciculation detection in Amyotrophic Lateral Sclerosis (ALS) using motor unit MRI (MUMRI)1Newcastle University Translational and Clinical Research Institute, Newcastle University, Newcastle upon Tyne, United Kingdom, 2Newcastle Biomedical Research Centre, Newcastle University, Newcastle upon Tyne, United Kingdom, 3Northern Medical Physics and Clinical Engineering, Freeman Hospital, Freeman Hospital, Newcastle upon Tyne NHS Foundation Trust, Newcastle upon Tune, United Kingdom, 4Department of Neuroradiology, Royal Victoria Infirmary, Newcastle upon Tyne, United Kingdom, 5Directorate of Clinical Neurosciences, Royal Victoria Infirmary, Newcastle upon Tyne, United Kingdom
Synopsis
The spontaneous contraction of motor units in muscle, i.e. fasciculation, has been recognised as an important diagnostic marker in amyotrophic lateral sclerosis (ALS). Fasciculation can be imaged with a novel MRI technique called motor unit MRI. This technique uses a diffusion weighted sequence on which fasciculation presents as short-living signal voids. We demonstrated an increased fasciculation rate in ALS patients compared to healthy controls by assessing the four body regions relevant in the diagnosis of ALS. The affected body regions differed between patients. This is in line with the heterogeneous disease onset and supports our proposed whole-body approach.
Introduction
Amyotrophic lateral sclerosis (ALS) is a degenerative neurological disorder characterised by rapid progressive loss of muscle strength.1,2 About 50% of the patients die within 30 months of disease onset1, making early identification critical. However, currently it takes approximately 12 months to confirm a definite diagnosis.1–3ALS is caused by degeneration of upper and lower motor neurones. Lower motor neurones innervate a group of skeletal muscle fibres, together known as a motor unit. It is motor neurone loss that leads to muscle wasting and weakness. One of the earliest hallmarks of motor neurone degeneration is fasciculation, i.e. pathological spontaneous contraction of motor units. Fasciculation has therefore been recognised as an important diagnostic marker and must be studied in all four anatomical regions (lower limb, upper limb, thoracic and bulbar region).4 In routine care, fasciculation is detected with needle EMG, but this technique is invasive and has limited coverage.
Recently, motor unit MRI (MUMRI) has been developed as a novel non-invasive way to detect fasciculation.5,6 MUMRI employs a pulsed gradient spin-echo (PGSE) diffusion weighted (DW) sequence on which spontaneous motor unit contractions manifest as transient signal voids. Here, we aimed to detect the fasciculation rate using MUMRI in ALS patients compared to healthy controls in the four body regions relevant for the diagnosis ALS.
Material and Methods
Subjects: We included 10 ALS patients (7 male, mean age: 64±7 years) and 10 healthy controls (7 male, mean age: 58±10 years).Data-acquisition: The lower legs, lower back, upper arm and tongue of all subjects were scanned using a 3T Philips MR scanner. We used a DW-PGSE sequence and acquired for each body region 60 repetitions of four slices (240 images, acquisition time ~1 minute), see table 1 for sequence parameters. For the lower legs, upper arm and lower back, b=200 s/mm2 was used, while for the tongue b=20 s/mm2 was chosen to reduce sensitivity and minimise detection of volitional muscle activation.7 The whole examination took ~35 minutes.
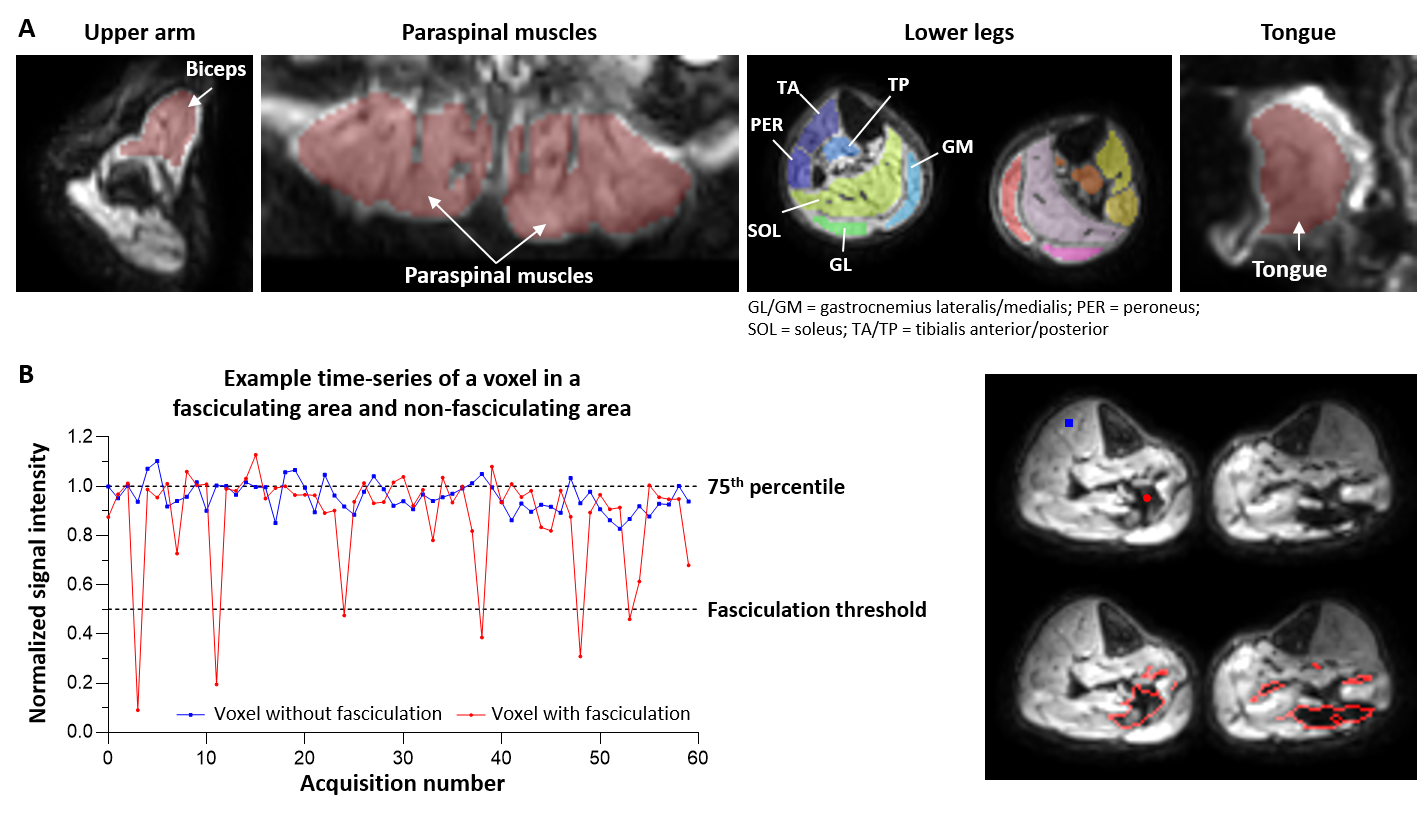
Data-processing: All DW images were registered to the b=0 s/mm2 image using rigid registration. The muscle tissue was manually delineated and included all lower legs muscles, paraspinal muscles for the lower back, biceps for the upper arm and all tongue tissue for the tongue images (Fig.1A). Within the segmented muscle tissue, transient signal voids were detected with a custom-written Matlab algorithm. A signal void was defined as a group of connected voxels where the signal intensity dropped>50% compared to its baseline signal. The baseline signal was defined as the 75% percentile signal intensity over the whole time-series in a voxel (Fig. 1B). The minimum signal void size was set at 10 mm2, because this was the minimum motor unit size found in previous work.8
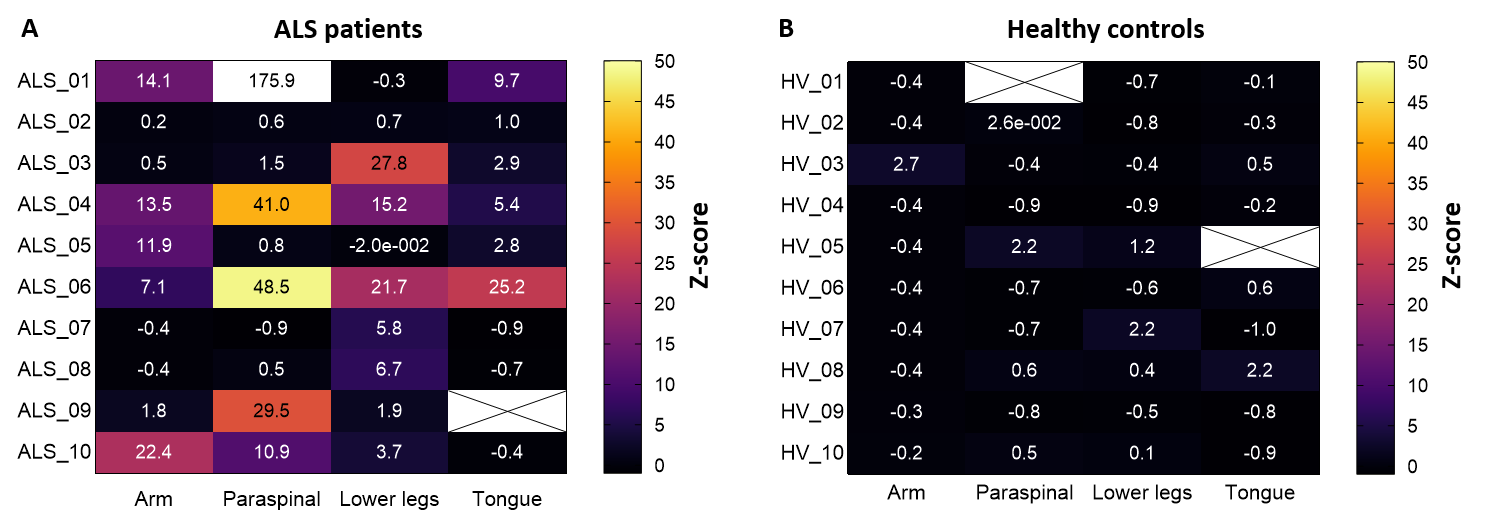
The fasciculation rate was calculated as the number of detected signal voids normalised to the area of sampled muscle tissue and acquisition time. Subsequently, the fasciculation rate was expressed for each participant into a z-score, using the healthy control values as reference:
$$z-score = \frac{Fasciculation\:rate\:participant - mean(fasciculation rate\:healthy\:controls}{standard\:deviation(fasciculation\:rate\: healthy\:controls)}$$
We define abnormally elevated fasciculation rate in ALS patients when the z-score>3 (equals p=0.011 after Bonferroni correction for four regions).
Results
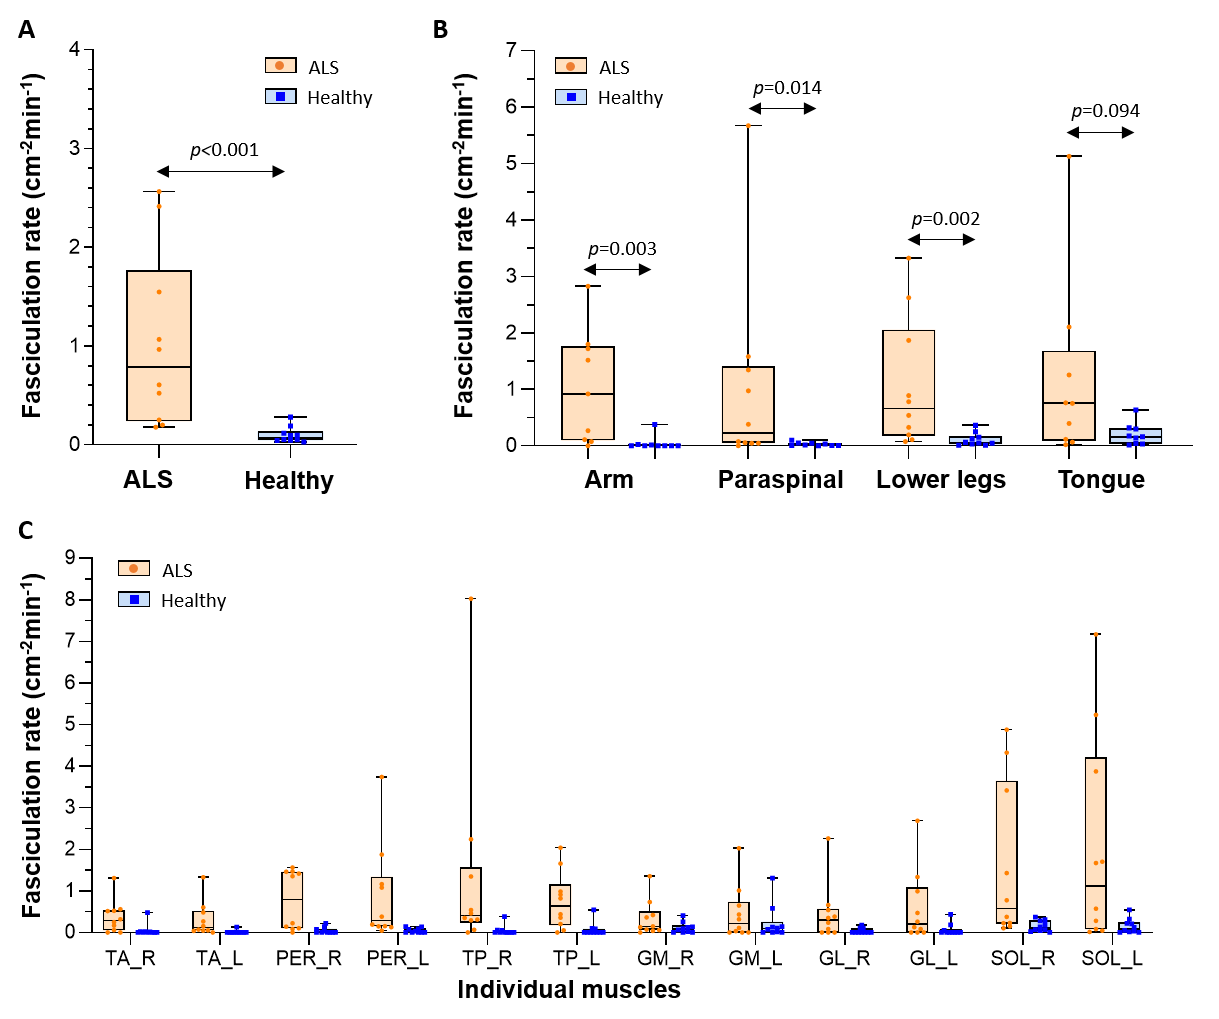
Figure 2 shows videos of the DW images per body region for one healthy control and two ALS patients (Fig.2A) and their corresponding activity maps (Fig.2B). The images of the healthy control show no or only a few short-living signal voids. In contrast, both ALS patients present with a high number of short-living signal voids in one or more body regions, indicating fasciculation.The average fasciculation rate over all body regions was higher in ALS patients compared to healthy controls (median [IQR]: 0.79 [0.24-1.77] vs. 0.08 [0.04-13]; p<0.001)(Fig.3A). At the body region level, the fasciculation rate was also higher in ALS patients compared to healthy controls for the arm (p=0.003), paraspinal muscles (p=0.014) and lower legs (p=0.002), but not in the tongue (p=0.094)(Fig.3B). A detailed assessment of the individual lower leg muscles shows the highest fasciculation rates in the soleus (Fig.3C).
The body regions that fasciculated differed between the ALS patients (Fig.4). Nine out of ten ALS patients had an increased fasciculation rate (z-score>3) in at least one body region, and four ALS patients had an increased fasciculation rate at least two body regions.
Conclusion and Discussion
We developed a clinically applicable ‘whole-body’ MUMRI protocol to detect fasciculation in muscular regions that are important in the diagnosis of ALS. The detected fasciculation rates are in line with literature. The participating patients tolerated the MRI examination well and the examination duration was relatively quick despite the use of the different coils and the required repositioning of the patient for the upper arm examination.All ALS patients, except one, deviated from the healthy controls by showing an increased fasciculation rate in at least one body region, with often at least one of the other body regions unaffected. The patient without any fasciculation on MUMRI showed clinically mainly signs of upper motor neurone degeneration and was therefore expected to show no or limited fasciculation. These findings are in line with the heterogeneous disease onset known in ALS and support the essence of our whole-body approach to the investigation and diagnosis of ALS.
Acknowledgements
Funding: This work was supported by the Rubicon research programme (project number: 452183002) of the Dutch Research Council (NWO).
Acknowledgements: We like to thank all participants for their participation and the radiographers for their help with the data-acquisition.
References
1Kiernan MC, Vucic S, Cheah BC, et al. Amyotrophic lateral sclerosis. Lancet. 2011;377(9769):942-955. doi:10.1016/S0140-6736(10)61156-7
2Salameh JS, Brown RH, Berry JD. Amyotrophic Lateral Sclerosis: Review. Semin Neurol. 2015;35:469–476.
3Paganoni S, Macklin EA, Lee A, et al. Diagnostic timelines and delays in diagnosing amyotrophic lateral sclerosis (ALS). Amyotroph Lateral Scler Front Degener. 2014;15(5-6):453-456. doi:10.3109/21678421.2014.903974
4Shefner JM, Al-Chalabi A, Baker MR, et al. A proposal for new diagnostic criteria for ALS. Clin Neurophysiol. 2020;131(8):1975-1978. doi:10.1016/j.clinph.2020.04.005
5Whittaker RG, Porcari P, Braz L, Williams TL, Schofield IS, Blamire AM. Functional magnetic resonance imaging of human motor unit fasciculation in amyotrophic lateral sclerosis. Ann Neurol. 2019;85(3):455-459. doi:10.1002/ana.25422
6Steidle G, Schick F. Addressing spontaneous signal voids in repetitive single-shot DWI of musculature: Spatial and temporal patterns in the calves of healthy volunteers and consideration of unintended muscle activities as underlying mechanism. NMR Biomed. 2015;28(7):801-810. doi:10.1002/nbm.3311
7Schwartz M, Martirosian P, Steidle G, et al. Measuring Spontaneous Muscular Activities in Neuromuscular Disease: Preliminary Results. Proc Annu ISMRM Conf. 2020.
8Birkbeck MG, Heskamp L, Schofield IS, Blamire AM, Whittaker RG. Non-invasive imaging of single human motor units. Clin Neurophysiol. 2020;131(6):1399-1406. doi:10.1016/j.clinph.2020.02.004
Figures
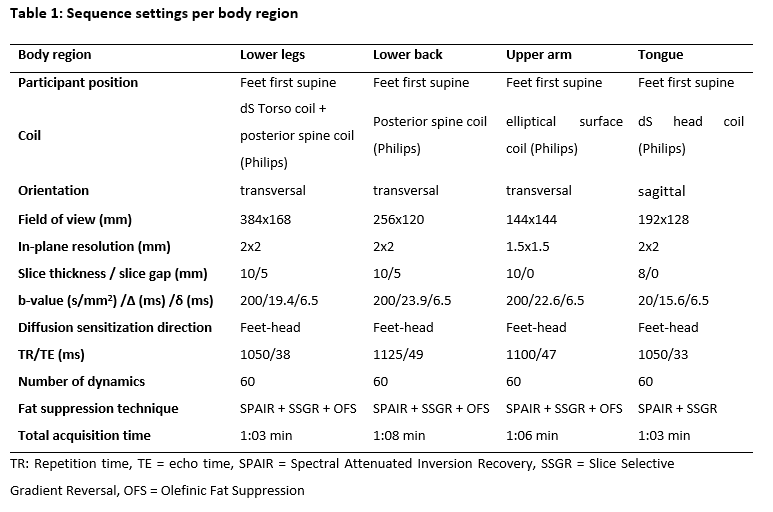
Table 1: Sequence settings per body region.
TR: Repetition time, TE = echo time, SPAIR = Spectral Attenuated Inversion Recovery, SSGR = Slice Selective Gradient Reversal, OFS = Olefinic Fat Suppression