0665
Imaging lung water redistribution using 0.55T ultrashort echo time MRI1Cardiovascular Branch, National Heart, Lung, and Blood Institute, National Institutes of Health, Bethesda, MD, United States
Synopsis
Quantification of changes in lung water using MRI may provide clinical value in early diagnosis of heart failure. In this study, we demonstrate the ability of our 3D free-breathing spiral ultrashort-TE sequence to quantify and capture changes in lung water using a high-performance 0.55T MRI system. A phantom containing mixtures of water and deuterium oxide at varying concentrations was used to validate water density quantification. Our proposed approach captured the gravity-induced redistribution of lung water, achieved by imaging subjects in the supine and prone positions.
Introduction
Quantification of dynamic changes in lung water density (LWD) could potentially enable an early diagnosis of heart failure, a task that can be challenging using current conventional clinical assessments.Magnetic resonance imaging (MRI) has recently been proposed as an ionizing radiation-free and quantitative method to measure LWD, using half-Fourier single-shot turbo spin-echo (HASTE) or ultrashort echo time (UTE) sequences at 1.5T and 3T (1–3). However, assessment of lung water dynamics has not been evaluated for these methods. High-performance low field strength 0.55T MRI offers reduced image artifacts in tissues in proximity to air, such as lung parenchyma, and due to reduced susceptibility gradients (4–7). In this study, we present a free-breathing UTE acquisition and an automated image processing pipeline to capture changes in lung water density using a high-performance 0.55T MRI system in patients and healthy volunteers.
Methods
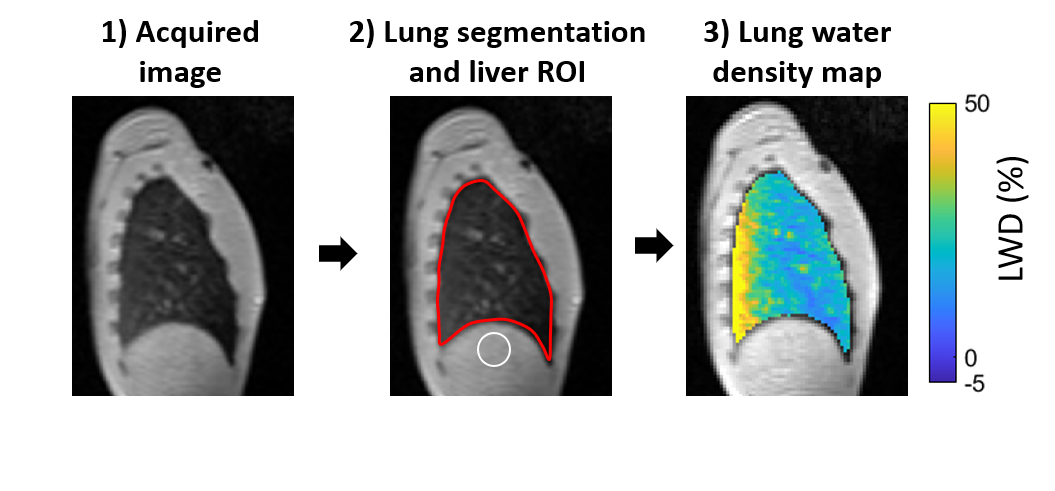
In this IRB-approved study, lung MRI was performed on 14 healthy volunteers (age 29±7 years, 6 women) and two patients with pulmonary hypertension (44±14 years, 2 women) using a high-performance 0.55T system (prototype MAGNETOM Aera, Siemens Healthcare, Erlangen, Germany) (4). A 3D free-breathing stack-of-spirals proton density weighted UTE gradient echo sequence (TE/TR/θ = 0.56ms/9ms/1°, 171 spiral interleaves, 5.0ms spiral readout, 3.5mm isotropic resolution, 450x450x252mm FOV, 2.5 minute acquisition time) was used to measure LWD (8). Images were reconstructed at a stable respiratory phase using a self-navigator signal (8), and corrections for surface coil shading due to non-uniform receiver coils was applied. In healthy volunteers, a gravity-induced dynamic redistribution of lung water was achieved by sequentially acquiring UTE images in the supine, prone, and again supine position. Four images were acquired in each position. In patients, two images were acquired in the supine position only.An automated image processing pipeline was implemented (Figure 1). First, lung segmentation avoiding major vasculature and airways was performed using a trained convolutional neural network with a U-net architecture developed in Pytorch. A region of interest in the liver was automatically placed under the right lung. Occasional manual corrections were applied when necessary. Pixel-wise LWD maps were calculated as the ratio of lung tissue signal intensities compared to average liver signal intensity, with the assumption that the liver has 70% water density (1).
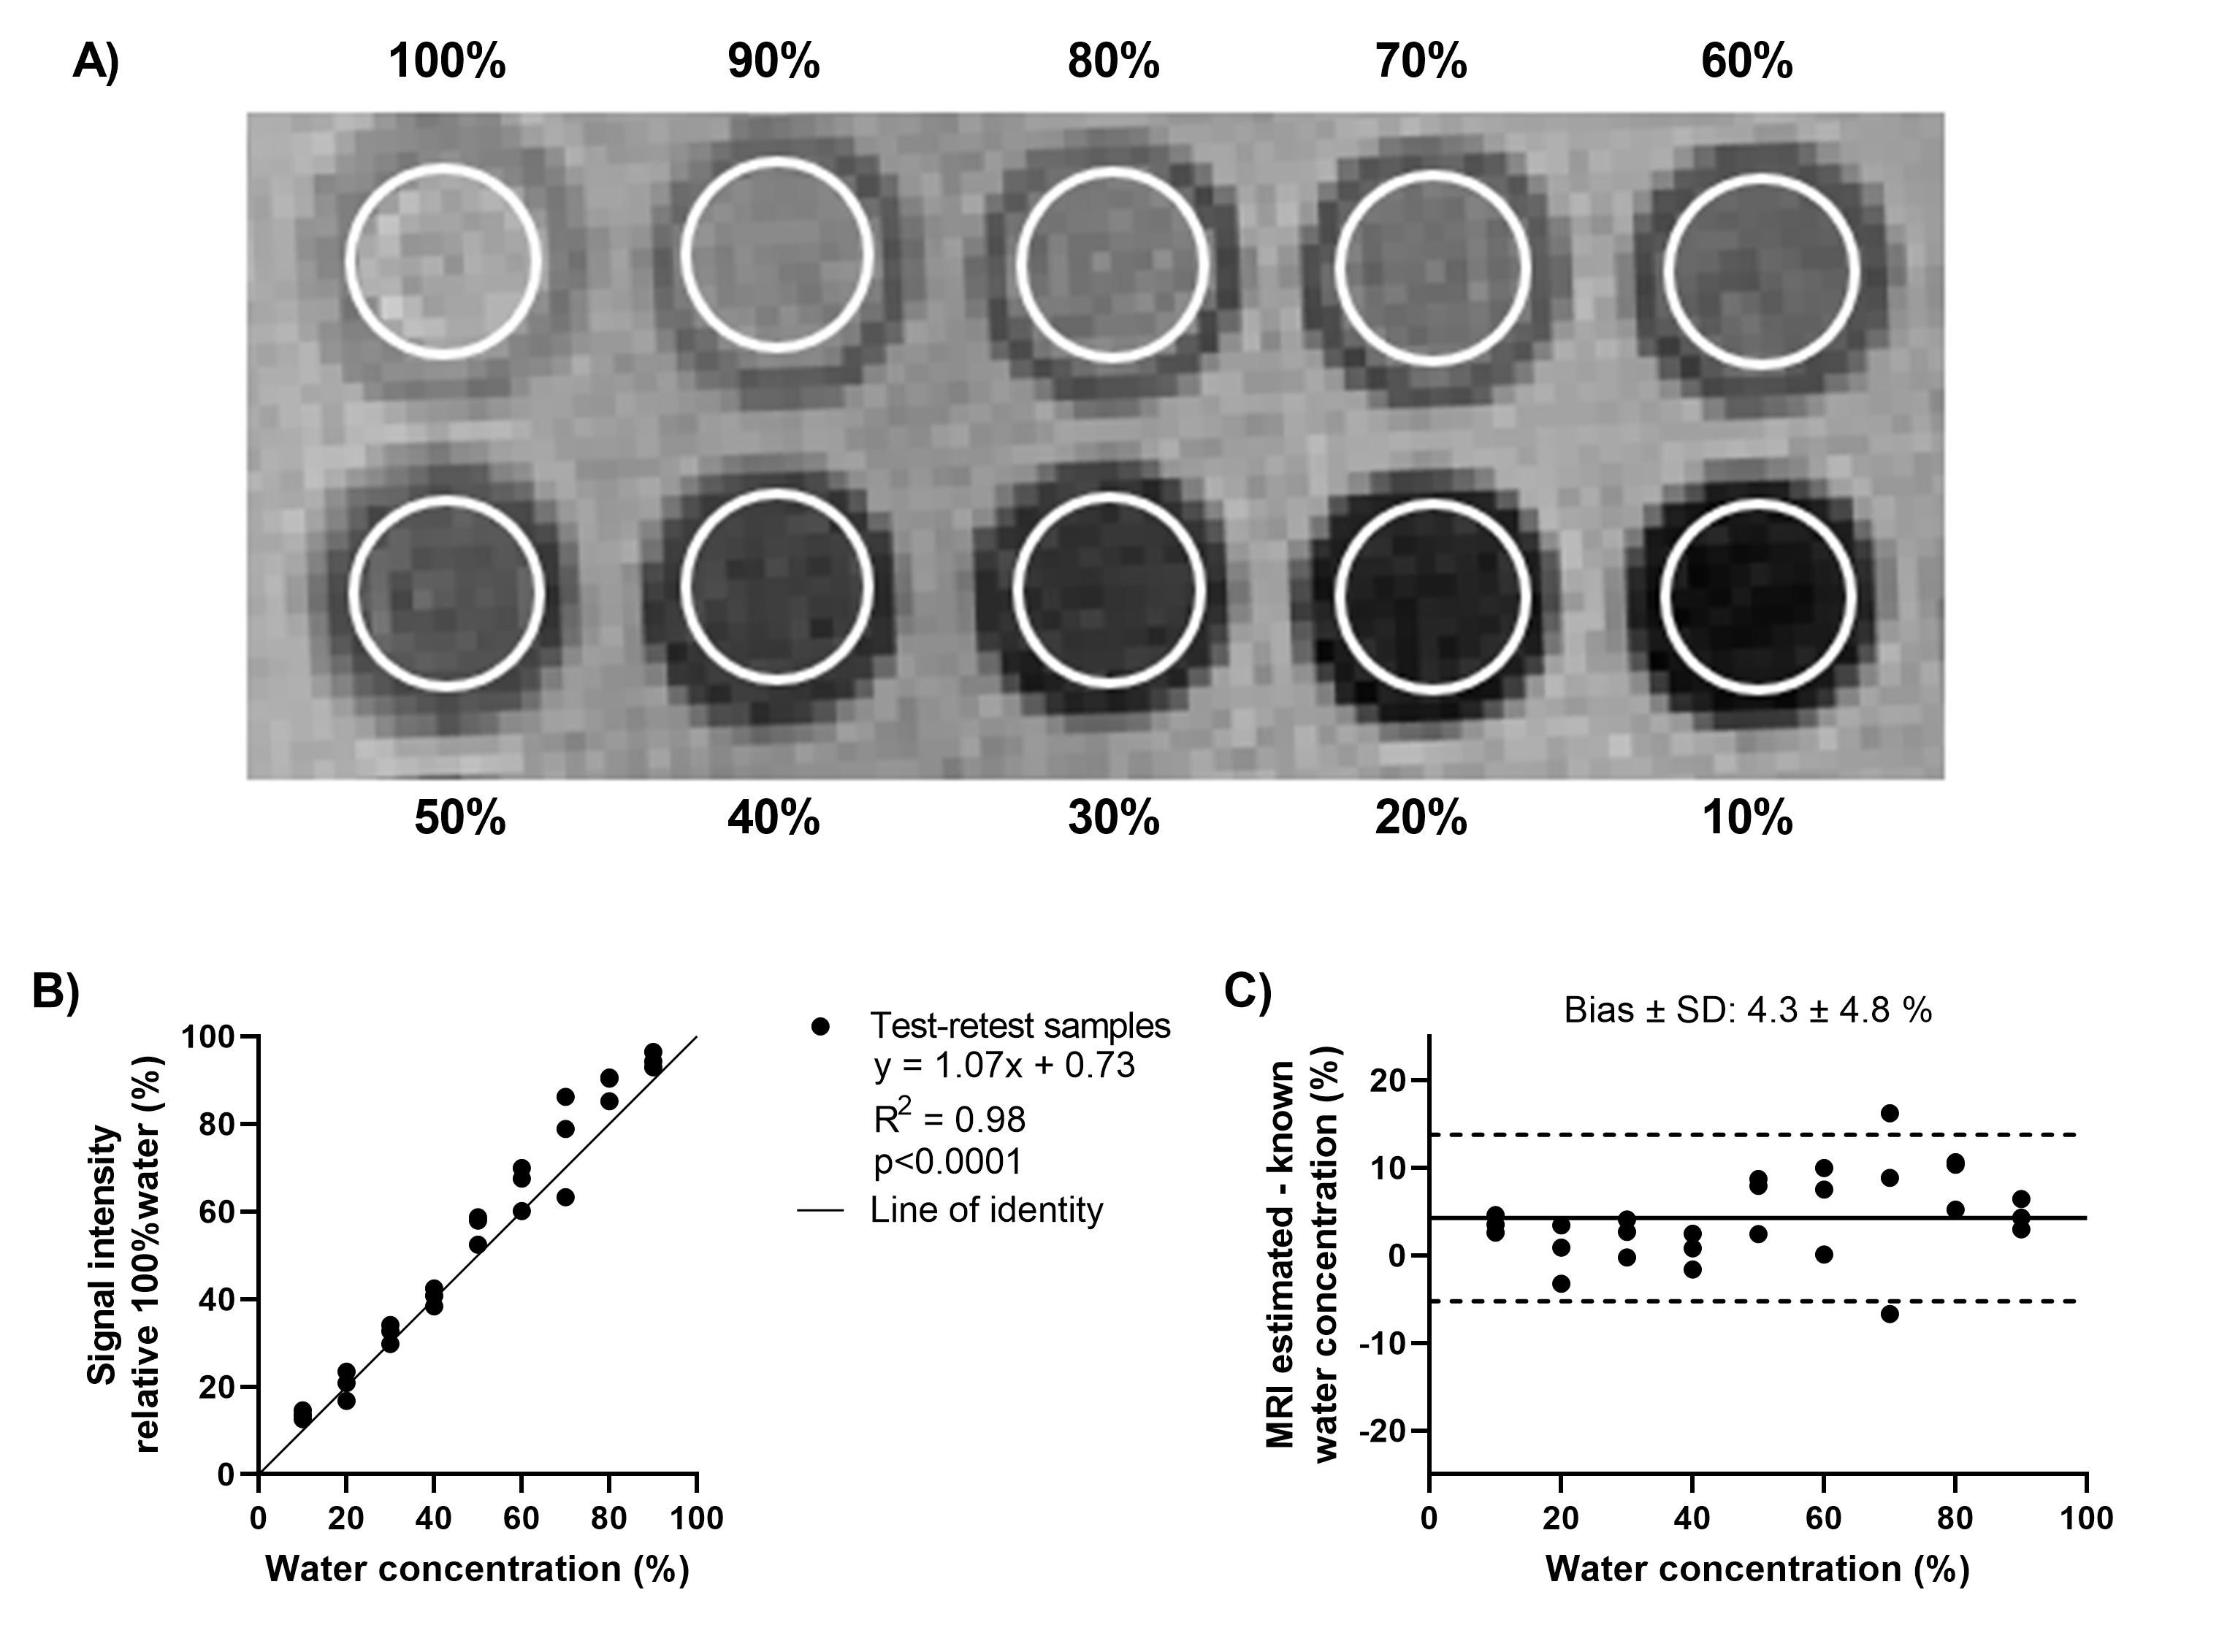
A test-retest validation of the quantitative capabilities of the UTE sequence was performed in an array of vials containing mixtures of water and deuterium oxide. Water densities ranged between 0-100% in increments of 10%, and were calculated as the ratio of the average signal intensities in each vial to the 100% water vial.
Results
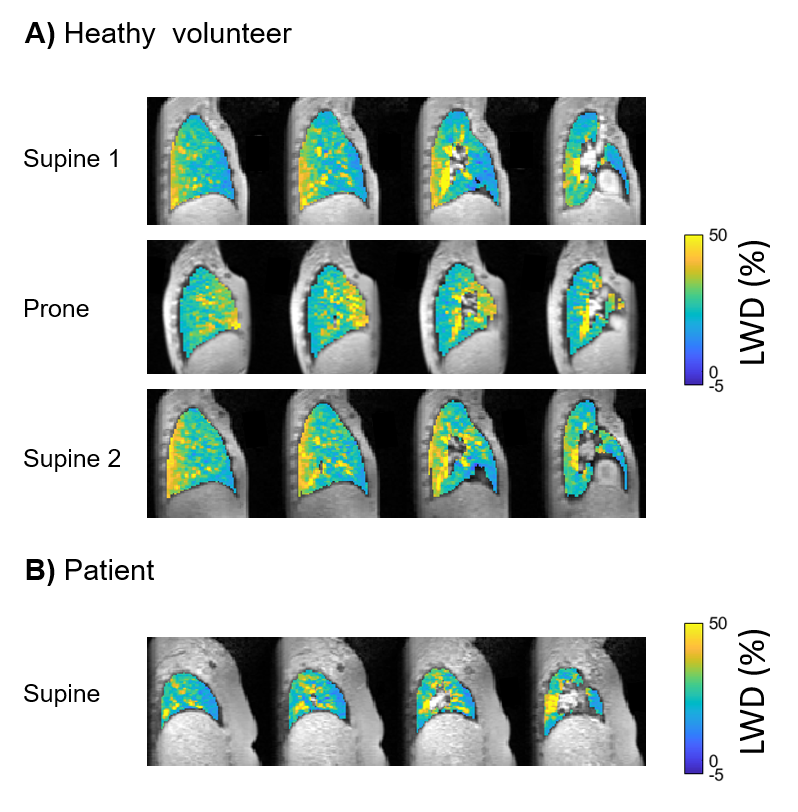
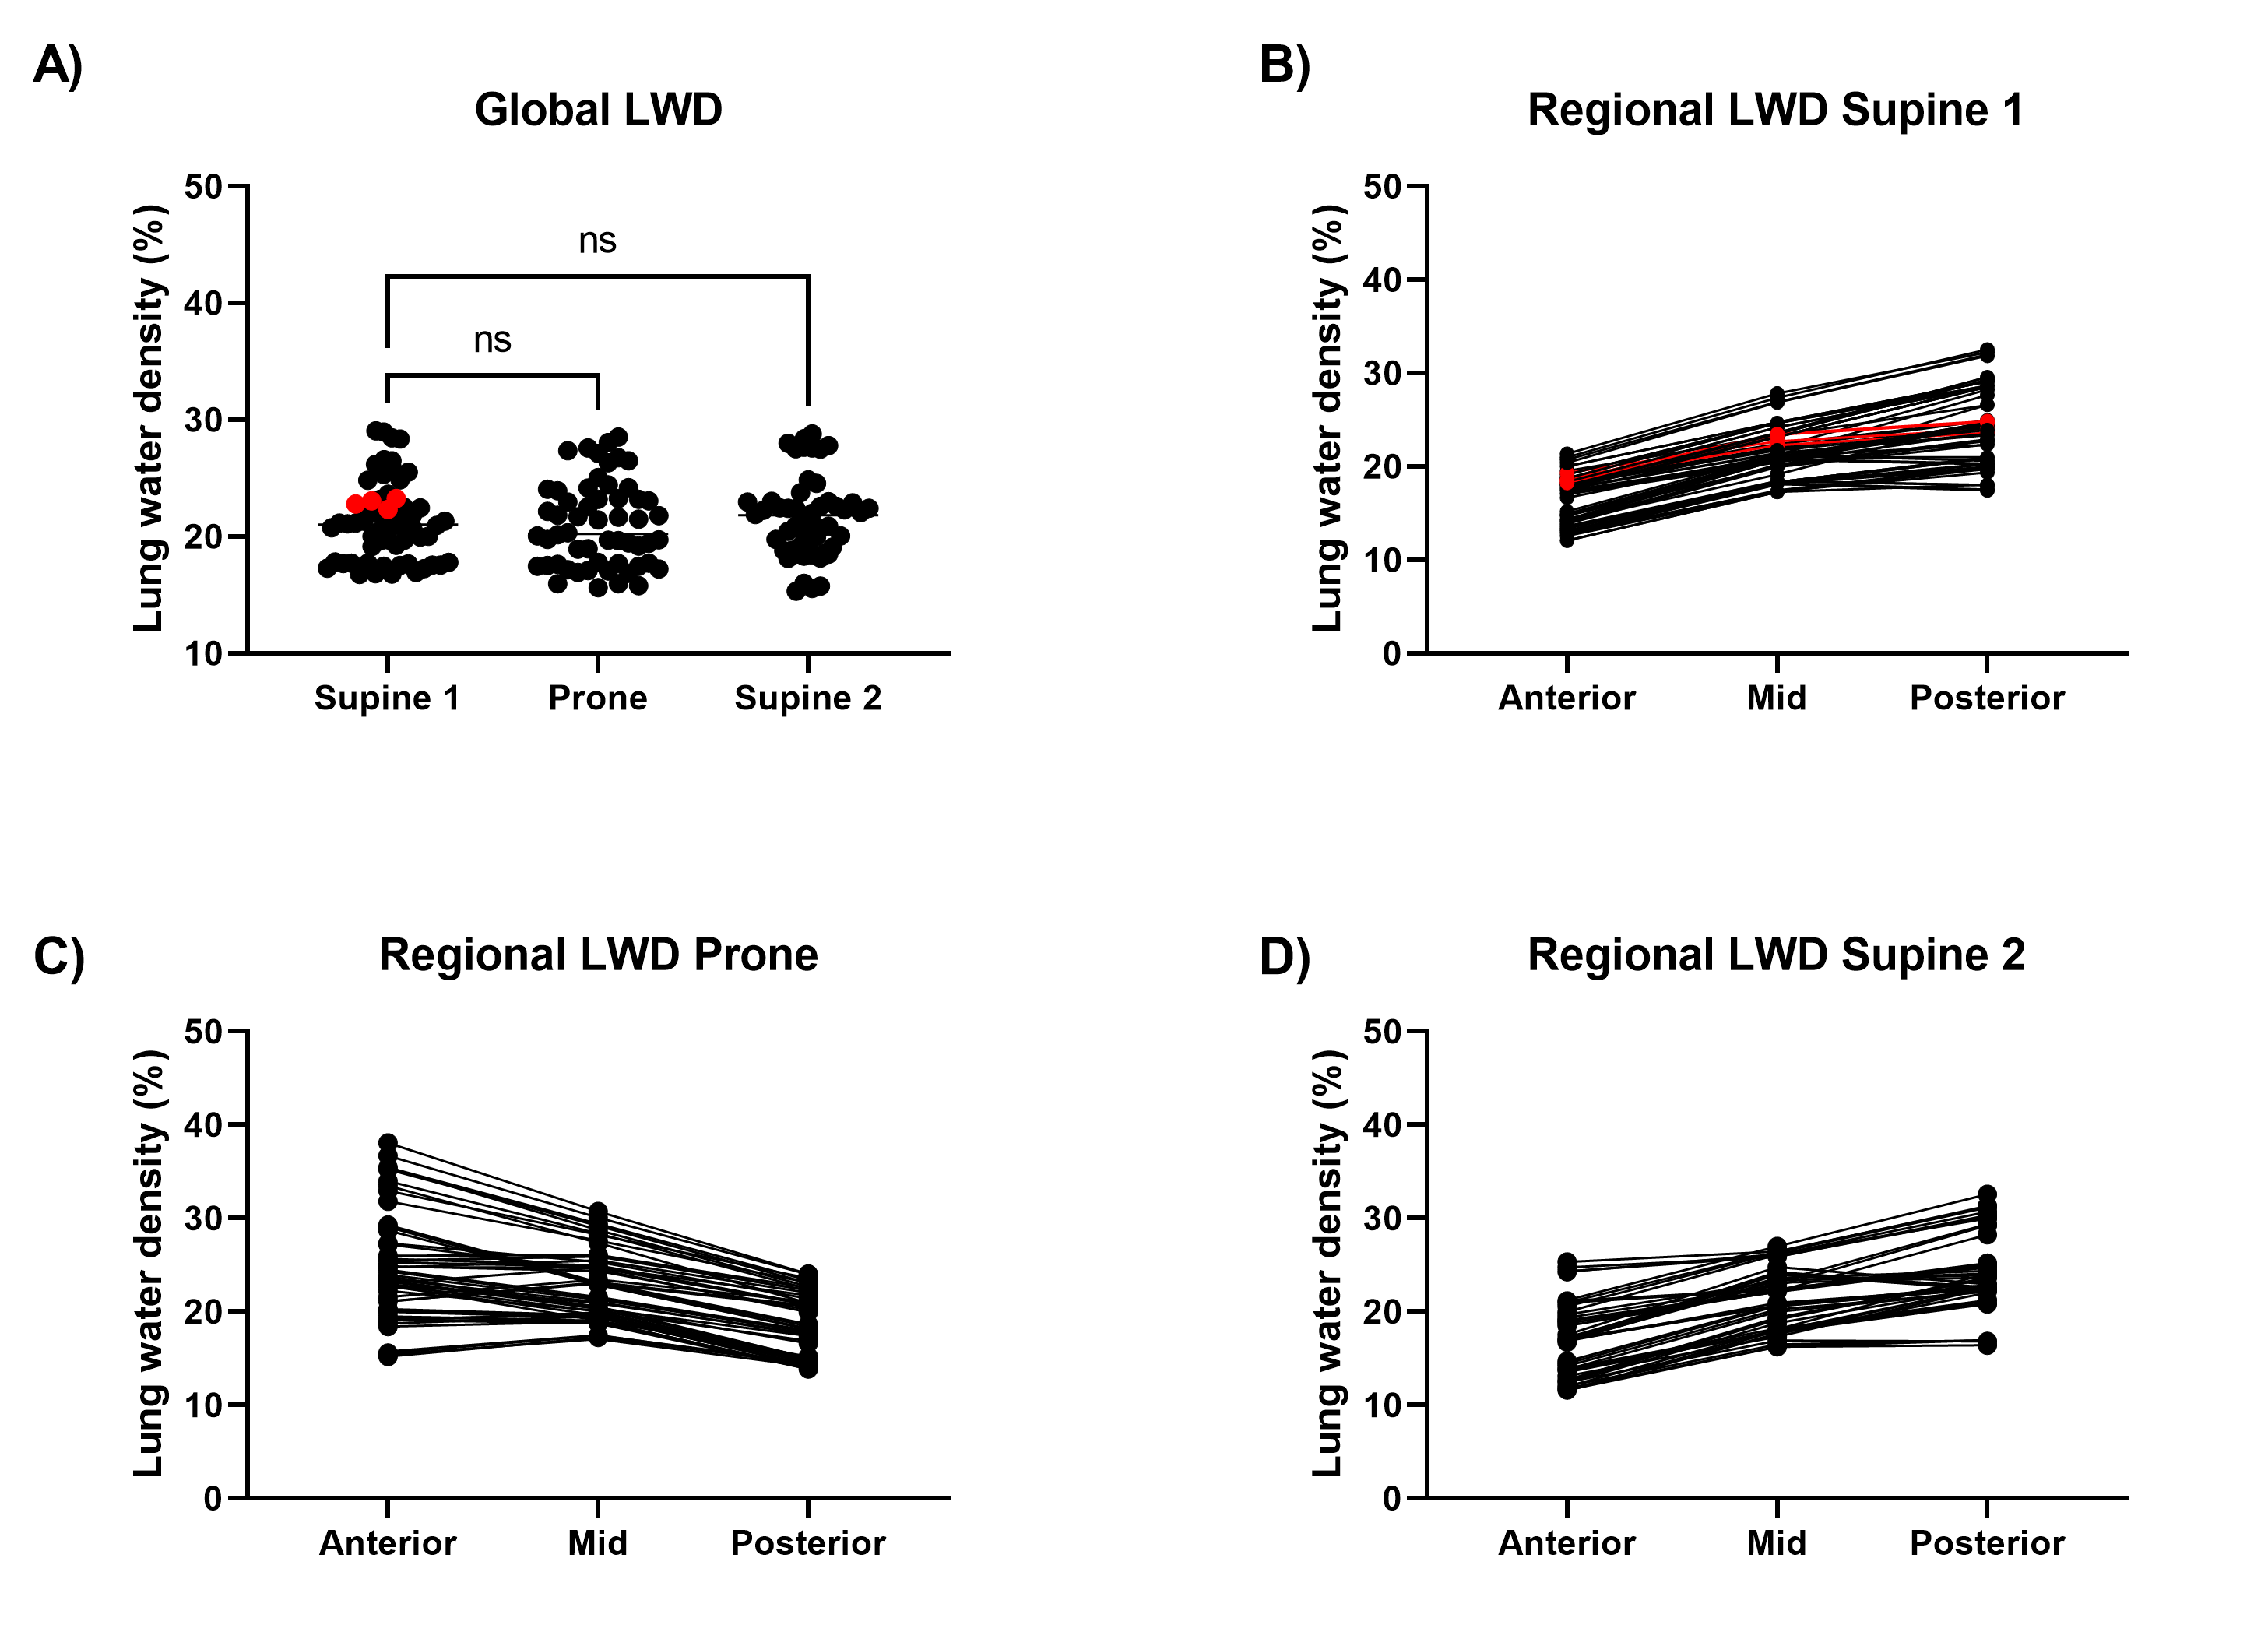
The test-retest phantom experiment validated the capability of the UTE sequence in quantifying water density and the reproducibility of the measurement, with a bias of 4.3±4.8% (Figure 2). A redistribution of LWD was observed in all healthy volunteers when repositioning, with a predominant lung water accumulation in the posterior lung when supine and in the anterior lung when prone (Figure 3). Lung water redistribution had occurred before the first image in each new position (mean time between positions = 6 min), and no evolution in LWD was observed during four repeated measurements.The average global LWD was 21±3.5% in healthy volunteers, which remained unchanged between imaging positions (supine 21±3.3%, prone 21±3.5%, second supine 21±3.4%) (Figure 4). There was no difference in LWD in healthy volunteers compared to patients with pulmonary hypertension (21±3.5% vs 23±0.4%). The difference in global LWD between the first and following three acquired images in each position was -0.54 ± 1.5%, demonstrating that the proposed LWD metric is repeatable.
Discussion
This study presents a free-breathing stack-of-spirals 3D UTE MRI sequence at 0.55T with an automated image processing pipeline to quantify LWD in ~2.5 minutes. The method was capable of depicting a redistribution of LWD, and quantification of global LWD was reproducible in both in-vitro and in-vivo studies. The studied cohort was predominantly young and healthy, and future studies and further method development are warranted to determine if MRI quantification of dynamic changes in LWD during exercise can unmask latent heart failure.Conclusion
Redistribution of LWD due to gravitational forces can be depicted and quantified using a validated free-breathing 3D proton density weighted UTE sequence on a high-performance 0.55T MRI system.Acknowledgements
We would like to acknowledge the assistance of Siemens Healthcare in the modification of the MRI system for operation at 0.55T, and in the stack-of-spirals UTE sequence, under an existing cooperative research agreement (CRADA) between NHLBI and Siemens Healthcare.
This study was supported by the Intramural Research Program, National Heart Lung and Blood Institute, National Institutes of Health, USA (Z01-HL006257, Z01-HL006213, and Z01-HL006039).
References
1. Thompson RB., Chow K., Pagano JJ., et al. Quantification of lung water in heart failure using cardiovascular magnetic resonance imaging. J Cardiovasc Magn Reson 2019;21(1):58. Doi: 10.1186/s12968-019-0567-y.
2. Meadus WQ., Stobbe RW., Grenier JG., Beaulieu C., Thompson RB. Quantification of lung water density with UTE Yarnball MRI. Magn Reson Med 2021. Doi: 10.1002/mrm.28800.
3. Burrage MK., Hundertmark M., Valkovič L., et al. Energetic Basis for Exercise-Induced PulmonaryCongestion in Heart Failure With PreservedEjection Fraction. Circulation 2021. Doi: 10.1161/CIRCULATIONAHA.121.054858.
4. Campbell-Washburn AE., Ramasawmy R., Restivo MC., et al. Opportunities in Interventional and Diagnostic Imaging by Using High-Performance Low-Field-Strength MRI. Radiology 2019;293(2):384–93. Doi: 10.1148/radiol.2019190452.
5. Campbell-Washburn AE., Malayeri AA., Jones EC., et al. T2-weighted Lung Imaging Using a 0.55-T MRI System. Radiol Cardiothorac Imaging 2021;3(3):e200611. Doi: 10.1148/ryct.2021200611.
6. Simonetti OP., Ahmad R. Low-Field Cardiac Magnetic Resonance Imaging. Circ Cardiovasc Imaging 2017;10(6). Doi: 10.1161/CIRCIMAGING.117.005446.
7. Atalay MK., Poncelet BP., Kantor HL., Brady TJ., Weisskoff RM. Cardiac susceptibility artifacts arising from the heart-lung interface. Magn Reson Med 2001;45(2):341–5. Doi: 10.1002/1522-2594(200102)45:2
8. Javed A., Ramasawmy R., O’Brien K., et al. Self-gated 3D Stack-of-Spirals Ultra-Short Echo-Time Pulmonary imaging at 0.55T. Magn Reson Med 2021.
Figures