0663
Longitudinal comparison of quantitative UTE lung MRI and CT biomarkers in interstitial lung disease
Ho-Fung Chan1, Timothy J Baldwin1, Harry Barker1, Neil J Stewart1, James A Eaden1,2, Paul J.C Hughes1, Nicholas D Weatherley1, Joshua Astley1,3, Bilal A Tahir1,3, Kevin M Johnson4, Ronald A Karwoski5, Brian J Bartholmai6, Marta Tibiletti7, Colm T Leonard8,9, Sarah Skeoch8,10, Nazia Chaudhuri8,9, Ian N Bruce8,9, Geoff J.M Parker7,11, Stephen M Bianchi2, and Jim M Wild1
1Infection, Immunity and Cardiovascular Disease, University of Sheffield, Sheffield, United Kingdom, 2Academic Directorate of Respiratory Medicine, Sheffield Teaching Hospitals NHS Foundation Trust, Sheffield, United Kingdom, 3Oncology and Metabolism, University of Sheffield, Sheffield, United Kingdom, 4Radiology and Medical Physics, University of Wisconsin, Madison, WI, United States, 5Biomedical Imaging Resource, Mayo Clinic, Rochester, MN, United States, 6Radiology, Mayo Clinic, Rochester, MN, United States, 7Bioxydyn Limited, Manchester, United Kingdom, 8University of Manchester, Manchester, United Kingdom, 9Manchester University NHS Foundation Trust, Manchester, United Kingdom, 10Royal United Hospitals Bath NHS Foundation Trust, Bath, United Kingdom, 11Centre for Medical Image Computing, University College London, London, United Kingdom
1Infection, Immunity and Cardiovascular Disease, University of Sheffield, Sheffield, United Kingdom, 2Academic Directorate of Respiratory Medicine, Sheffield Teaching Hospitals NHS Foundation Trust, Sheffield, United Kingdom, 3Oncology and Metabolism, University of Sheffield, Sheffield, United Kingdom, 4Radiology and Medical Physics, University of Wisconsin, Madison, WI, United States, 5Biomedical Imaging Resource, Mayo Clinic, Rochester, MN, United States, 6Radiology, Mayo Clinic, Rochester, MN, United States, 7Bioxydyn Limited, Manchester, United Kingdom, 8University of Manchester, Manchester, United Kingdom, 9Manchester University NHS Foundation Trust, Manchester, United Kingdom, 10Royal United Hospitals Bath NHS Foundation Trust, Bath, United Kingdom, 11Centre for Medical Image Computing, University College London, London, United Kingdom
Synopsis
UTE lung MRI approaches the diagnostic quality of CT, opening up the possibility for longitudinal follow-up of interstitial lung disease (ILD) progression. Two quantitative biomarkers of UTE lung signal were developed for monitoring longitudinal change in ILD and benchmarked against quantitative CT CALIPER measurements. Normalized UTE lung signal and UTE high percentage (based on 95% cutoff of healthy UTE lung values) was significantly different between nine healthy volunteers and sixteen ILD patients. Longitudinal change in UTE biomarkers correlated with change in CT CALIPER ILD% in the ILD patients, and most-strongly correlated to CT ground-glass changes in the lung parenchyma.
Introduction
Patients with interstitial lung diseases (ILD)s present with a complex and heterogeneous range of imaging features1. High resolution CT is the current clinical gold standard for assessment of ILD-related lung structural changes. Quantitative CT techniques, such as CALIPER, can automatically characterize CT images for patterns of ILD at a voxel-wise level2. These techniques remain poorly standardized, and the exposure to ionizing radiation may limit repeated scanning for longitudinal monitoring of disease.State-of-the-art ultra-short echo time (UTE) MRI can provide 1H structural lung images of diagnostic quality approaching that of CT3, opening up the possibility for longitudinal follow-up of ILD progression4. However, the development and validation of quantitative UTE imaging biomarkers is required before UTE can become a robust clinical tool. Previously, we reported a single-timepoint lung signal density-based analysis of UTE MRI in idiopathic pulmonary fibrosis (IPF) patients, demonstrating a significant correlation with CALIPER ILD%5. This work aims to develop UTE lung biomarkers for monitoring longitudinal change in ILD patients and to benchmark them against CALIPER CT measurements.
Methods
Nine healthy volunteers and sixteen ILD patients (ten IPF, three hypersensitivity pneumonitis (HP), two drug-induced (DI)-ILD, one connective-tissue disease (CTD)-ILD) underwent 1H UTE lung MRI on a GE HDx 1.5T scanner using an 8-element cardiac array with a 3D radial sequence during free-breathing with prospective respiratory bellows gating on expiration (reconstructed voxel size 1.56–1.88 mm3).3 Healthy volunteers were imaged one week apart to assess inter-scan repeatability; while ILD patients were imaged at baseline and a follow-up timepoint ranging from 6-weeks to 1-year depending on ILD subtype. Each ILD patient underwent volumetric CT as close to the MRI visits as possible (mean difference: baseline=60 days; follow-up=2 days). The lung parenchyma in CT was characterized with CALIPER software (Mayo Clinic, Rochester, USA) for features of ILD (honeycombing, reticular changes and ground-glass opacities)2.UTE MRI was corrected for receiver array coil non-uniformity retrospectively using GE Orchestra software, and the lung parenchyma was automatically segmented using a deep-learning algorithm6. Two quantitative biomarkers of lung parenchyma signal were derived from the UTE images: (i) The normalized UTE parenchyma signal calculated by the normalization of the lung signal with the chest muscle signal7 and (ii) The percentage of UTE signal greater than a UTE signal threshold, derived from the 95% upper limit (threshold=0.677) of healthy volunteer normalized UTE lung values. To directly compare UTE and CT lung zone regions, CT images and corresponding CALIPER analysis masks were spatially co-registered to UTE images using ANTs toolkit (Figure 1)8. Warped CALIPER lung masks were used to define five regional zones (upper, middle, lower, peripheral and central) on UTE images, and UTE lung biomarkers were calculated for each zone.
Repeatability of UTE lung biomarkers was assessed with Bland-Altman analysis in the healthy volunteers. Mann-Whitney tests were performed to determine any significant difference between UTE lung biomarkers in the healthy and ILD groups. Finally, non-parametric Spearman’s correlation tests were used to determine any significant correlation between UTE lung biomarkers and CALIPER metrics in the ILD patients.
Results and Discussion
UTE and CT imaging metrics in each lung zone for healthy volunteers and ILD patients are summarized in Table 1. UTE lung biomarkers demonstrated good repeatability with Bland-Altman analysis bias of 4.1% (95% CI: -14.8 to 23.0%) and 1.3% (95% CI: -6.9 to 9.7%) between 1-week scans for normalized UTE lung signal and UTE high percentage, respectively. This bias is comparable to the repeatability reported for 129Xe and oxygen-enhanced lung MRI metrics in the same healthy volunteers9. Statistically significant differences (P<0.001) in both UTE lung biomarkers were observed between healthy volunteers and ILD patients globally and across all lung zones (Figure 2). The largest differences were observed in the lower zones, in keeping with the typical basal distribution pattern of IPF.For ILD patients there was no statistically significant change in CALIPER or UTE metrics between the two study visits. This is likely attributed to the relatively small sample size and range of ILD subtypes in this cohort who are expected to progress differently and at different rates. Figure 3 depicts two DI-ILD patients who exhibit contrasting trends at follow-up; however, changes observed on CALIPER ILD% are also reflected in the two UTE lung biomarkers. This was further confirmed with a moderate correlation between the longitudinal percentage change in global UTE lung signal (P=0.015, r=0.603) and UTE high percentage (P=0.018, r=0.591) with the change in CALIPER ILD% for all ILD patients (Figure 4a-b). Significant correlations were also observed in the lower and peripheral zones, with the strongest correlations observed in the lower zones (Figure 4c-d). Furthermore, change in ground-glass opacities% was the only individual CALIPER ILD pattern to significantly correlate with change in UTE lung biomarkers (Figure 4e-f), suggesting UTE lung MRI is most sensitive to ground-glass changes in ILD.
Conclusions
Two quantitative UTE lung biomarkers, normalized UTE lung signal and UTE high percentage, were significantly different between healthy volunteers and ILD patients. These biomarkers demonstrated similar sensitivity to longitudinal change as CT CALIPER ILD% in sixteen ILD patients, and most-strongly correlated to CT ground-glass changes in the lung parenchyma.Acknowledgements
This work was supported by TRISTAN/IMI (No. 116106), NIHR grant NIHR-RP-R3-12-027 and MRC grant MR/M008894/1References
- Weatherley, N.D., et al., Experimental and quantitative imaging techniques in interstitial lung disease. Thorax, 2019. 74(6):611-619.
- Bartholmai, B.J., et al., Quantitative computed tomography imaging of interstitial lung diseases. J Thorac Imaging, 2013. 28(5):298-307.
- Johnson, K.M., et al., Optimized 3D ultrashort echo time pulmonary MRI. Magn Reson Med, 2013. 70(5):1241-50.
- Ohno, Y., et al., Pulmonary high-resolution ultrashort TE MR imaging: Comparison with thin-section standard- and low-dose computed tomography for the assessment of pulmonary parenchyma diseases. J Magn Reson Imaging, 2016. 43(2):512-32.
- Chan, H.F., et al. Comparison of UTE 1H lung MRI with quantitative CT and hyperpolarized 129Xe diffusion-weighted MRI in IPF. in Proc. Intl. Soc. Mag. Reson. Med. 2021. 3214
- Astley, J.R., et al. Generalizable deep learning for multi-resolution proton MRI lung segmentation in multiple diseases. in Proc. Intl. Soc. Mag. Reson. Med. 2021. 3224
- Higano, N.S., et al., Quantification of neonatal lung parenchymal density via ultrashort echo time MRI with comparison to CT. J Magn Reson Imaging, 2017. 46(4):992-1000.
- Avants, B.B., et al., A reproducible evaluation of ANTs similarity metric performance in brain image registration. Neuroimage, 2011. 54(3):2033-44.
- Hughes, P.J.C., et al. Repeatability and correlation of hyperpolarized xenon-129 and oxygen enhanced MRI parameters in healthy volunteers. in Proc. Intl. Soc. Mag. Reson. Med. 2020. 2305
Figures
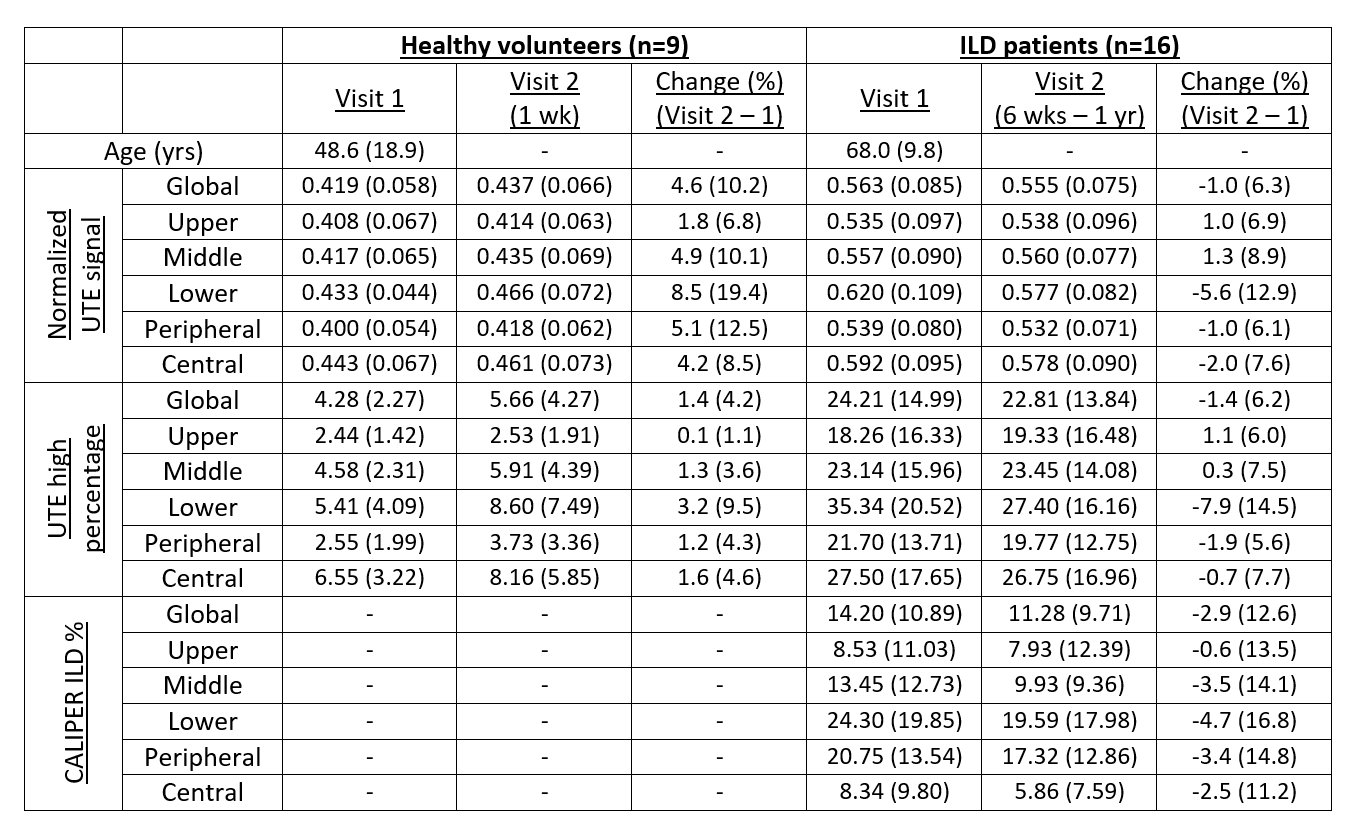
Table
1: Global and regional lung zone values for imaging metrics of normalized UTE
MRI signal, UTE high percentage and CT CALIPER ILD% for healthy volunteers and
ILD patients. All values provided as mean (standard deviation). ILD% = ground
glass% + honeycombing% + reticular changes%
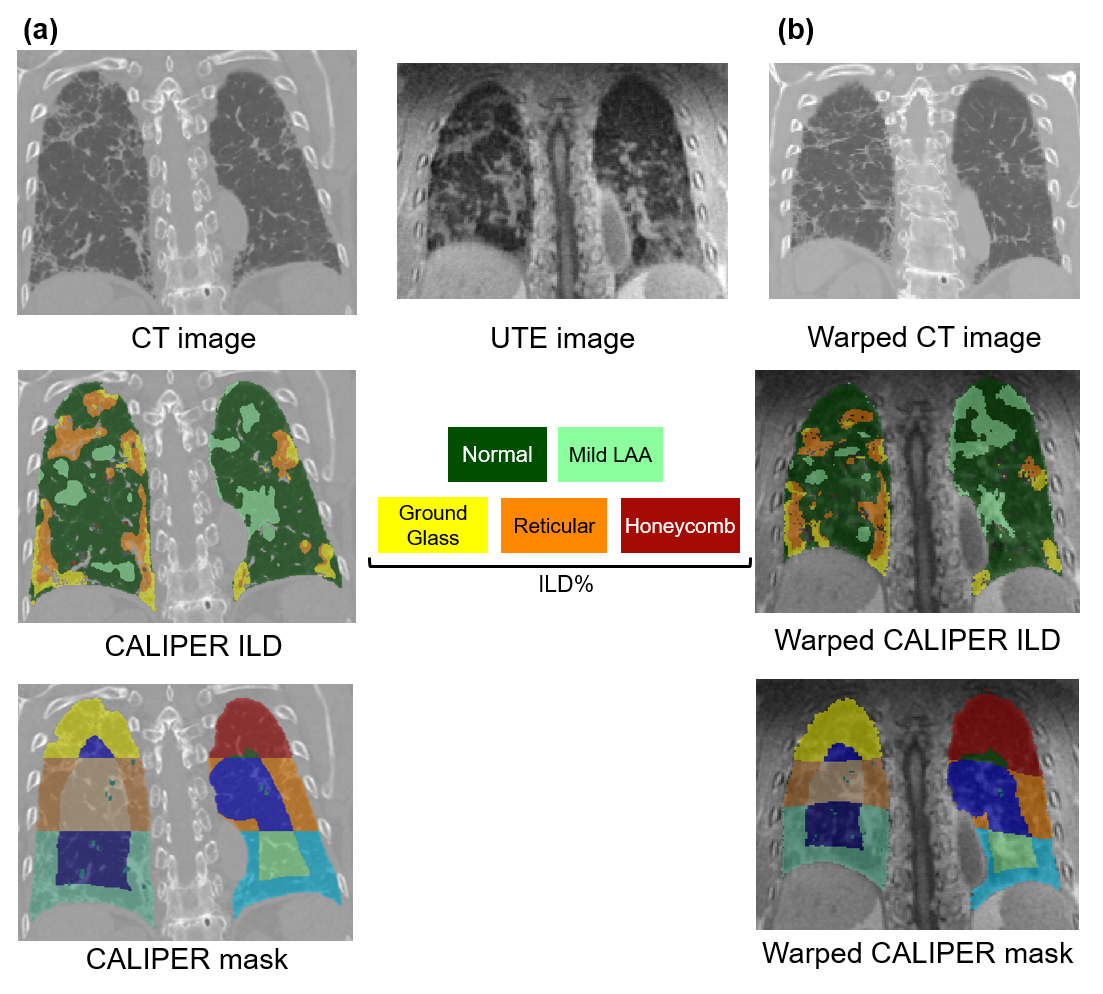
Figure
1: (a) Example
CT image from an IPF patient with corresponding CALIPER analysis ILD and lung
segmentation masks. Regional lung zones including upper, middle, lower,
peripheral and central are highlighted. (b) This CT image was registered to the
patient’s corresponding UTE image producing a warped CT image and corresponding
warped CALIPER ILD and lung masks.
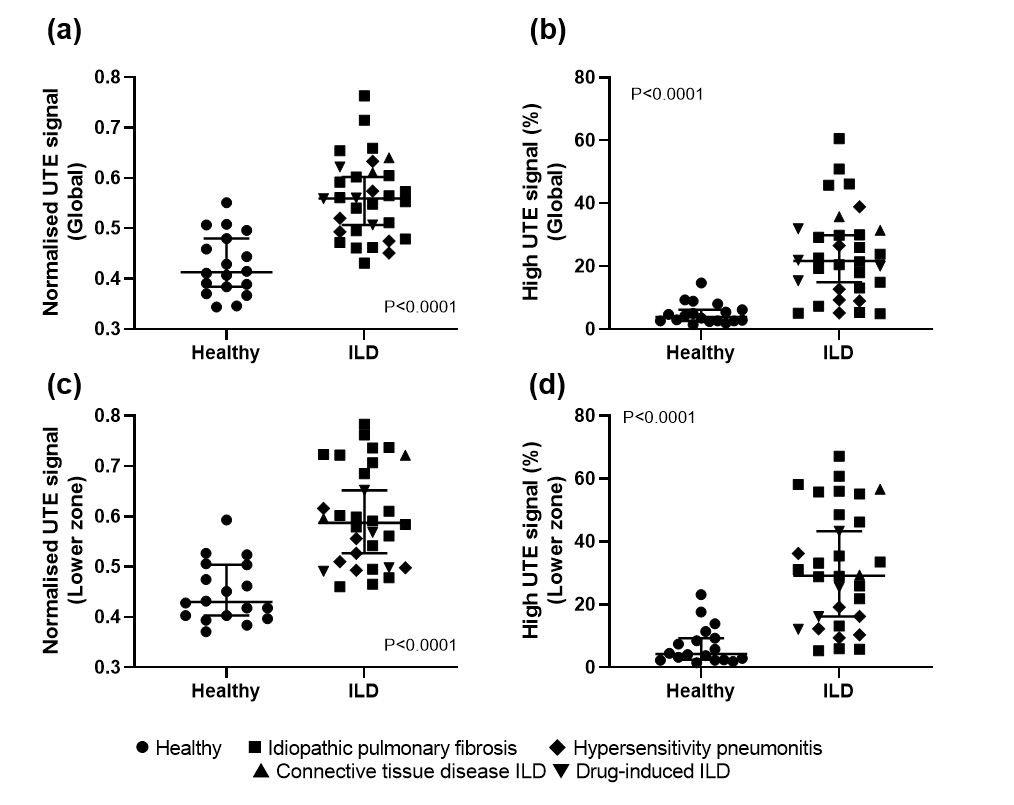
Figure
2: Mann-Whitney
tests of normalized UTE lung signal and UTE high signal percentage for the
healthy volunteers and ILD patients. Statistically significant difference
between healthy and ILD was observed globally (a-b), and in the lower zone
region of the lung (c-d).
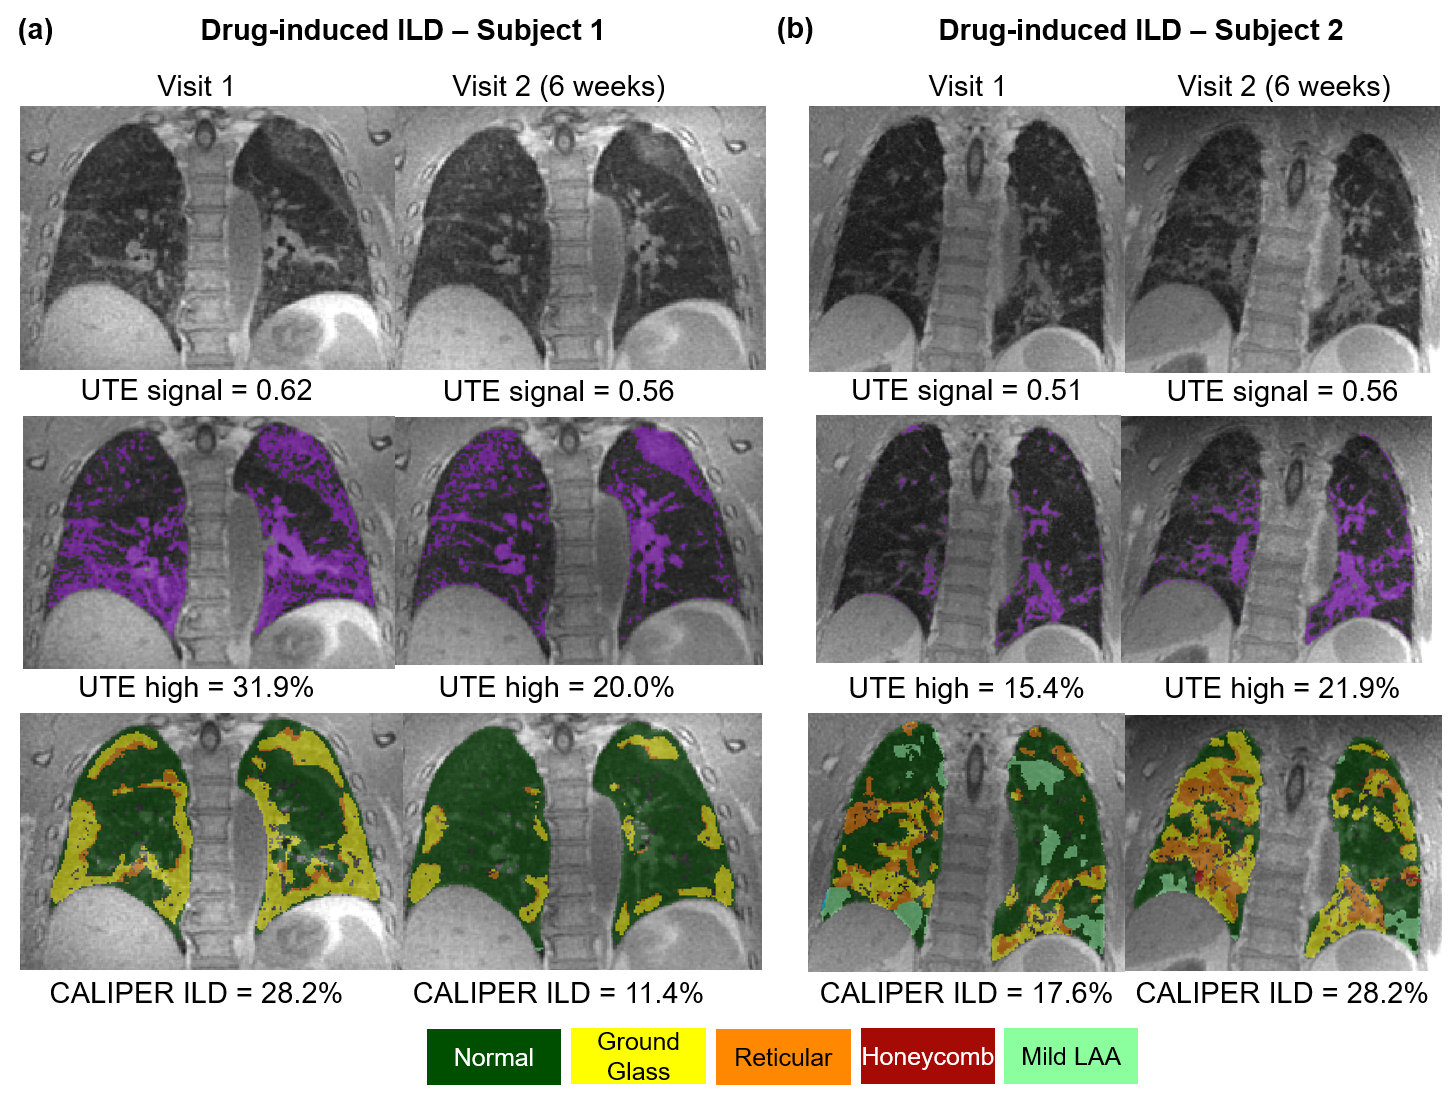
Figure
3: (a) Example
UTE images from one drug-induced ILD patient who demonstrated a decrease in
normalized UTE lung signal and UTE high percentage at Visit 2 after 6 weeks. A
similar decrease in CALIPER ILD% was observed with good qualitative spatial
concordance UTE high percentage (purple) and CALIPER ILD patterns. (b) Example
UTE images from a second drug-induced ILD patient who demonstrated an increase
in all metrics after 6 weeks and also good spatial concordance UTE high
percentage and CALIPER ILD patterns.
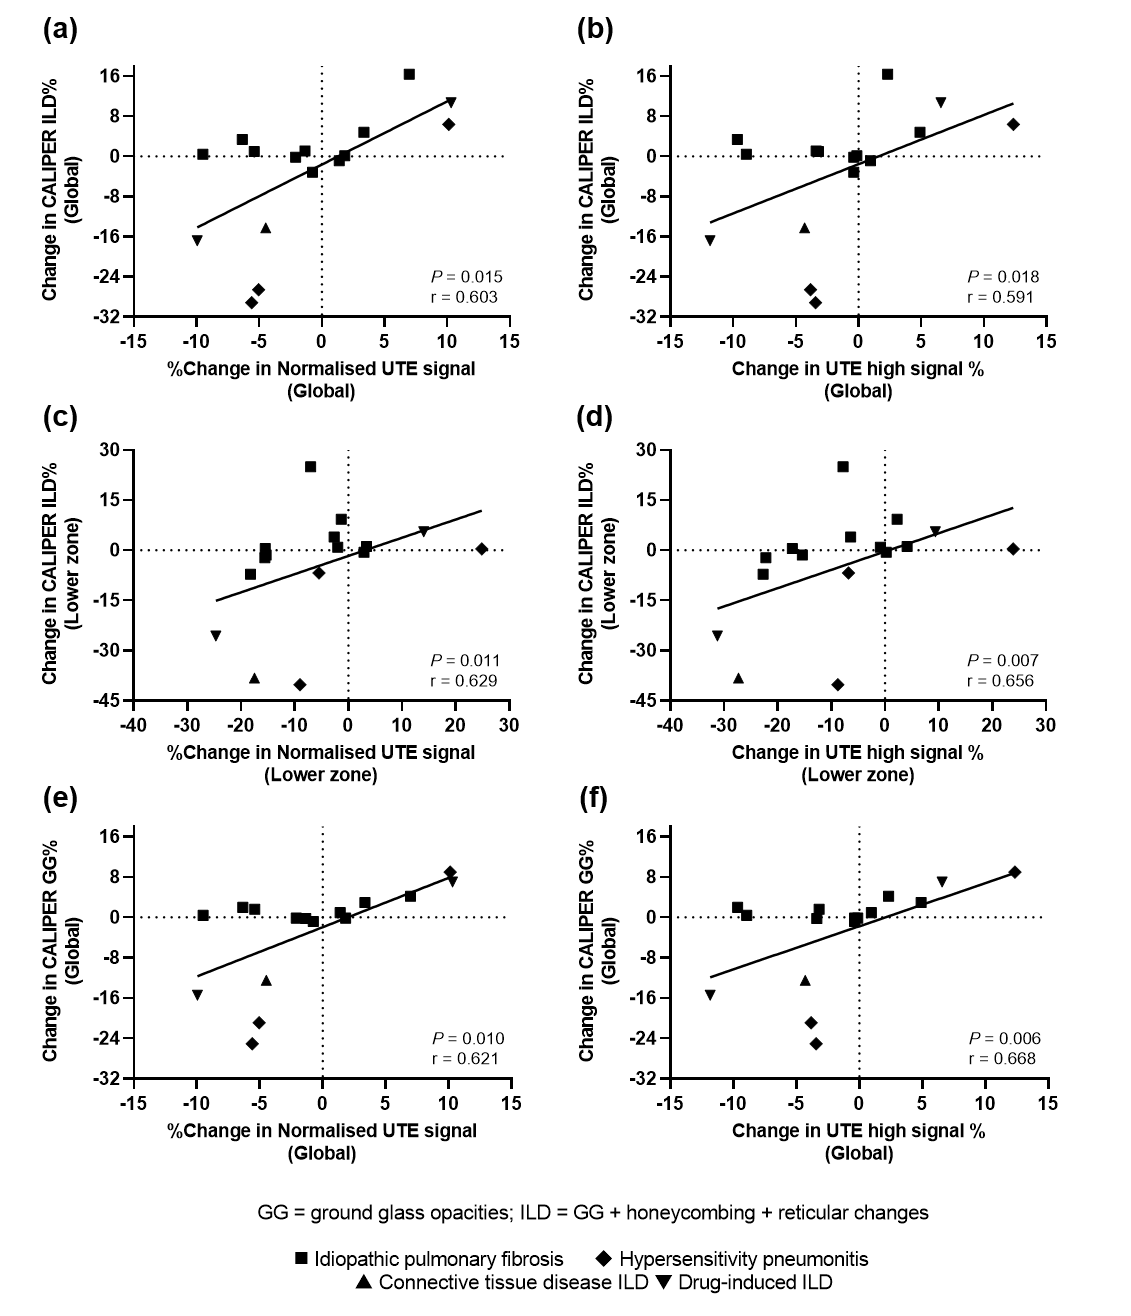
Figure
4: Statistically
significant correlation of percentage change in global normalized UTE signal
(a) and UTE high percentage (b) with change in CALIPER ILD% in sixteen ILD
patients. Significant correlations were also observed in the lower zone lung
region (c-d). Of the specific ILD patterns, significant correlations were
observed for change in ground glass opacities% (GG%) with global normalized UTE
signal (e) and UTE high percentage (f).
DOI: https://doi.org/10.58530/2022/0663