0658
Functional Lung MRI at 3.0 T using Oxygen-Enhanced MRI (OE-MRI) and Independent Component Analysis (ICA)1Centre for Medical Image Computing (CMIC), University College London, London, United Kingdom, 2Bioxydyn Limited, Manchester, United Kingdom, 3MCMR, Manchester University NHS Foundation Trust, Manchester, United Kingdom, 4Division of Radiotherapy and Imaging, Institute of Cancer Research, London, United Kingdom
Synopsis
Analysis of dynamic lung OE-MRI is challenging due to the presence of substantial artefacts and poor SNR, particularly at 3 T. We propose a cyclical oxygen delivery scheme and ICA to separate the oxygen-enhancement signal from these confounding factors at 3 T. The proposed method extracts a well-defined oxygen-enhancement signal that removes confounds due to proton density changes, blood flow and motion. We also demonstrate the ability to resolve the opposite enhancement effects of the parenchymal and vascular OE-MRI signals to provide information on pulmonary vasculature and gas distribution. The method is shown to be sensitive to smoking status.
Introduction
Dynamic oxygen-enhanced MRI (OE-MRI) uses elevated levels of oxygen to provide contrast to indicate regional lung function. Dynamic lung OE-MRI analysis suffers from a number of substantial confounds: artefacts, blurring and proton density changes arise due to cardiac and respiratory motion; blood flow; poor signal-to-noise ratio resulting from the extremely short parenchymal T2* and its low proton density. Here we propose an approach to separate the oxygen-enhancement signal from these confounding factors using independent component analysis (ICA)1. We apply the method to multi-slice dual-echo gradient echo data acquired dynamically at 3.0 T using a cyclical oxygen delivery scheme, and demonstrate that the approach can effectively separate the oxygen-enhancement signal from noise and artefacts. We demonstrate that by applying ICA to these data it is possible to differentiate vascular and parenchymal OE-MRI signals. Finally, we show that this approach is able to differentiate smokers from non-smokers.Methods
17 healthy volunteers (mean age 32 years, range 22-55 years; 11 male, 6 female; 7 current smokers, 10 non-smokers) were scanned using a 2D coronal multi-slice dual-echo RF-spoiled T1-Fast Field Echo (T1-FFE) sequence at 3.0 T on a Philips Ingenia (Table 1).The delivered gas was cycled between air and 100% O2 three times, finishing on air (Table 1, Figure 1). Motion correction was performed using a non-linear registration algorithm in ANTs2. Thoracic cavity masks including the heart and major vessels were created by manual segmentation using ImageJ3.
ICA was applied across masked slices using scikit-learn FastICA4. Results from the first echo are presented in this abstract. The number of independent components for each volunteer was set to between 18-27 as experiments showed this enabled reliable identification of the parenchymal OE-MRI signal component time course. A map of the strength of the oxygen-enhancement component’s contribution to each voxel were produced as an index related to ventilation. The median lung oxygen-enhancement component value was compared between current smokers and non-smokers using a 2-tailed paired t-test; p-values < 0.05 were considered significant.
Results
The time course of the extracted ICA oxygen-enhancement component exhibited well-defined cyclic enhancement behaviour (according to the gas delivery protocol) and contained less noise than the mean signal intensity time course (Figure 1).The oxygen-enhancement component maps in Figure 2B, for the healthy volunteer in Figure 1, demonstrate the ability of ICA to resolve two opposing oxygen-induced enhancement effects at 3.0 T arising from the parenchyma and oxygenated blood.
For comparison, we show percentage signal enhancement (PSE) maps (Figure 2C). The parenchyma in the PSE map is less uniform than the ICA map due to the confounding signals arising from blood flow, motion, etc. These confounding signals hide the oxygen-enhanced signal change in the heart in the PSE map, contrasting with the strong enhancement of the heart in the ICA map where confounding signals have been separated.
The extracted ICA oxygen-enhancement component was observed consistently across the healthy volunteers (Figure 3). The median parenchymal ICA component map value (indicating the strength of the oxygen-enhancement component’s contribution to each voxel) was significantly greater for non-smokers than for current smokers, p-value = 0.005 (Figure 4).
Discussion
To the best of our knowledge, this is the first application of ICA to lung OE-MRI, although PCA and ICA of tumour OE-MRI have been reported5,6. However, lung OE-MRI is more complex due to: respiratory and cardiac motion; motion-induced proton density changes; blood flow; poor SNR of the lung. Despite these challenges we have shown that ICA can effectively remove such confounds to extract a well-defined oxygen-enhancement signal at 3.0 T.The ICA oxygen-enhancement maps appeared more homogenous across the lung compared to PSE maps from this study and to 3.0 T OE-MRI studies in the literature7,8. We also demonstrate a significant difference between the median oxygen-enhancement component map values of current smokers from non-smokers, suggesting a smoking related effect.
The oxygen-enhancement component from ICA was highly sensitive to the opposite enhancements of oxygenated blood from lung tissue. Both T2* and T1 are expected to decrease in these tissues under hyperoxic conditions9. The parenchymal signal change is dominated by T2* effects: elevated gaseous oxygen concentrations in the alveoli increase the susceptibility, reduce T2*, and reduce gradient echo signal10. Due to having a longer T2*, the signal change of oxygenated blood is dominated by T1 effects: elevated concentrations of paramagnetic dissolved oxygen shorten T1 and increase gradient echo signal. This effect is marked in the heart and aorta (Figure 2B), and can also be observed in the major veins in the lung. Hence, the MRI method we developed, in conjunction with ICA, provides simultaneous sensitivity to the T1 and T2* changes within the lung to provide information on gas distribution.
Conclusion
The novel application of ICA to lung OE-MRI enabled the separation of the oxygen-enhancement component from the confounding factors present in the lung, advancing the potential of OE-MRI analysis. At 3.0 T, the OE-MRI method we have developed was sensitive to, and enabled the resolution of, lung tissue from oxygenated blood to reveal previously hidden OE-MRI information on pulmonary vasculature and gas distribution. The method is also sensitive to smoking status, suggesting likely sensitivity to pathology in future clinical studies.Acknowledgements
This work is supported by the EPSRC-funded UCL Centre for Doctoral Training in Medical Imaging (EP/L016478/1), by the Cancer Research UK National Cancer Imaging Translational Accelerator (NCITA) award C1519/A28682, and by Innovate UK award 104629.
Many thanks to Lucy Caselton for her help in acquiring the MR scans.
Thanks to Dave Higgins (Philips) for his advice in developing the MR protocol.
References
1. Hyvärinen, A. Fast and Robust Fixed-Point Algorithms for Independent Component Analysis. IEEE Transactions on Neural Networks 10(3): 626-634 (1999).
2. Avants, B. B. et al. A reproducible evaluation of ANTs similarity metric performance in brain image registration. Neuroimage 54(3): 2033–2044 (2011).
3. Schneider, C. et al. NIH Image to ImageJ: 25 years of image analysis. Nat Methods 9(7): 671–675 (2012).
4. Pedregosa, F. et al. Scikit-learn: Machine Learning in Python. Journal of Machine Learning Research 12(85): 2825−2830, (2011).
5. Featherstone, A. K. et al. Data-driven mapping of hypoxia-related tumor heterogeneity using DCE-MRI and OE-MRI. Magn. Reson. Med. 79(4): 2236-2245 (2018).
6. Moosvi, F. et al. Fast and sensitive dynamic oxygen-enhanced MRI with a cycling gas challenge and independent component analysis. Magn Reson Med. 81(4): 2514– 2525 (2019).
7. Tibiletti, M. Comparative study of 3D inversion recovery centric ordered fast field echo in lung dynamic oxygen enhanced MRI at 1.5 T and 3 T. Proc. Intl. Soc. Mag. Reson. Med. 2455 (2018).
8. Thieme, S. F. et al. Oxygen-Enhanced MRI of the Lungs: Intraindividual Comparison Between 1.5 and 3 Tesla. RöFo 183(04): 358 – 364 (2011).
9. Triphan, S. M. et al. Oxygen enhanced lung MRI by simultaneous measurement of T1 and T2 * during free breathing using ultrashort TE. J Magn Reson Imaging. 41(6):1708-14 (2015).
10. Pracht E. D. et al. Oxygen-enhanced proton imaging of the human lung using T2. Magn Reson Med. 53(5):1193-6 (2005).
Figures

Table 1: Details of the 2D coronal multi-slice dual echo T1-FFE sequence.
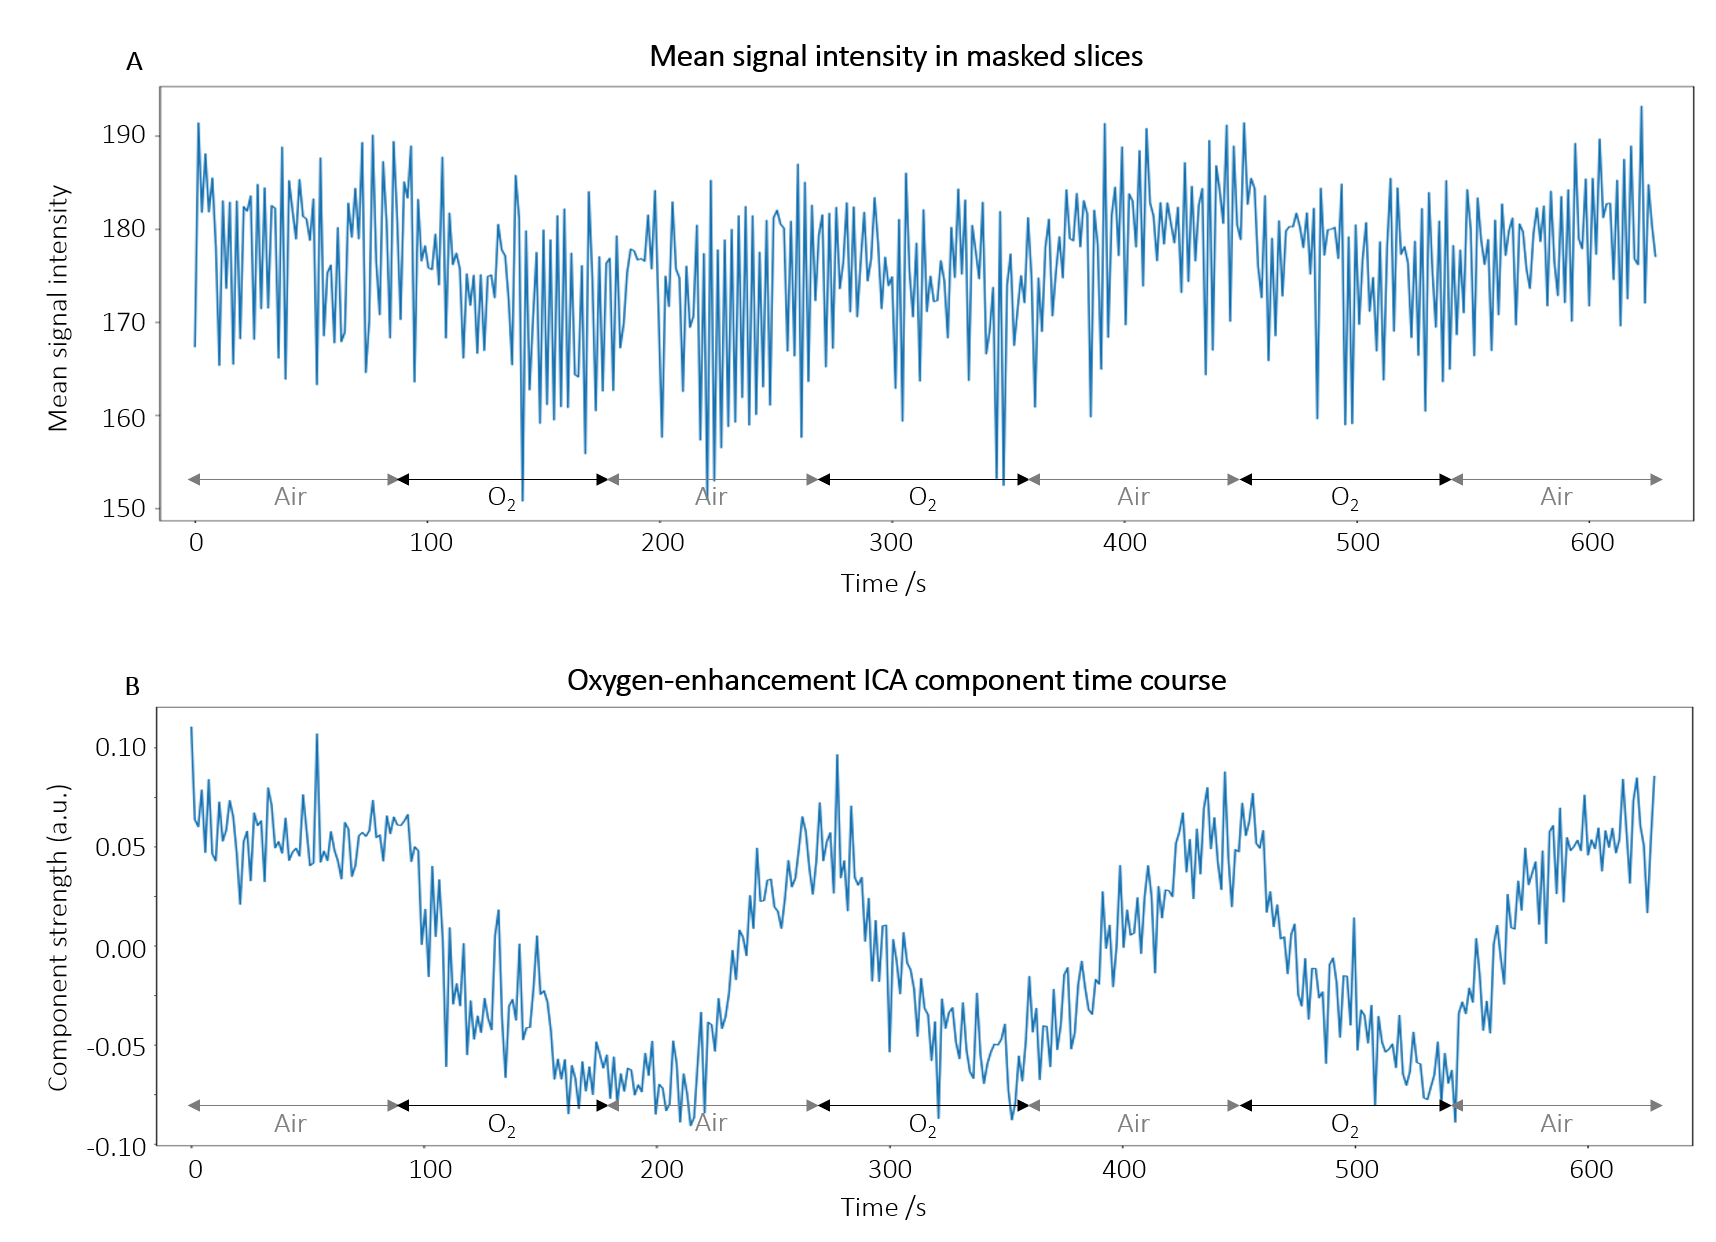
Figure 1: (A) Time course of the mean signal intensity (lung and cardiac mask, all slices) for registered first echo images of a non-smoker. As expected, the time course exhibits oxygen-induced signal reduction due to the dominance of parenchymal T2*-shortening at 3.0 T. Cyclic temporal behaviour due to 100% O2 inhalation is visible but heavily degraded by confounding factors. (B) Time course of the oxygen-enhancement component separated from the confounding signals present in the OE-MRI data (shown in (A)) through the use of ICA. Cyclic temporal behaviour is clear.
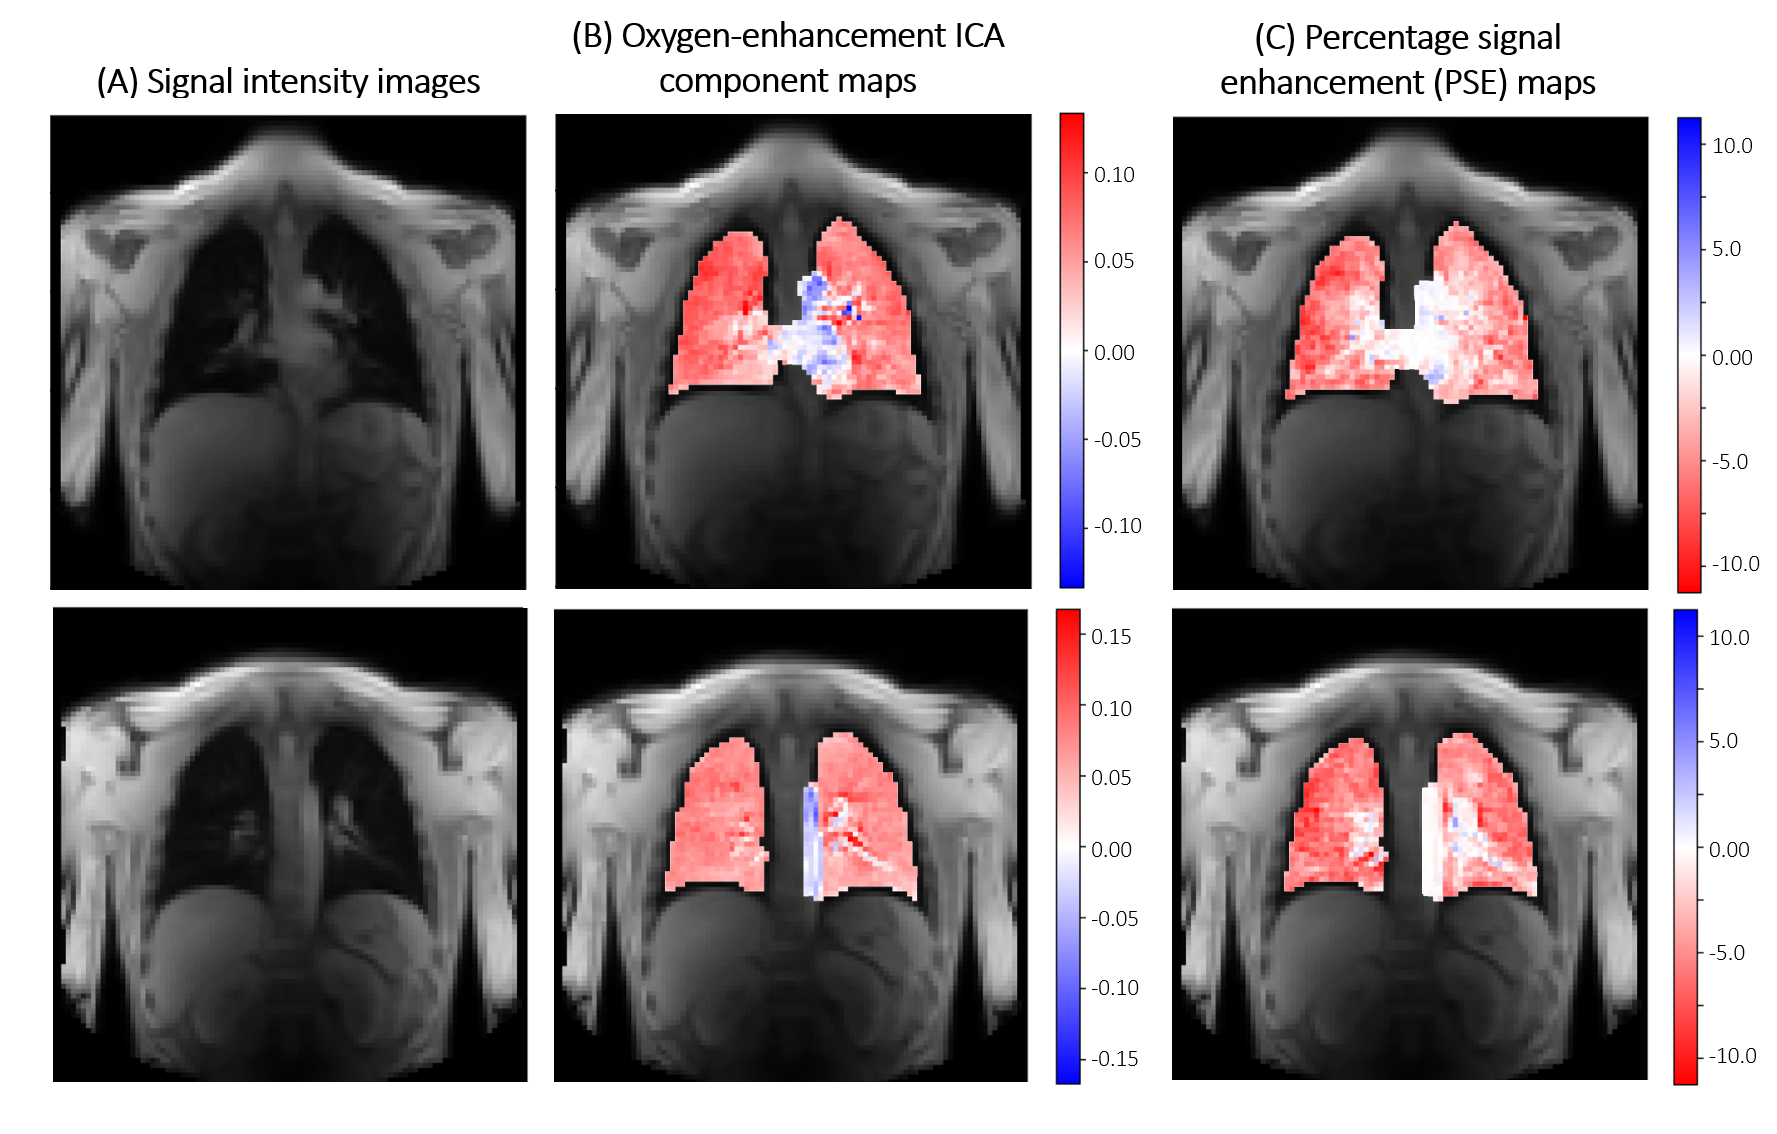
Figure 2: (A) Images of two slices from the healthy volunteer data presented in Figure 1, acquired during air-breathing. (B) Corresponding oxygen-enhancement ICA component maps. The parenchyma, the heart, and oxygenated major blood vessels enhance oppositely due to their different contrast mechanisms, which ICA is able to distinguish. (C) The percentage enhancement maps (relative signal change of air to oxygen inhalation) were unable to resolve the characteristic enhancement of the heart and major vessels from the parenchyma due to the presence of confounding signals.
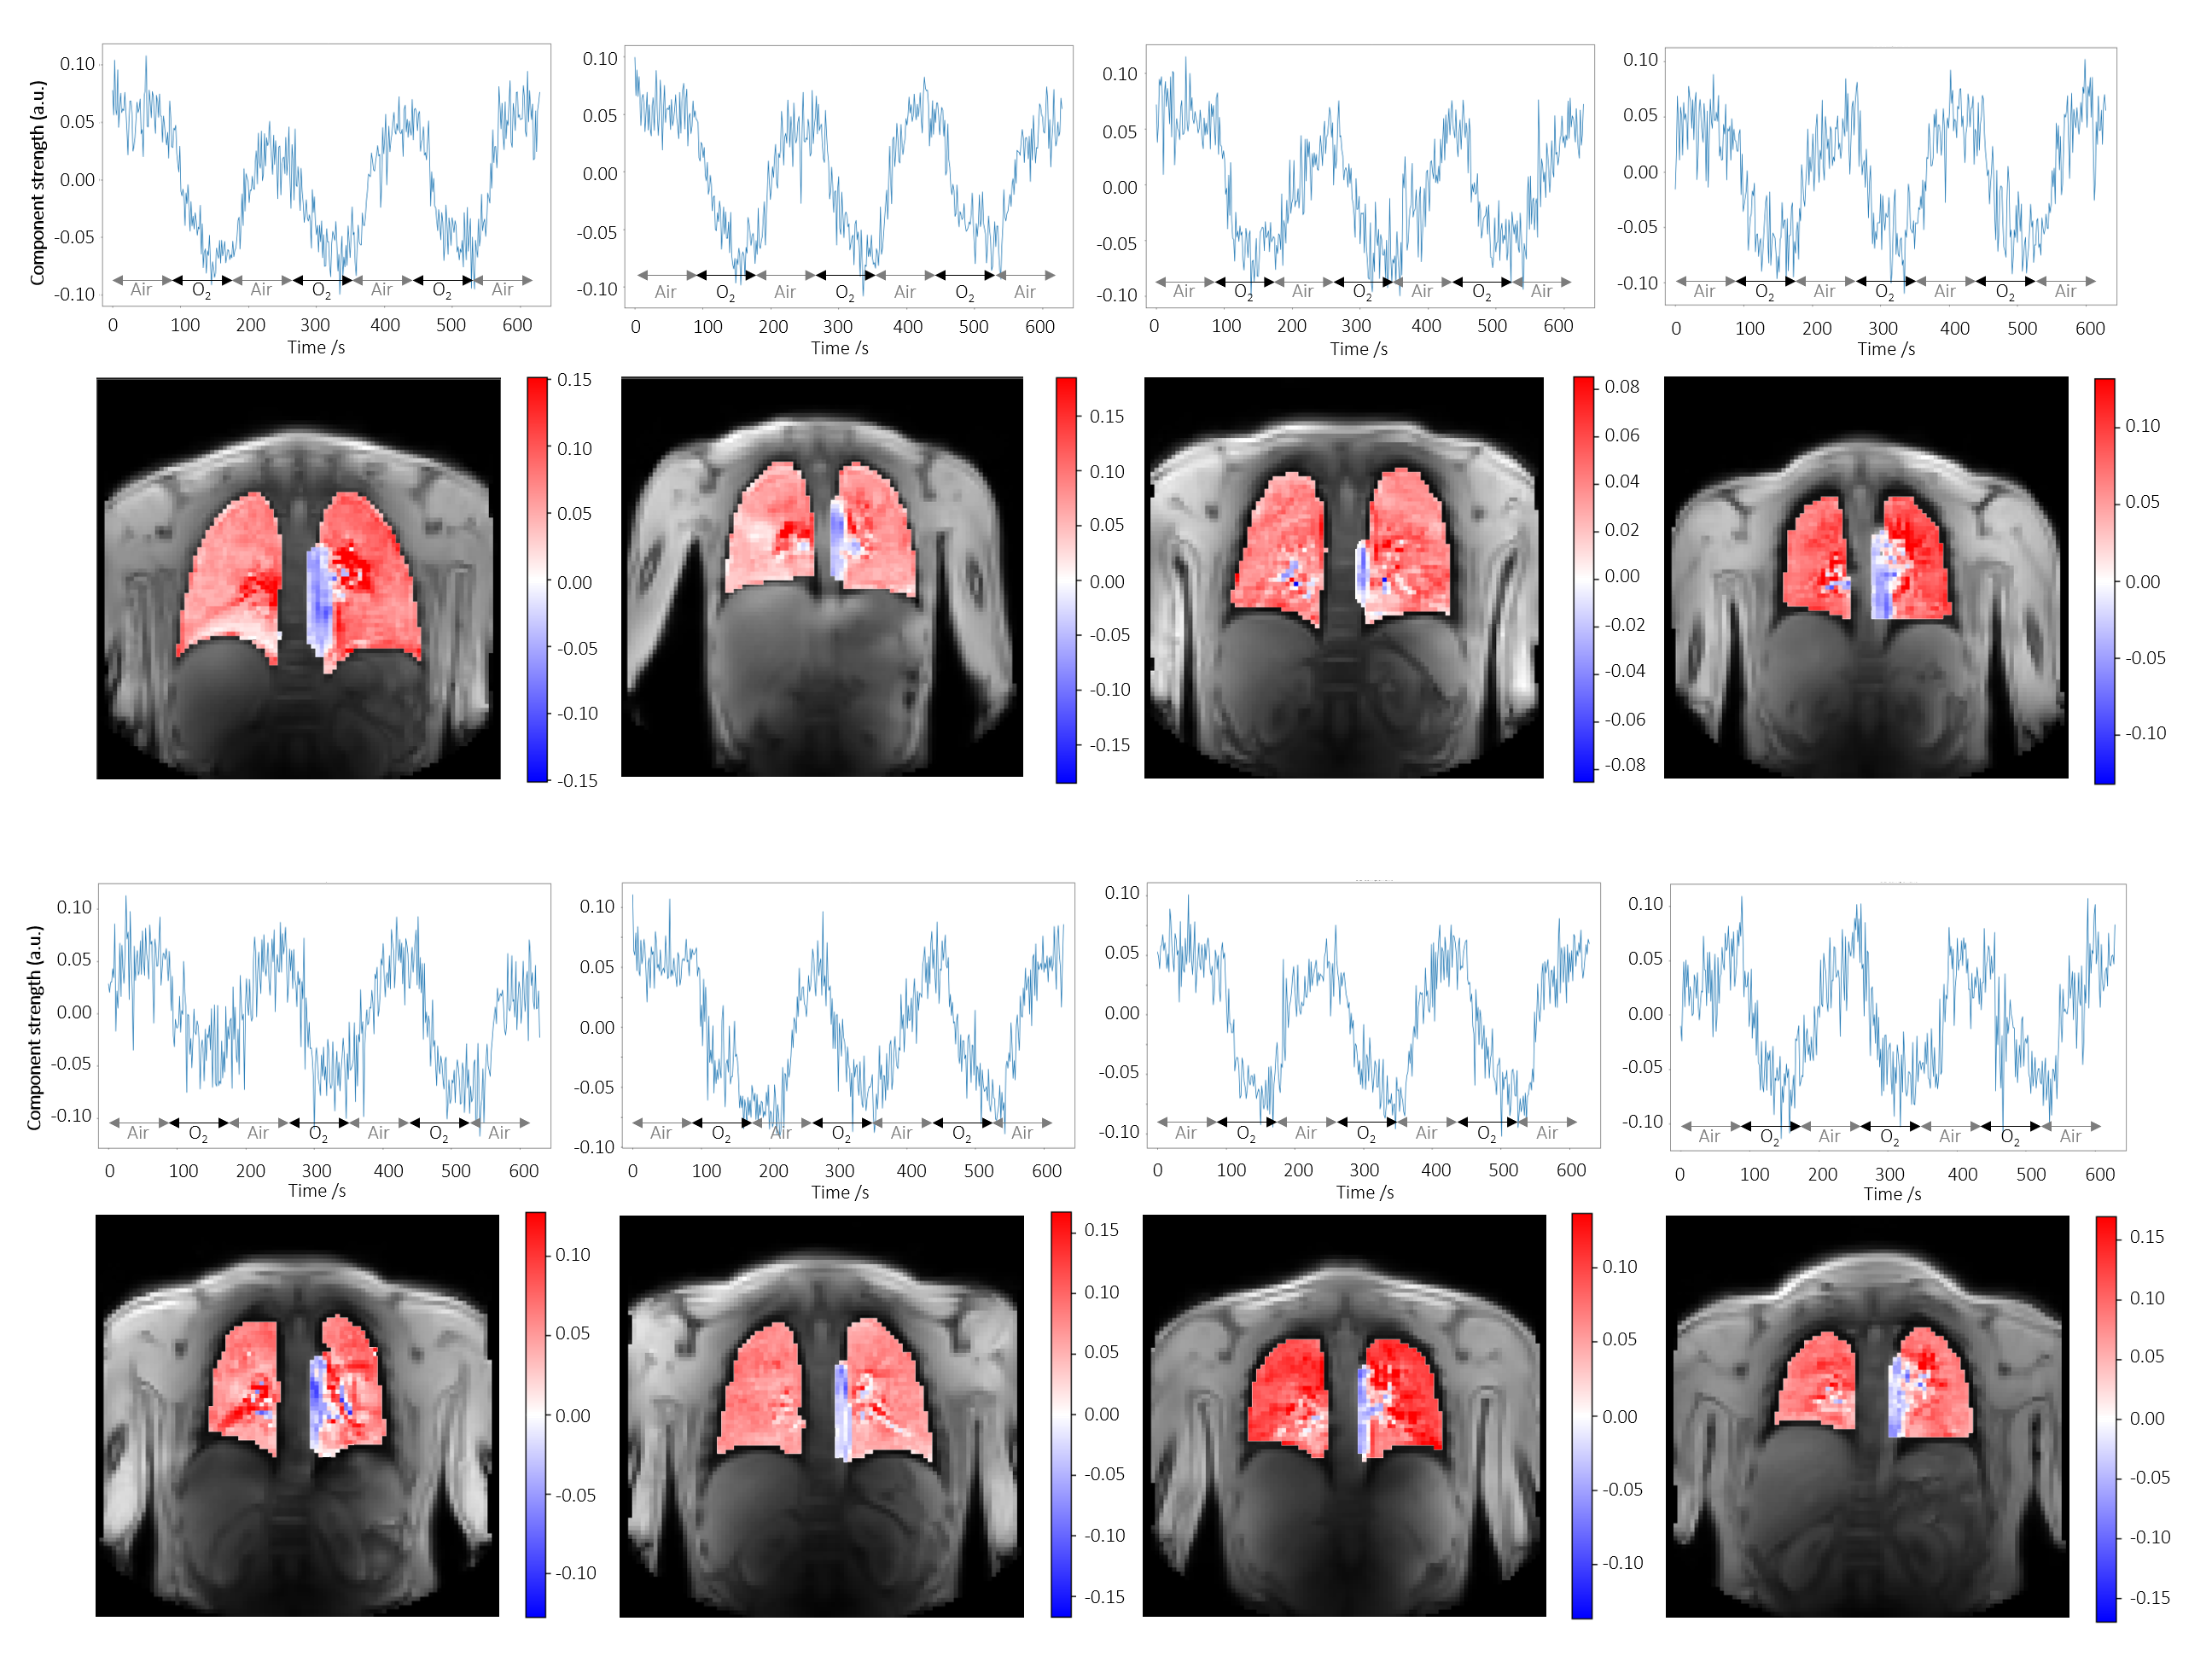
Figure 3: Oxygen-enhancement component time courses and component maps from 8 different healthy volunteers (mixture of non-smokers and current smokers). The oxygen-enhancement component was consistently extracted by ICA; the form of the component time course curves and features of the component maps were replicated across volunteers.
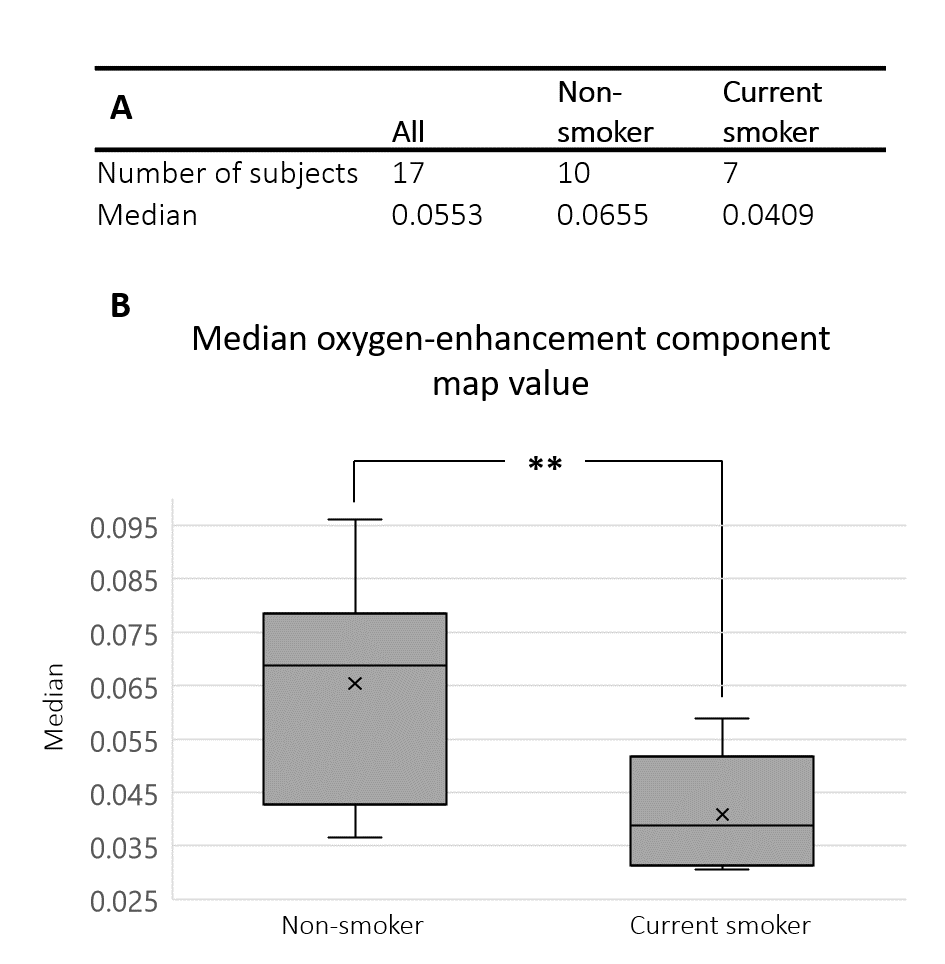
Figure 4: (A) Median parenchymal ICA component map value (indicating the strength of the oxygen-enhancement component’s contribution to each voxel) for all subjects and within two groups: non-smoker or current smoker. (B) Box-plot illustrating the significant difference between the parenchymal component strengths of the two groups in (A). Non-smoker component strengths were significantly greater than for current smokers, p-value = 0.005.