0657
Length-dependent spatial distribution of short fiber bundles revealed with the mesoscopic Chenonceau dataset1BAOBAB, NeuroSpin, CEA, Université Paris-Saclay, CNRS, Gif-sur-Yvette, France, France, 2iBrain U1253, Université de Tours, CHU Bretonneau, INSERM, Tours, France
Synopsis
Mesoscopic diffusion datasets allow to study the superficial tracts of the human brain. We exploit the new Chenonceau Dataset, an ultra-high resolution diffusion-weighted dataset, to investigate the organization of short fibers ( between 10 and 60 mm ) in the whole brain.
To achieve this goal, we process the dense Chenonceau connectogram with a hierarchical clustering algorithm to obtain coherent fiber bundles, sorted over a centimetric range. It leads to the first density mapping of short fibers across the whole human brain. This mapping displays important inter-hemispheric variations, supporting the functional lateralization of various functional networks.
Introduction
Diffusion MRI has powered the investigation of the structural connectivity of the human brain. The analysis of millimetric datasets allowed for a solid definition of the major pathways1,2. However the study of superficial tracts has not reached such a consensus3,4. Describing their high structural complexity asks for considerably more accurate diffusion information, both in spatial and angular resolutions. The recent progress in both in-vivo5 and ex-vivo6,7,8 acquisition schemes enables to reach the mesoscale resolution, and opens an avenue to study those superficial tracts.In this study, we exploit the mesoscopic Chenonceau dataset8 to investigate the distribution of such short fascicles at the surface of the cortex.
Material and methods
Mesoscopic MRI dataset - The Chenonceau dataset combines ultra-high resolution diffusion-weighted MRI (dMRI) scans at 200μm with ultra-high resolution anatomical scans at 100μm. It is particularly well-suited for the investigation of superficial white matter bundles, as its unique mesoscopic resolution gives access to fine diffusion information at the heart of dense and complex regions; allowing to more accurately map the trajectories and extremities of the smallest sub-cortical fiber bundles.This dataset has been acquired by splitting the brain sample into 4.2cmx4.2cmx5.6cm blocks, individually scanned using a preclinical 11.7T MRI system (Bruker, Ettlingen) with the following imaging protocol: 1) a T2w 3D-SE scan at 100μm (TE/TR=20/500ms, matrix 400x400, 560 slices, FA=90°, BW=50kHz, 1 average, 22h13min/fov); 2) a T2w 2D-SE scan at 150μm (TE/TR=16/6600ms, matrix 275x256, 374 slices, FA=90°, RBW=66kHz, 9 averages, 3h26min/fov); a multiple-shell diffusion-weighted 3D segmented EPI scan at 200μm and at b=1500/4500/8000s/mm² along 25/60/90 directions with 17 b=0s/mm² volumes (TE/TR=24.3/250ms, δ/Δ=5/12.3ms, matrix 212x204, 280 slices, FA=90°, RBW=300kHz, 30 segments, 1 average, 82h/fov). In total, more than 4500 hours of acquisition were dedicated to scanning the single brain, ensuring high SNR and good contrast across the entire volume.
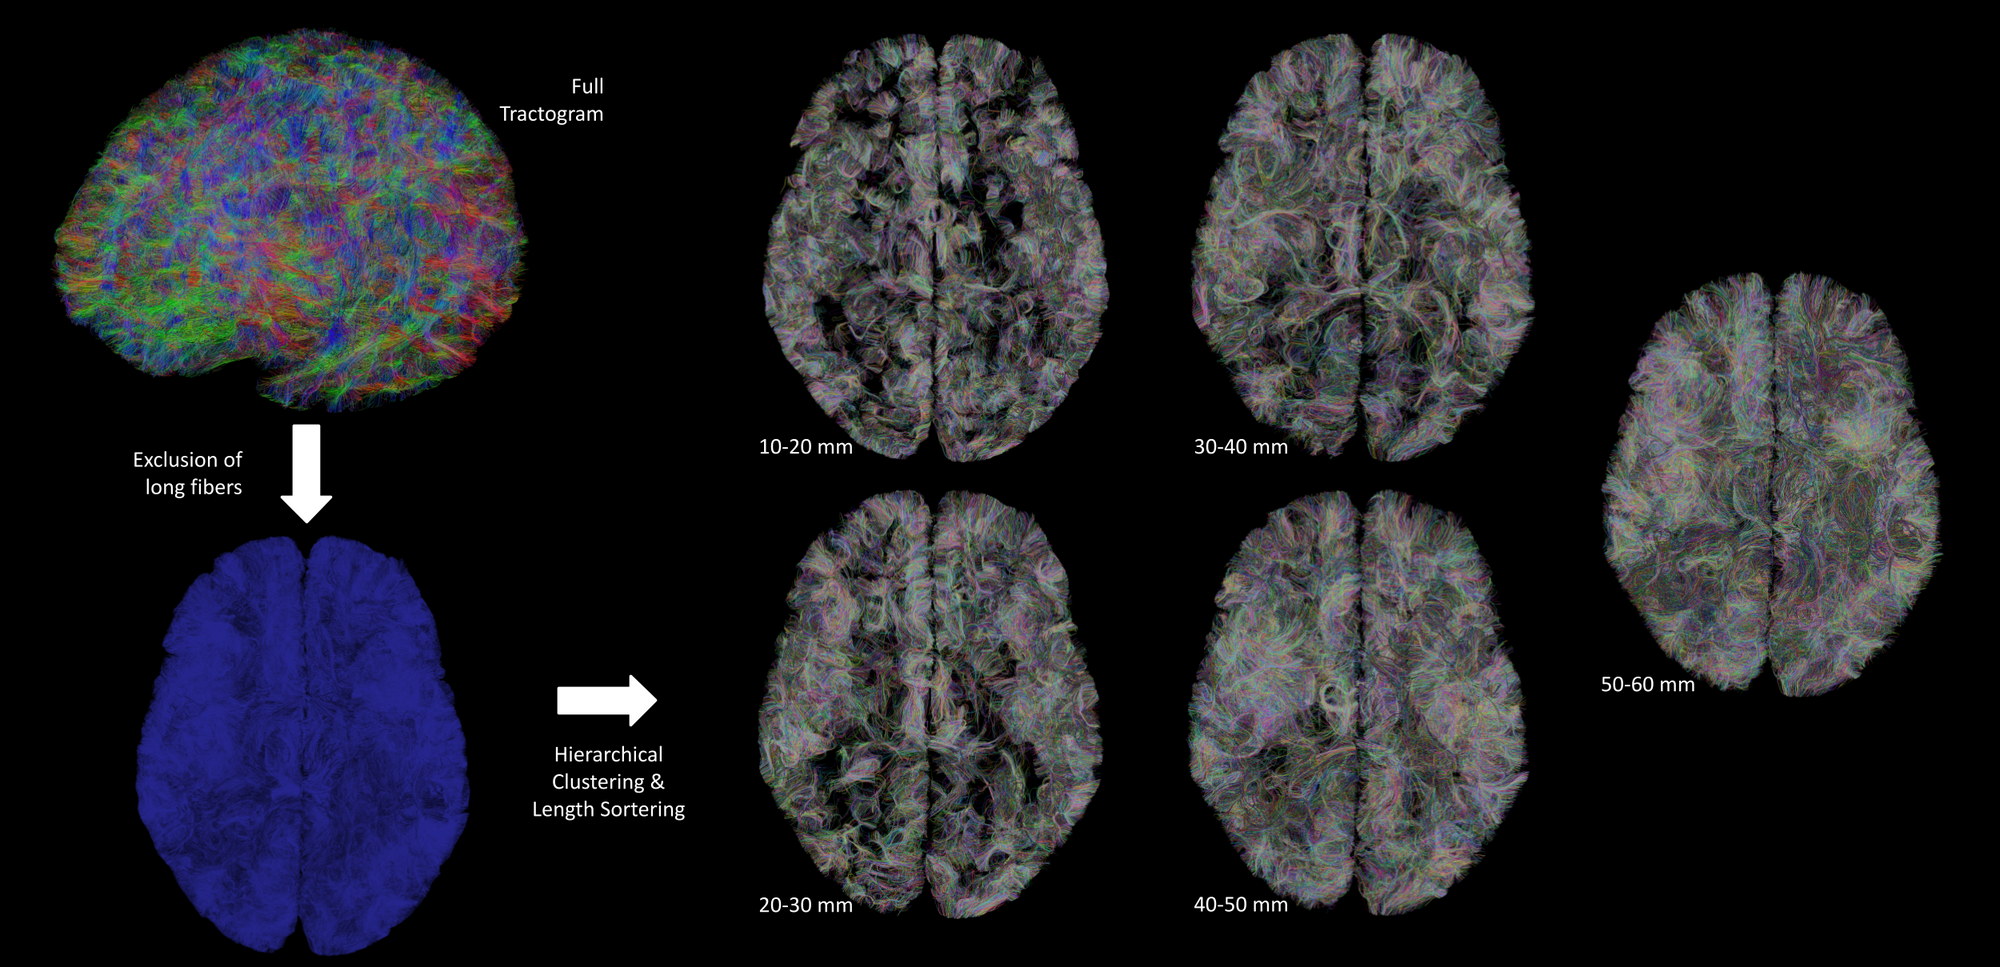
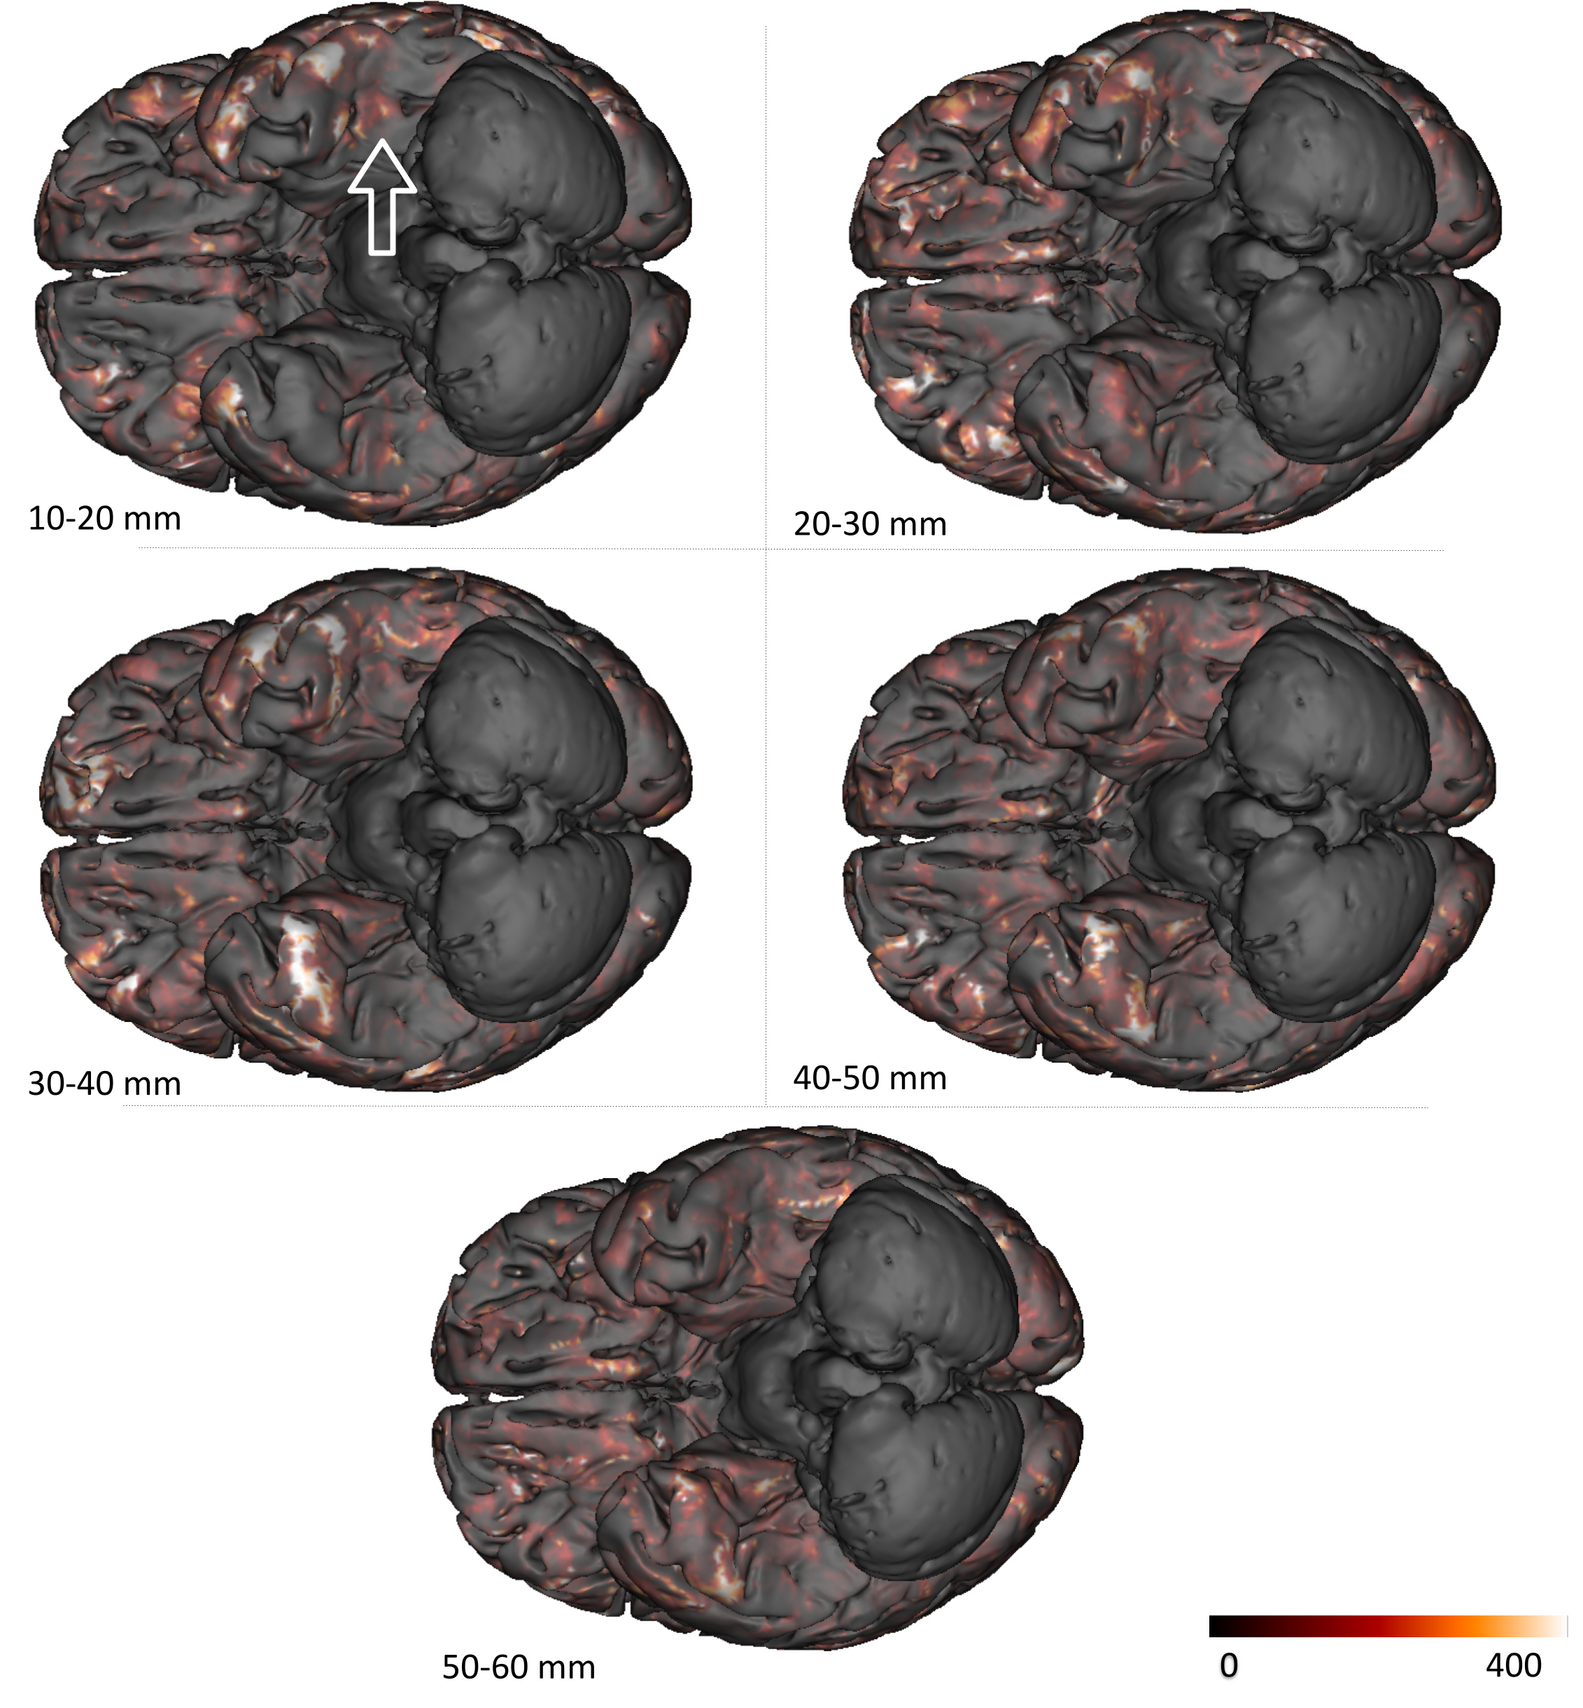
Preprocessing, fiber tracking and clustering - After removing the Rician noise corrupting the dMRI contrast with a non-local means filter9, the dMRI dataset was used to compute an analytical Qball10 ODF map (SH order 8, regularization factor 0.006) from which a dense connectogram populated by more than 140 million fibers (with length between 5 and 280mm) was reconstructed using a streamline regularized deterministic tractography technique11 ( 1 seed/voxel, forward step 25μm, aperture angle=6°, GFA-based regularization factor of 0.08). Since the study was focused on the superficial connectivity, tracts longer than 60mm were filtered out and tracts with length belonging to the range 10mm-60mm were grouped to form fascicles using the hierarchical clustering approach12, resulting in about 200 000 clusters gathering around 2.3 millions fibers per hemisphere (Fig.1). The obtained fiber fascicles were finally divided into 5 groups of different length ranges ( 10-20 / 20-30 / 30-40 / 40-50 / 50-60mm ), a fiber density map being further computed for each of these ranges. Last, each fiber density map was integrated along the normal direction to each vertex of the pial surface reconstructed from the anatomical scan, giving a synthetic representation of the cluster density for each corresponding length range.
Results and Discussion
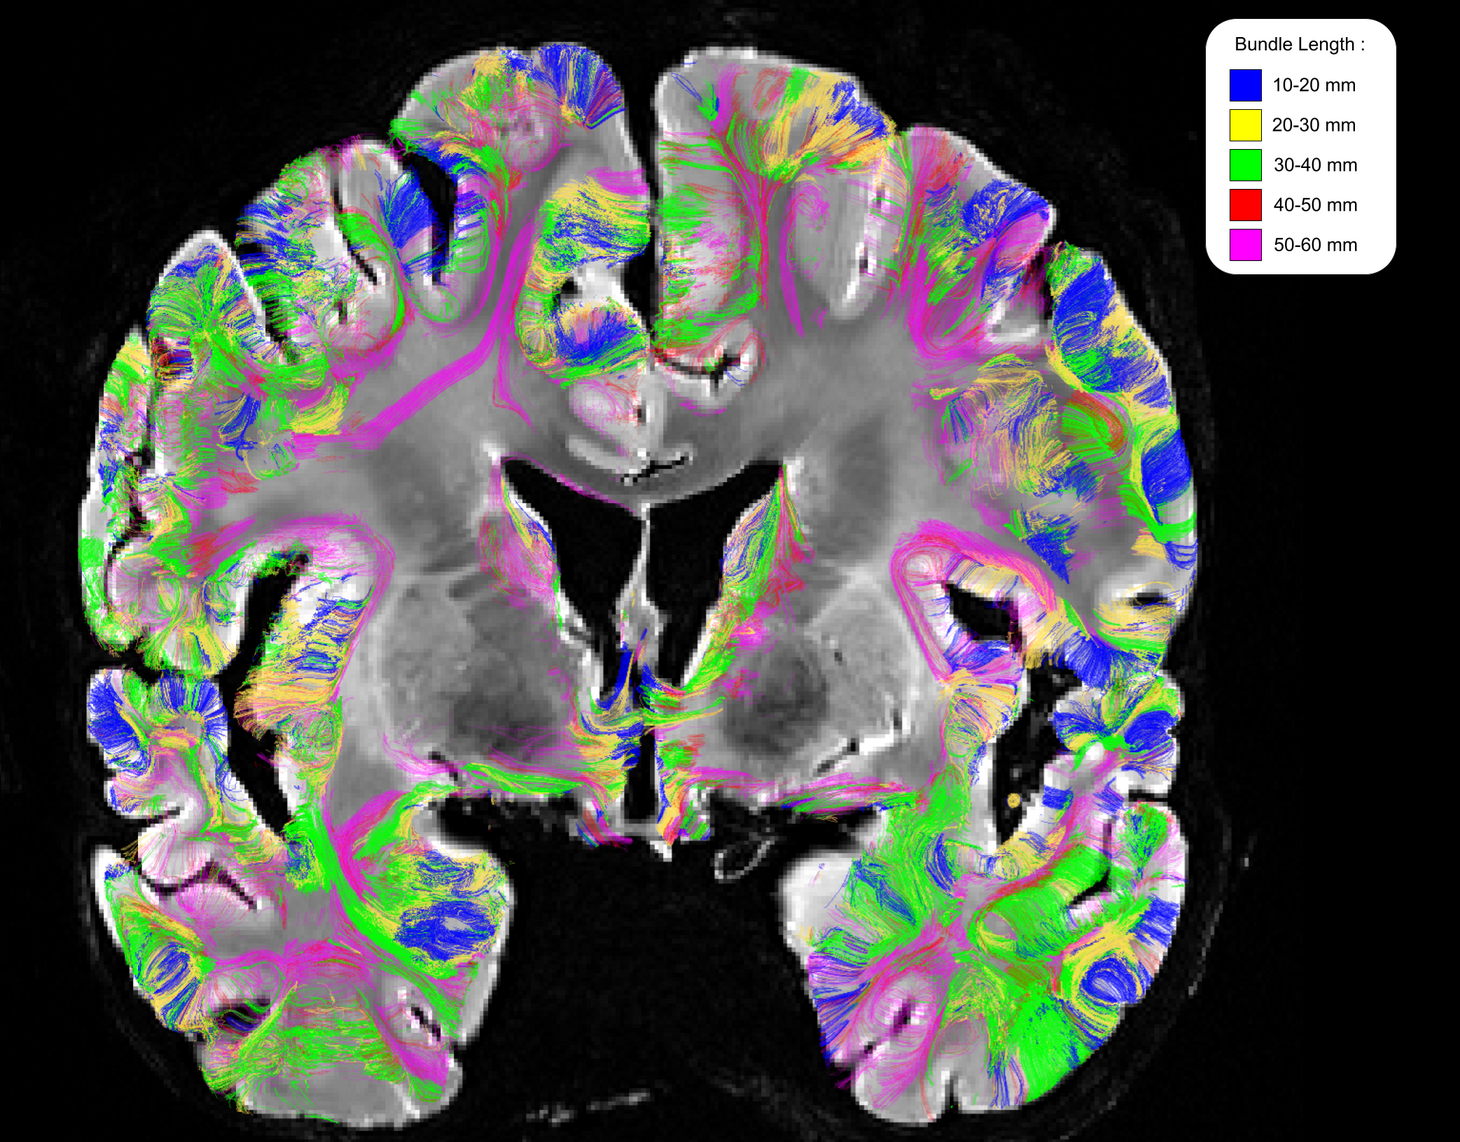
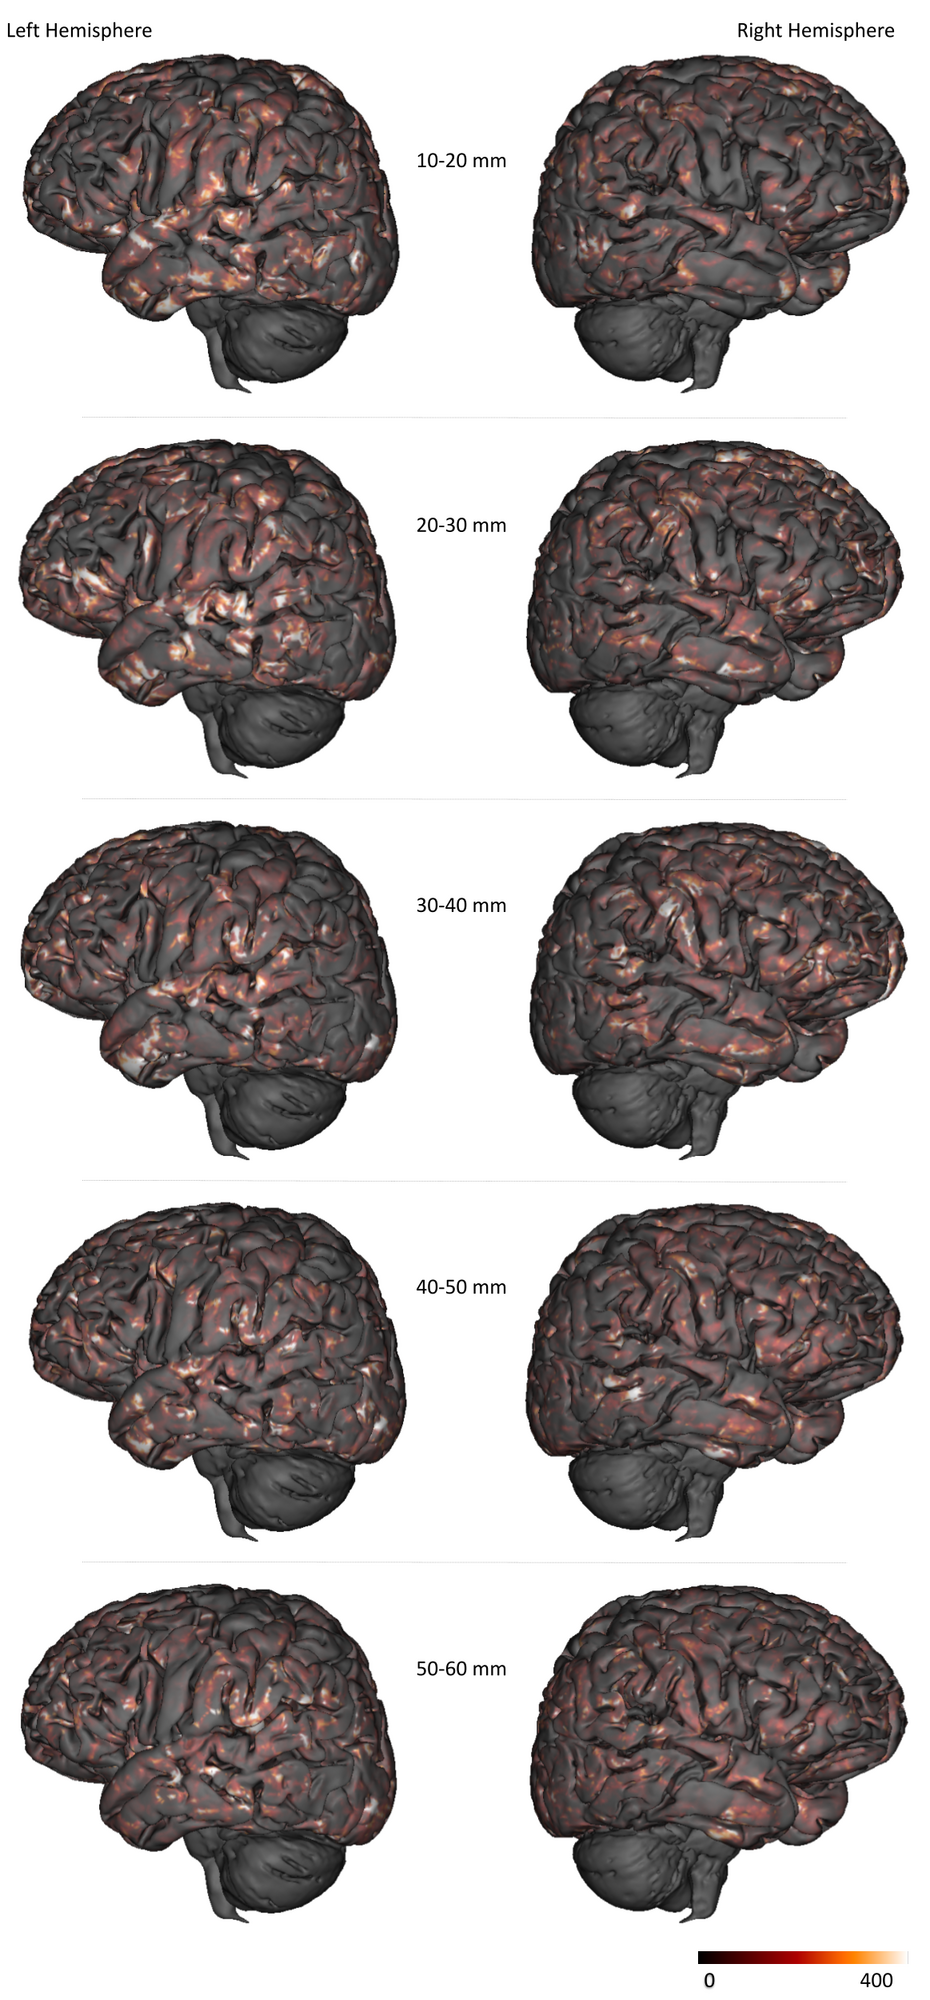
Figure 2 depicts the set of clusters obtained after clustering fibers in the 10-60mm range and shows how these fascicles are distributed in subcortical areas, distinguishing bundle lengths through color-encoding. Longer fiber clusters are located deeper than shorter ones, preferably located just below the cortex.Figure 3 presents the distribution of clusters in both hemispheres with a specific focus on the temporal cortex. It exhibits an important inter-hemispheric difference in the distribution of the shorter fascicles, with a higher density of 10-30mm fascicles on the left hemisphere. In particular, the temporal superior sulcus, the Wernicke and Broca’s areas show a high density of short connections that may reflect the complexity of these functional networks.
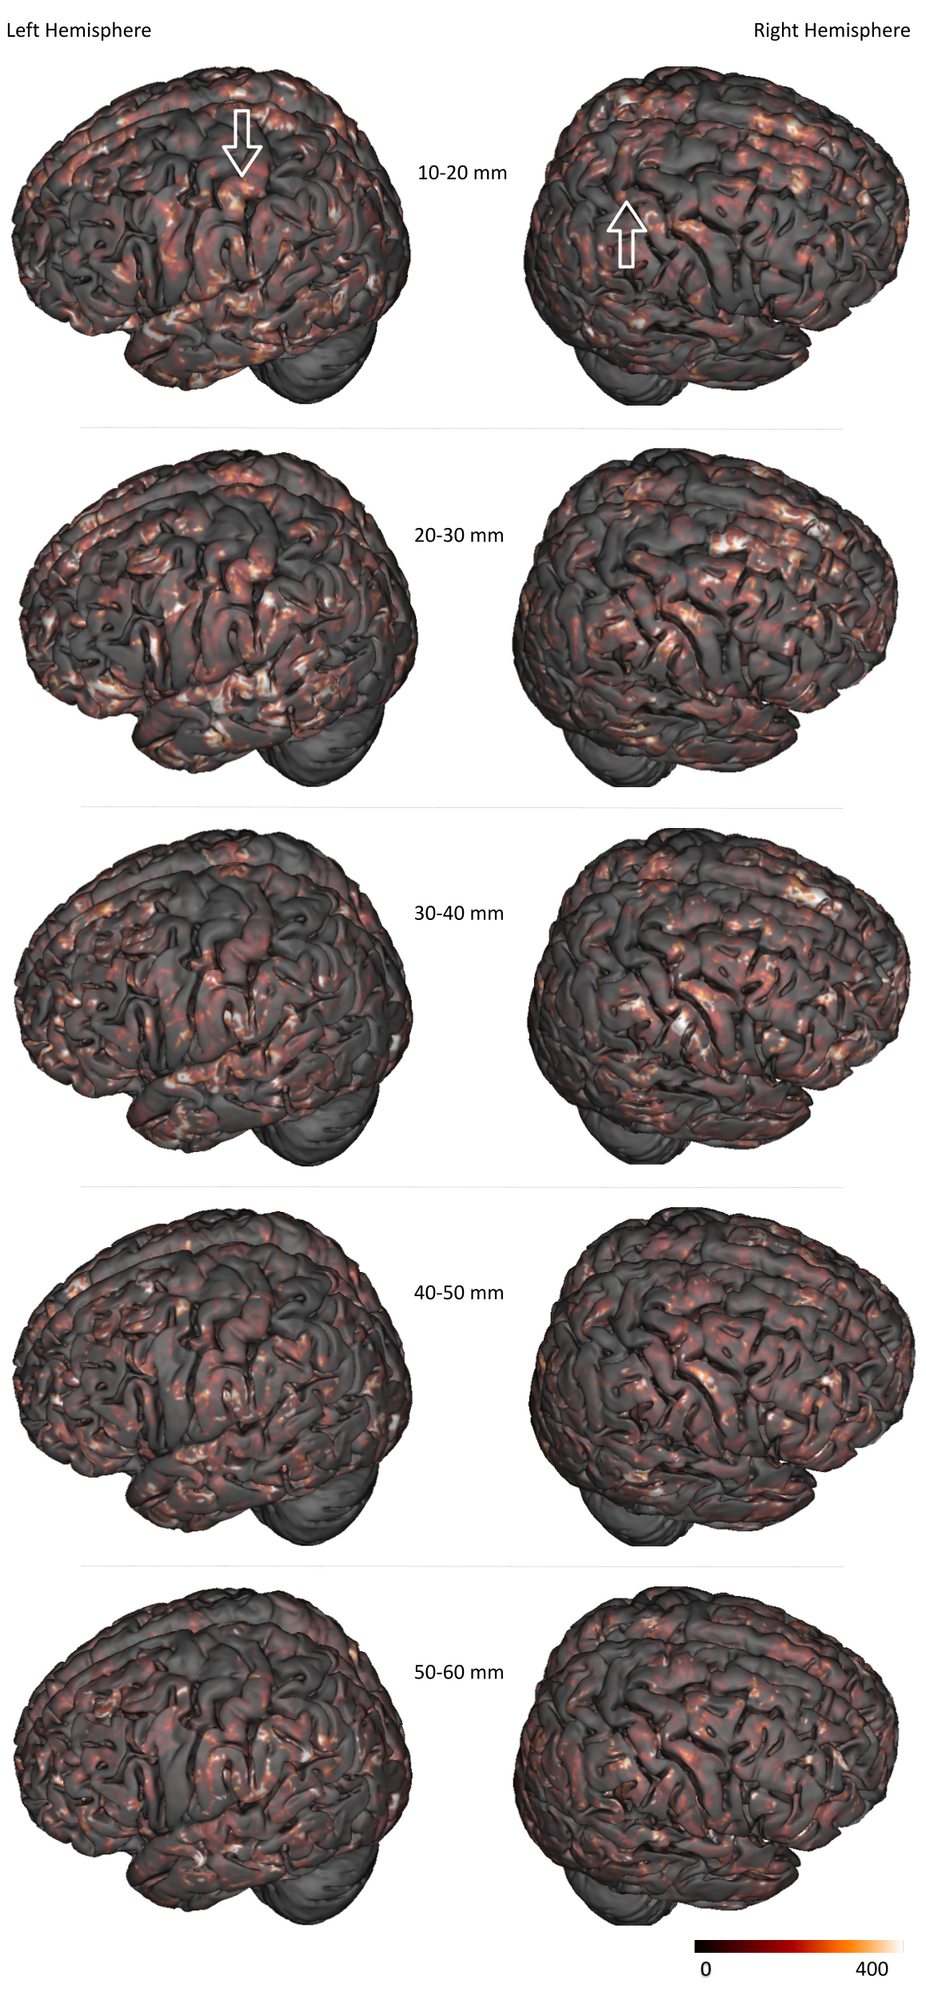
Figure 4 focuses on the motor area and shows a strong inter-hemispheric difference of the cluster density for the shortest of bundles ( <30mm), highlighting a higher density of clusters associated with the postcentral gyrus in comparison to the precentral gyrus. Of particular interest is the hand knob region : it displays a significantly higher density of the shortest bundles in the left hemisphere, which matches the fact that the Chenonceau subject was right-handed.
Figure 5 focuses on the fusiform gyri and shows a higher density of short bundles in the left gyrus compared to the right gyrus. The left fusiform gyrus embeds the visual word form area (VWFA) involved in the early visual processing of words and letters13. It seems that the position of this complex area coincides with a sharp spike in density of superficial fibers. This local overrepresentation of short fascicles may reflect the intense local processing required in the VWFA functional network.
Conclusion
Using a mesoscopic dMRI dataset, we showed important variations in short fascicle density at the surface of the cortex between hemispheres, supporting the functional lateralization of various functional networks (motor, language, vision). Future developments will aim at improving the representation of short fibers, to account for their shapes14 and to better understand their cortical spatial distribution.Acknowledgements
This project/research has received funding from:
- the European Union’s Horizon 2020Framework Programme for Research and Innovation under the Specific Grant Agreement No. 945539 (Human Brain Project SGA3).
- the ANR : FibrAtlasII-III, Project-ANR-14-CE17-0015
References
[1] Mori S. et al. “MRI atlas of human white matter”. Elsevier, Amsterdam. 2005
[2] Guevara P. et al. “Automatic fiber bundle segmentation in massive tractography datasets using a multi-subject bundle atlas” Neuroimage. 2012 Jul 16;61(4):1083-99.
[3] Yeh F-C et al. “Population-averaged atlas of the macroscale human structural connectome and its network topology” Neuroimage. 2018 Sep;178:57-68.
[4] Guevara M. et al. “Reproducibility of superficial white matter tracts using diffusion-weighted imaging tractography" Neuroimage. 2017 Feb 15;147:703-725.
[5] Wang F. et al. “In vivo human whole-brain Connectom diffusion MRI dataset at 760 µm isotropic resolution” Sci Data 8, 122 (2021).
[6] Fritz FJ, Sengupta S et al. “Ultra-high resolution and multi-shell diffusion MRI of intact ex vivo human brains using kT-dSTEAM at 9.4T.” Neuroimage. 2019 Nov 15;202:116087.
[7] Tendler B. C. et al. “The Digital Brain Bank: an open access platform for post-mortem datasets” bioRxiv 2021.06.21.449154;
[8] Popov A. et al. “Chenonceau: an entire ex vivo human brain 11.7T anatomical and diffusion MRI dataset at the mesoscopic scale”. ISMRM 2021 #2232
[9] Buades A. et al. -. Morel, "A non-local algorithm for image denoising," 2005 IEEE Computer Society Conference on Computer Vision and Pattern Recognition (CVPR'05), 2005, pp. 60-65 vol. 2, doi: 10.1109/CVPR.2005.38.
[10] Descoteaux M. et al. “Regularized, fast, and robust analytical Q-ball imaging.” Magn Reson Med. 2007 Sep;58(3):497-510.
[11] Perrin M. et al. “Fiber Tracking in q-Ball Fields Using Regularized Particle Trajectories”. In: Christensen G.E., Sonka M. (eds) Information Processing in Medical Imaging. IPMI 2005. Lecture Notes in Computer Science, vol 3565.
[12] Guevara P. et al. “Robust clustering of massive tractography datasets” Neuroimage. 2011;54(3):1975-1993.
[13] Bouhali, F. et al. "Anatomical Connections of the Visual Word Form Area" Journal of Neuroscience 12 November 2014, 34 (46) 15402-15414
[14] Labra Avila N. et al. “Inference of a U-fiber bundle atlas informed by the variability of the cortical folding pattern" 2020, 2020UPAST056
Figures