0655
Assessing white matter maturation and integrity in children using multi-component 3D-MR Fingerprinting and diffusion imaging1IRCCS Stella Maris, Pisa, Italy, 2Imago7 Research Foundation, Pisa, Italy, 3Department of Neuroscience, Psychology, Drug Research and Child Health, Neurofarba, University of Florence, Florence, Italy, 4Department of Physics, University of Pisa, Pisa, Italy, 5Department of Clinical and Experimental Medicine, University of Pisa, Pisa, Italy, 6Italian DEvelopmental Age Health Network (RETE IDEA Ministry of Health), Rome, Italy
Synopsis
New biomarkers for myelination could improve the understanding of neurodevelopmental diseases and their diagnosis and treatment. We quantified Myelin Water Fraction (MWF) using MRF in a cohort of children with leukoencephalopathies and age-matched controls and we compared it to DTI-based FA. We obtained normative curves of white matter development with both techniques. MWF discriminated between controls and patients with higher sensitivity than FA, it was more myelin-specific and independent of the degree of axonal packing. Thanks to short scan time and simultaneous acquisition of other quantitative maps, MRF-based MWF may represent a valuable tool to study developmental disorders.
Introduction
Neurodevelopmental disorders can hamper white matter (WM) myelination, which represents a crucial process in normal brain maturation1. The assessment of a biomarker capable of revealing alterations in myelin content would shed light on pathological mechanisms and improve clinical diagnosis, treatment and follow-up. In clinical practice, WM maturation and integrity are commonly assessed using Diffusion Tensor Imaging (DTI), thanks to the wide-spread availability of the acquisition protocols and analysis software. However, DTI-based measurements such as Fractional Anisotropy (FA) suffer from well-acknowledged limitations in the presence of complex fiber architecture2 and are not myelin-specific, also reflecting axon diameter and axonal packing3. In this work, we aimed at quantifying Myelin Water Fraction (MWF) using multi-component 3D-MR Fingerprinting (MRF)4 which enables high-resolution multi-parametric mapping in a short scanning time and it is expected to specifically detect myelin content. We assessed age-specific normative MWF in a cohort of healthy children and compared it to MWF estimation obtained in pediatric patients with WM disorders. Diagnostic capability of MRF-based MWF estimations was compared to standard DTI-based evaluation.Methods
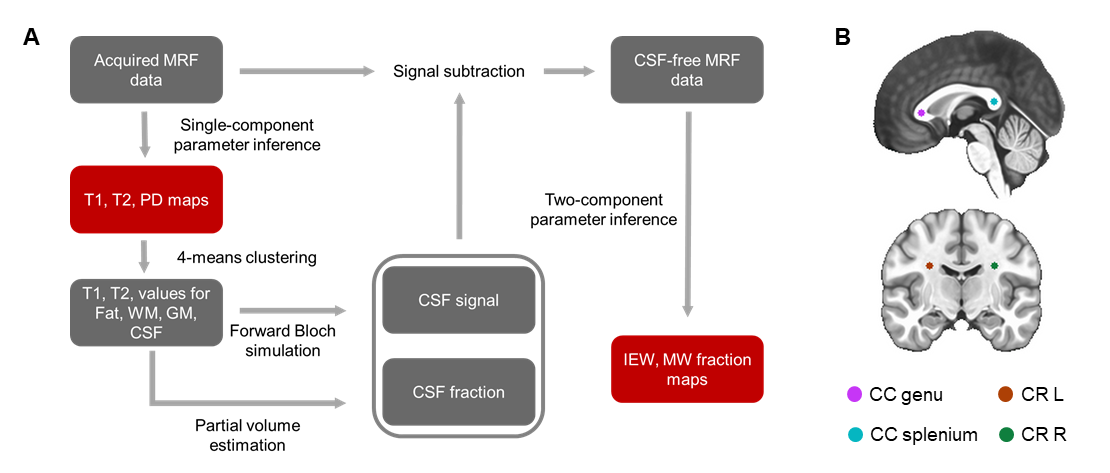
We included 19 healthy subjects and 12 children (aged 3months-12years) with several types of acquired or genetically determined leukoencephalopathies5. The acquisition protocol performed with a 1.5T MRI system included: DTI (voxel size=3x3x3mm3, 30 gradient directions, b=1000s/mm2), 3D spiral projection SSFP-MRF (voxel size=1.1x1.1x1.1mm3; inversion-prepared variable flip angle scheme with fixed TE/TR=0.5ms/8.5ms) and a 3D T1-weighted image (voxel size=1x1x1mm3) for anatomical reference. MRF-based MWF maps were obtained by removing cerebrospinal fluid signal6 and matching tissue-only signal evolutions with a precomputed two-component dictionary, i.e., Intra/Extra-cellular (IEW) and Myelin Water (MW), based on Extended Phase Graphs simulation including chemical exchange effects7 (myelin fraction resolution: 0.01) (Figure 1A). FA maps were computed after denoising and correcting DTI data for distortions and head movement. Spherical ROIs (radius=3mm) on the splenium and genu of Corpus Callosum (CC) and to left/right Corona Radiata (CR) were created on the T1-weighted images (Figure 1B), except for one patient with agenesis of CC. DTI-b0 and MRF-based T1-weighted synthetic images were skull-stripped and registered to the skull-stripped anatomical image. Transformation matrices were then applied to FA and MWF maps, respectively. Average FA and MWF and the corresponding standard deviations within each ROI were reported as a function of the patient age. MWF data of control subjects was fitted using a modified Gompertz function8:$$MWF(age) =\alpha⋅exp(-exp(\beta-\gamma⋅age)+\delta⋅age)$$
where α represents a transition period between the two different growth rates γ and δ, and β represents a delay time before the development starts. FA data was fitted using a monoexponential curve9.
Results
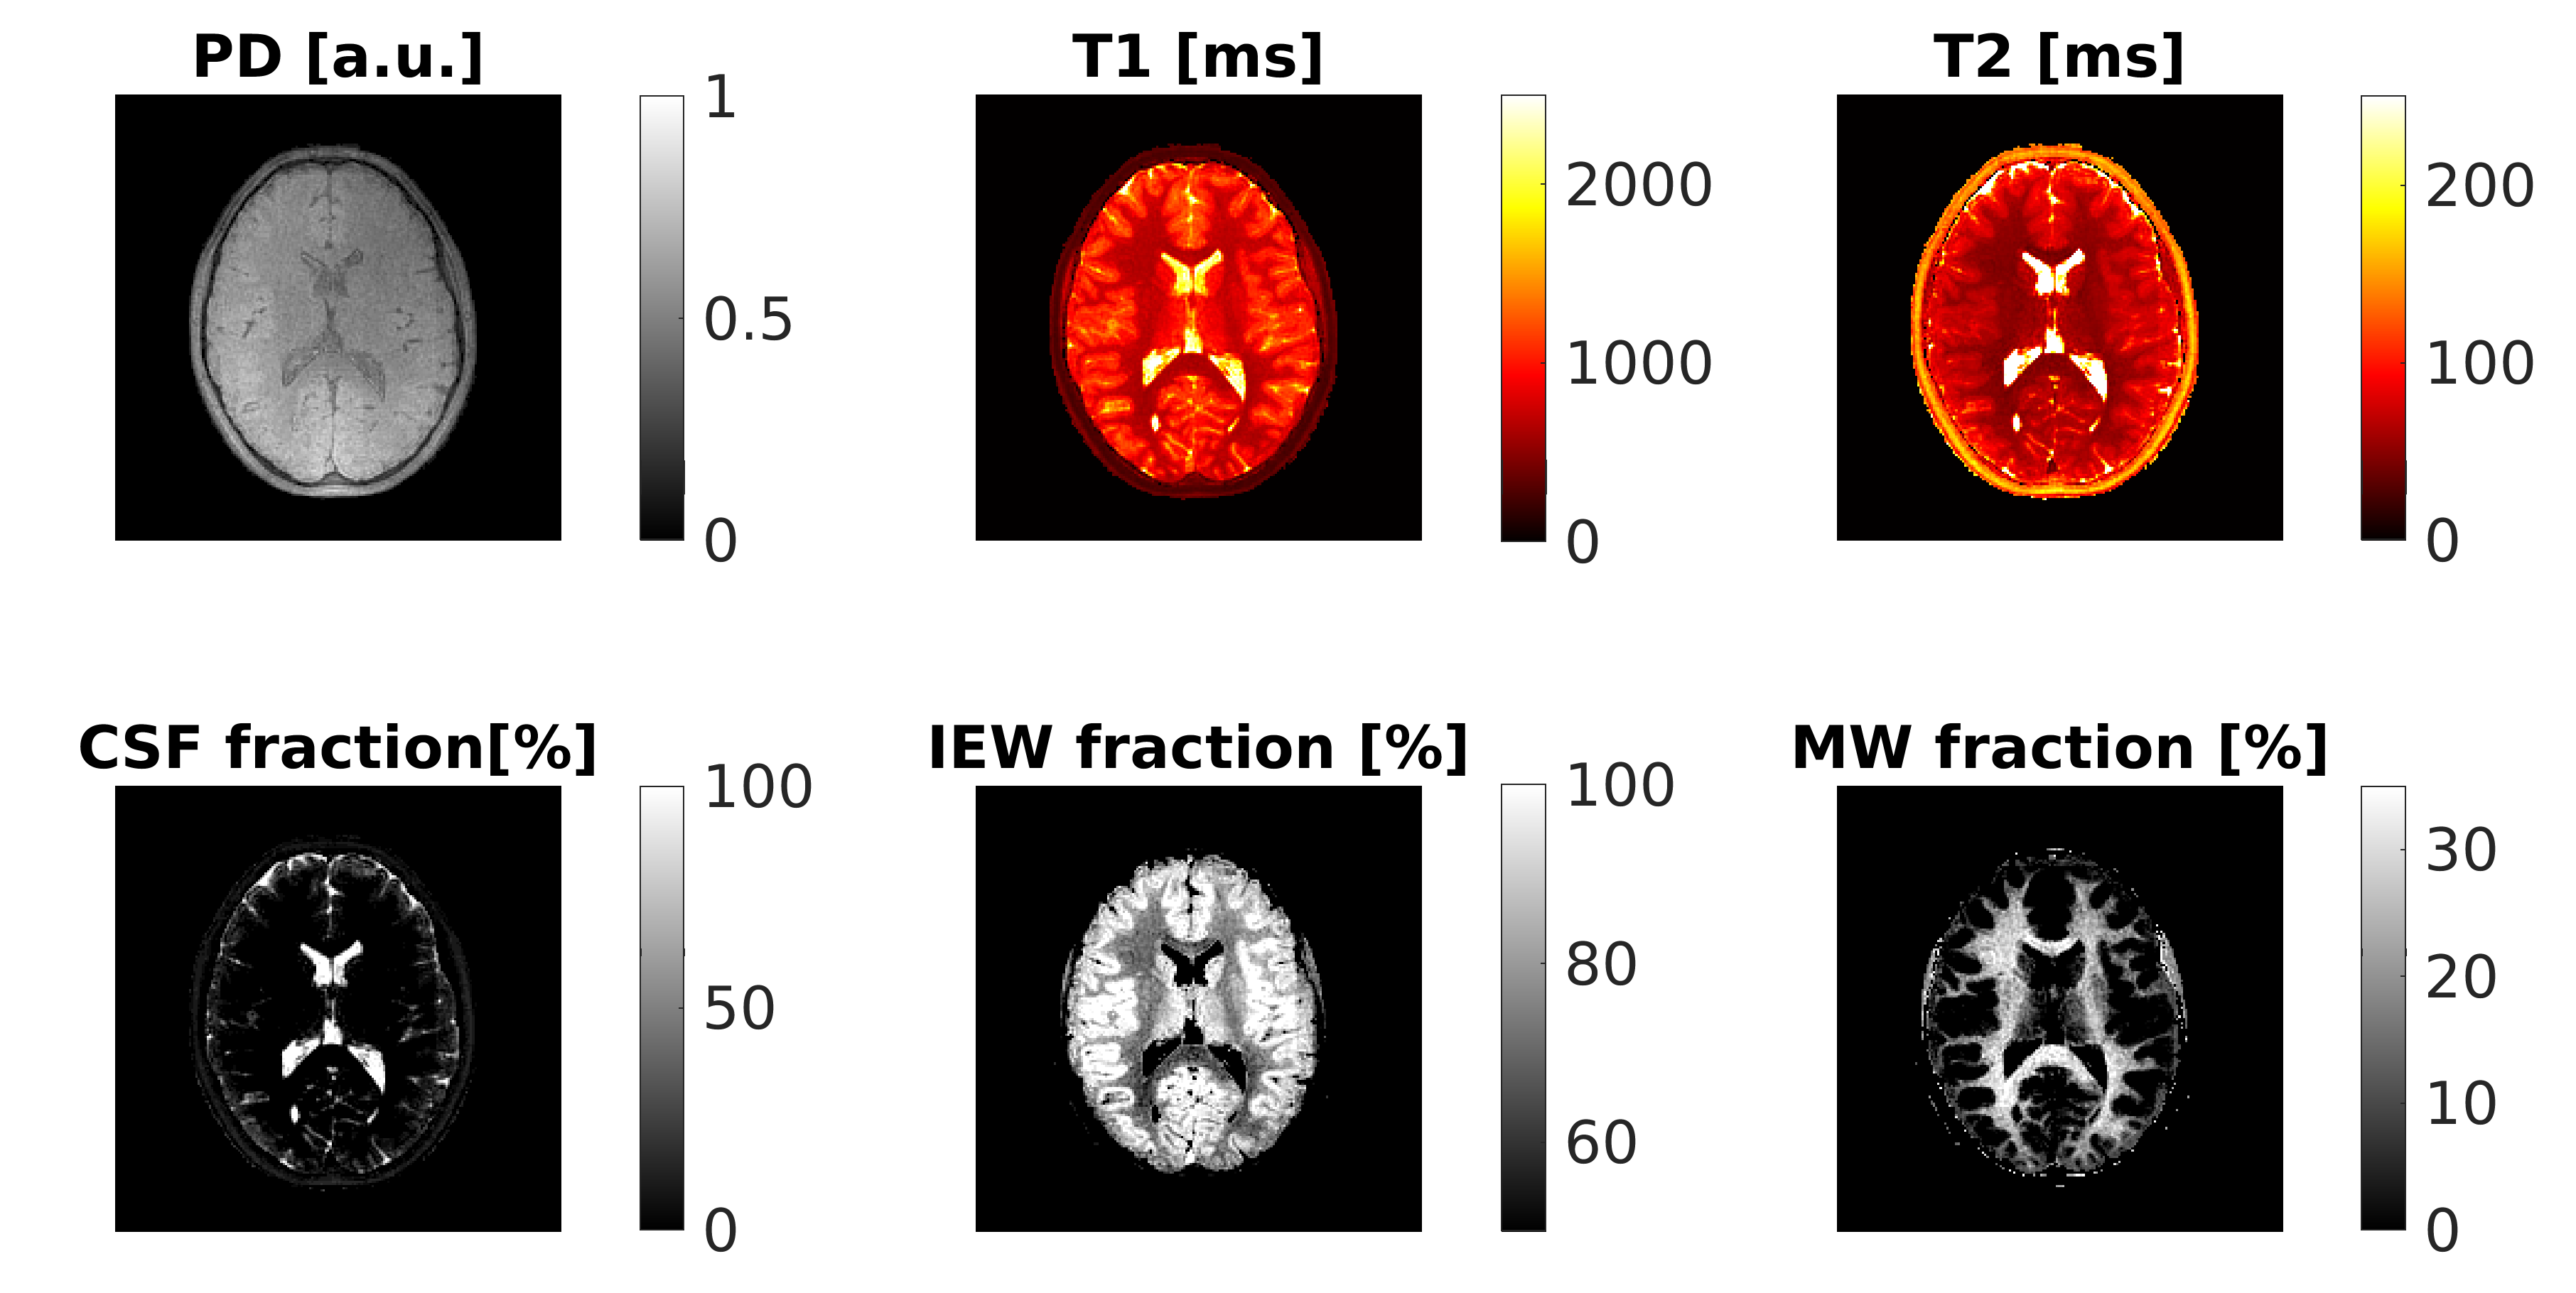
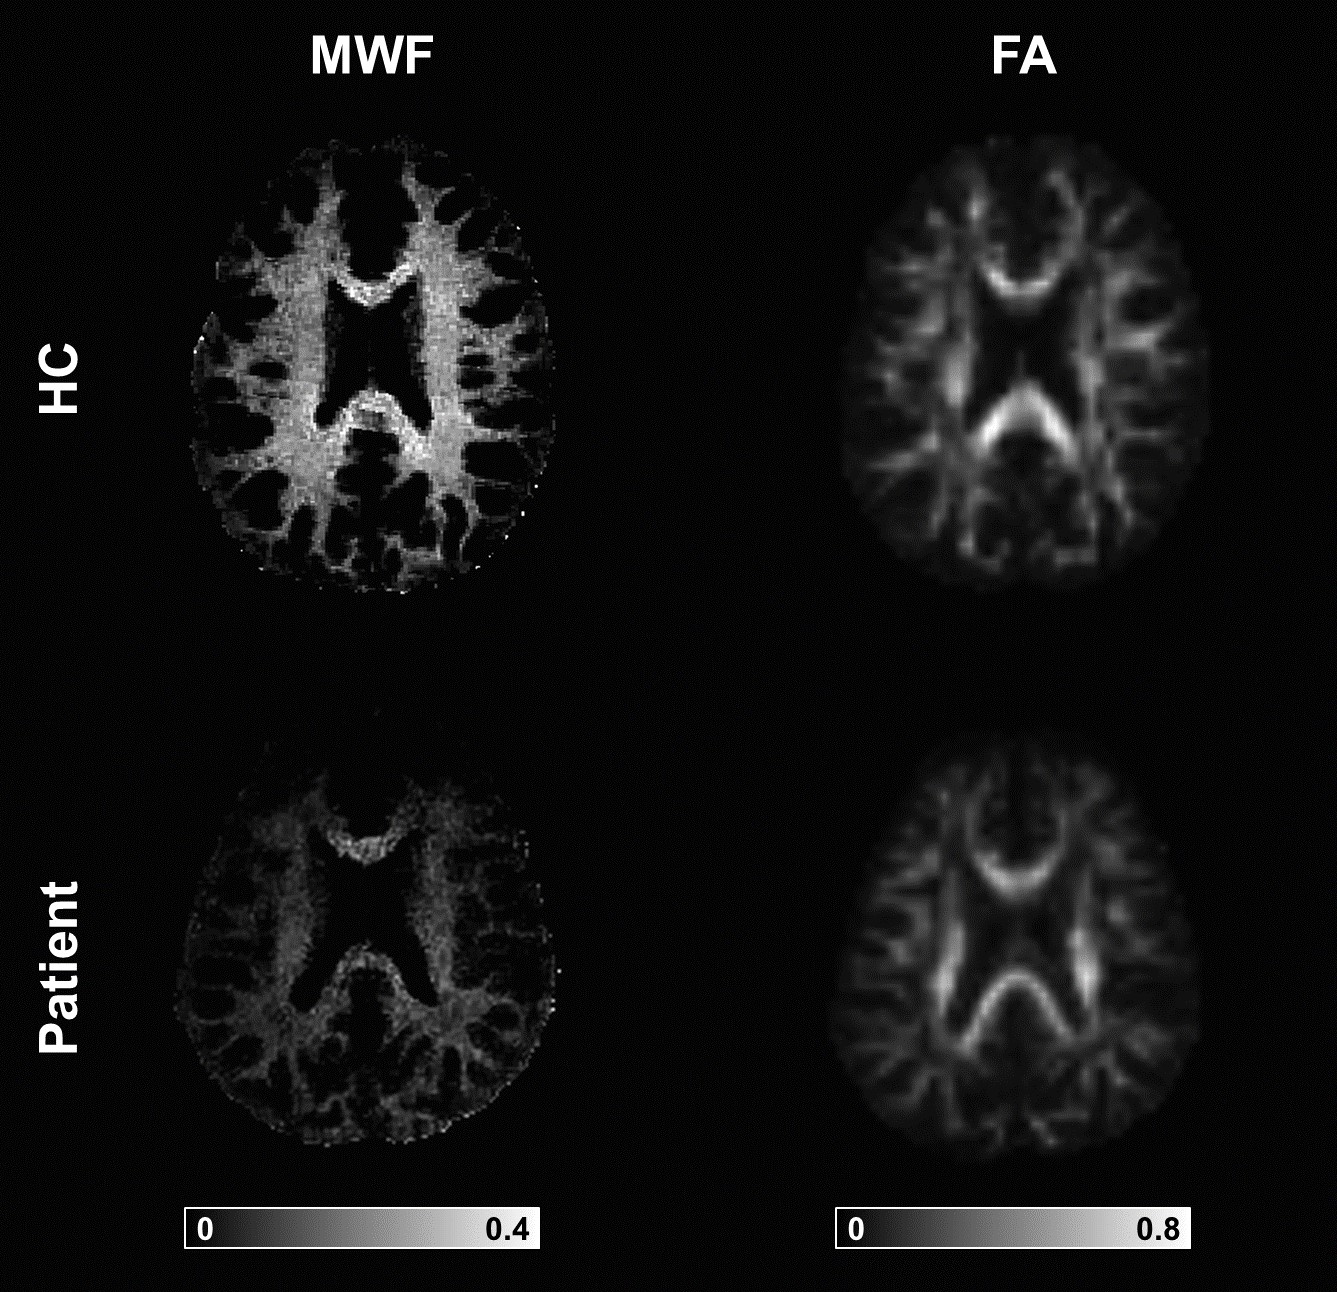
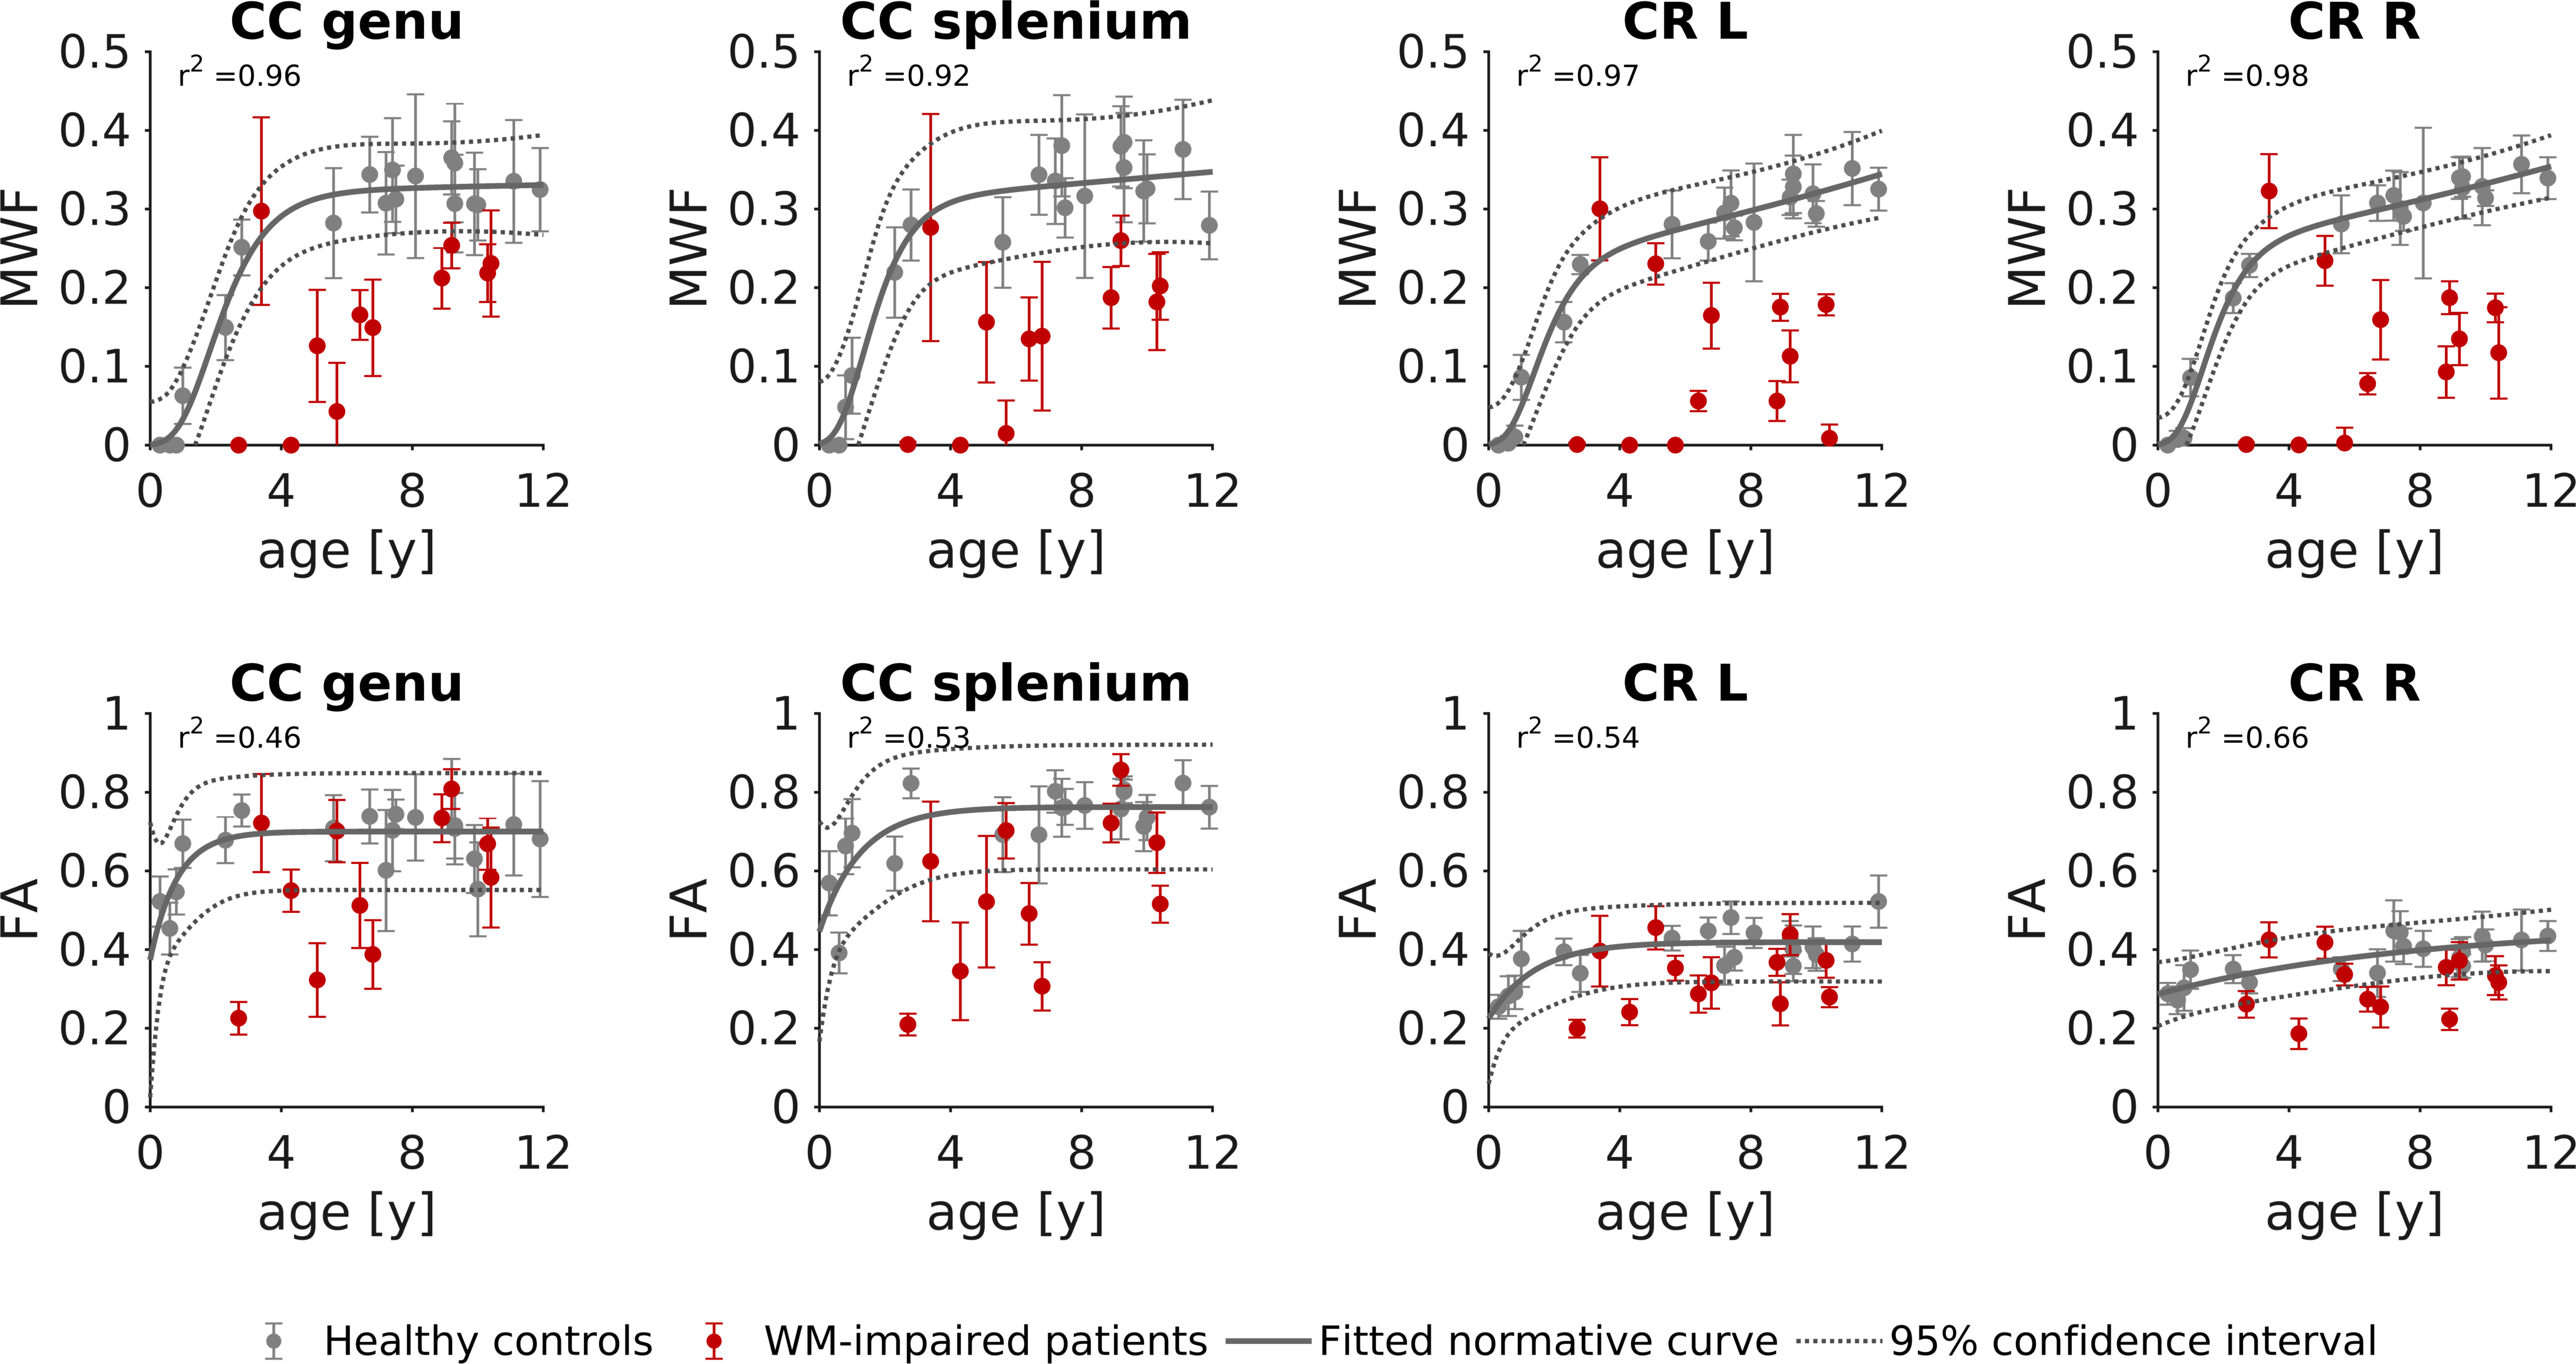
Using the proposed three-component model, MRF-based MWF maps were successfully obtained in addition to T1/T2/PD maps. Maps of a representative subject are shown in Figure 2, while Figure 3 displays MWF and FA maps of a patient and an age-matched control subject. The normative WM maturation curves are shown in Figure 4. The curve obtained via MWF showed a steeper increase during the first 2 years with respect to FA and reaches a plateau around the fourth year for the genu and splenium of CC, while MWF in CR continues growing, though at a slower rate. MWF reaches similar values (∼0.35) in CC and CR while FA in CR is much lower than in CC (∼0.40 and ∼0.75, respectively). Patients with WM disorders show MWF values lying below the normative curve, outside the boundaries of the 95% confidence interval of the fitted curve for both CC and CR in 73% and 82% of cases, respectively. Instead, FA values are comparable to those of control subjects for most patients, showing lower values in 27% and 45% of cases for genu and splenium of CC, respectively, and 33% for CR.Discussion
We derived normative curves of WM maturation using both MWF and FA. MWF shows similar values in WM tracts with different degrees of axonal packing, suggesting that it is independent of the macro-organization of the specific fiber bundle and more myelin-specific than FA. Patients with impaired myelination processes are better distinguished from healthy children by MWF measurement rather than FA, showing strongly reduced MWF with respect to age-matched controls. Hence, MWF shows higher specificity and sensitivity to myelination variation. Future work will focus on increasing the sample size and on studying specific WM lesions to explore the potential of MWF and FA in disentangling different contributions to WM disruption.Conclusion
MRF-based MWF provides a measure of WM maturation capable of revealing age-related differences and of discriminating between control subjects and patients with WM impairment. As it allows the simultaneous acquisition of high-resolution quantitative maps such as T1, T2 and PD, other than MWF, in a scanning time comparable to that of DTI, it may represent a valuable tool in the study of developmental disorders in pediatric populations.Acknowledgements
This study was supported by the Italian Ministry of Health, under the project BIaNCA, Pediatric Network IDEA. This work has been partially supported also by the grant “RC 2018-2020” and “5 per mille” to IRCCS Fondazione Stella Maris, funded by the Italian Ministry of Health.References
1. Lebel C. and Deoni S. The development of brain white matter microstructure. Neuroimage, 2018, 182: 207-218.
2. Jeurissen B., et al. Investigating the prevalence of complex fiber configurations in white matter tissue with diffusion magnetic resonance imaging. Human brain mapping, 2013, 34.11: 2747-2766.
3. Beaulieu C. The biological basis of diffusion anisotropy. In: Diffusion MRI. Academic Press, 2014. p. 155-183.
4. Ma D., et al. Magnetic resonance fingerprinting. Nature, 2013, 495.7440: 187-192.
5. Van der Knaap MS., et al. Diagnosis, prognosis, and treatment of leukodystrophies. The Lancet Neurology, 2019, 18.10: 962-972.
6. Deshmane A., et al. Accurate Synthetic FLAIR Images Using Partial Volume Corrected MR Fingerprinting. Proceedings of the 24th Annual Meeting of ISMRM 2016. https://archive.ismrm.org/2016/1909.html
7. Malik, S., et al. Extended phase graph formalism for systems with magnetization transfer and exchange. Magnetic resonance in medicine, 2018, 80.2: 767-779.
8. Dean DC., et al. Modeling healthy male white matter and myelin development: 3 through 60 months of age. Neuroimage, 2014, 84: 742-752.
9. Paydar A., et al. Diffusional kurtosis imaging of the developing brain. American Journal of Neuroradiology, 2014, 35.4: 808-814.
Figures