0654
Beyond Fractional Anisotropy: A Comparative Study of Myelin Water Fraction and Propagator Anisotropy in the Bonnet Macaque Brain1Biomedical Engineering, University of Arizona, Tucson, AZ, United States, 2Evelyn F. McKnight Brain Institute, University of Arizona, Tucson, AZ, United States, 3Psychology, Neurology and Neuroscience, University of Arizona, Tucson, AZ, United States, 4Psychology and Neurology, University of Arizona, Tucson, AZ, United States
Synopsis
White matter (WM) is commonly studied using the Diffusion Tensor Imaging (DTI) metric Fractional Anisotropy (FA), which has limitations especially in regions where more than one fiber population exists. We compared FA to diffusion techniques (Mean Apparent Propagator (MAP-MRI)) and relaxometry techniques (Myelin Water Fraction (MWF) and Bound Pool Fraction (BPF)) mapping in the normal bonnet macaque brain. The combination of histograms and correlation analysis revealed that MAP-MRI metric, Propagator Anisotropy (PA) and MWF may offer more information about WM than FA alone, while remaining relatively correlated with FA; while BPF did not have strong association with FA or MWF.
Introduction
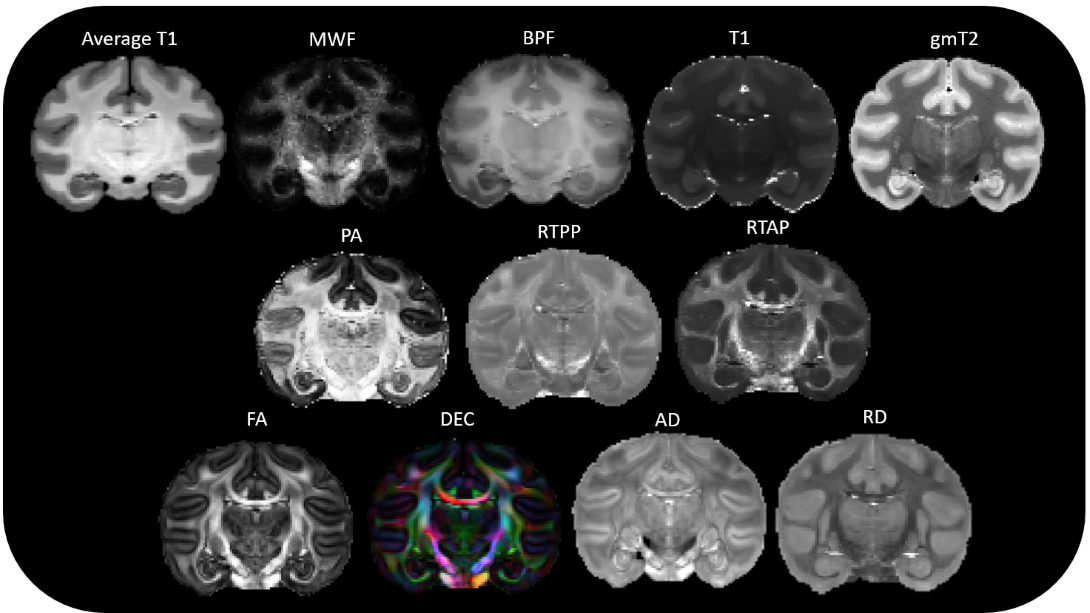
White matter (WM) microstructure is often characterized in health and disease using the diffusion tensor imaging (DTI) metric, fractional anisotropy (FA)1, a ratio metric value that reports preferential water diffusion within a voxel. Conceptually, FA is high in WM voxels containing myelinated axons because water is free to move along the axon but is restricted perpendicular to it. FA can be low in healthy WM regions of the human brain due to the local architecture of fiber bundles (e.g. crossing fibers)2. To address this, more sophisticated diffusion MRI techniques such as Mean Apparent Propagator (MAP-MRI)3 which allows for identifying the presence of multiple fiber populations in the same voxel, alongside relaxometry-based MRI techniques such as myelin water fraction (MWF) mapping4, may improve the specificity of WM imaging for architectural, cellular and molecular features. The objective our study was to better understand the metric relationships between FA and other WM microstructural techniques. To accomplish this, we imaged 12 bonnet macaque brain specimens at high resolution (600 micron isotropic). These specimens were advantageous for the purpose of this study because the bonnet macaque brain WM complexity is similar to that of humans5 having many regions of crossing fibers and large structures to avoid partial volume effects. For microscale anisotropy, we evaluated the MAP-MRI metric of Propagator Anisotropy (PA), and relaxometry data (for MWF and bound pool fraction (BPF) mapping). To compare maps, 1D and 2D histograms a representative brain along with correlation analysis across all specimens was able to show similarities and differences between FA, PA and MWF in the WM.Methods
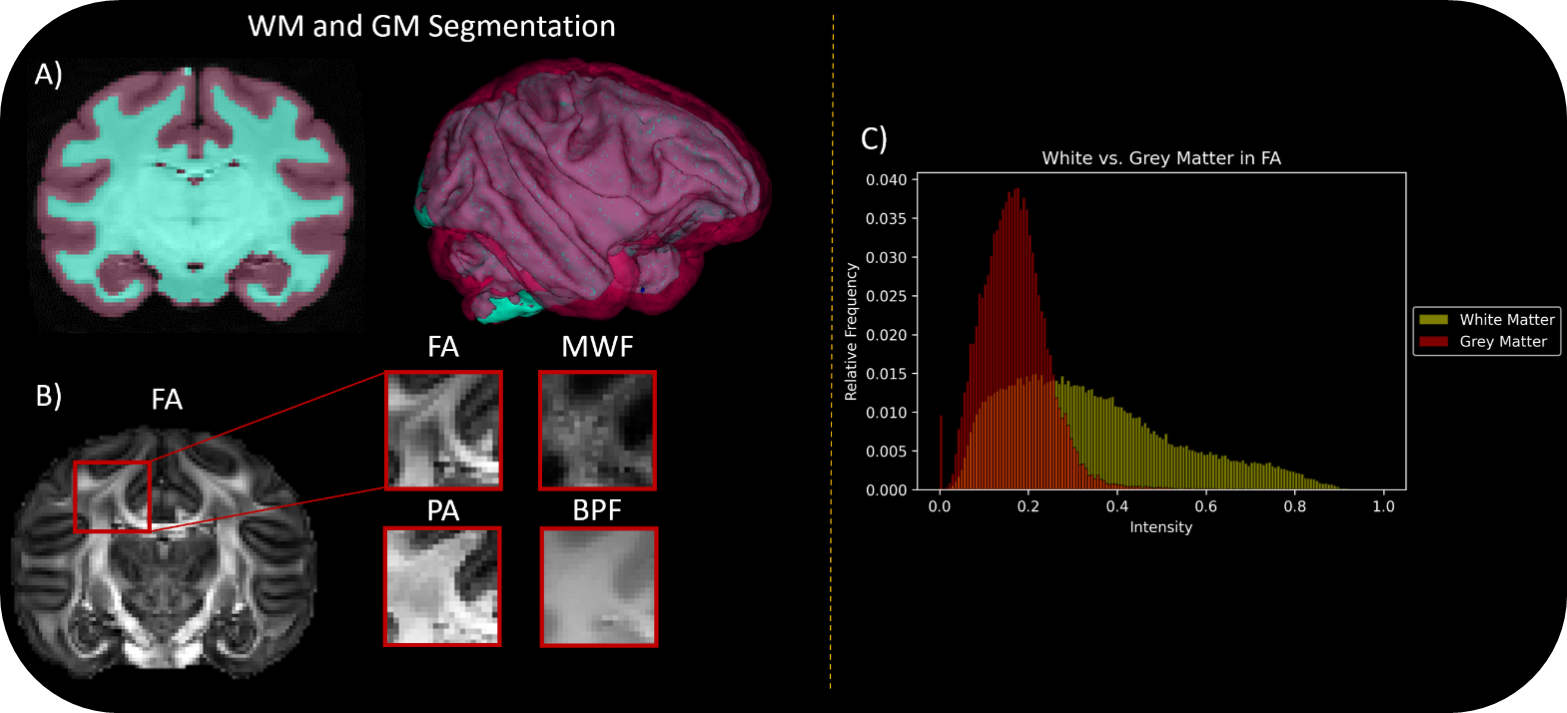
Acquisition was composed of relaxometry and diffusion techniques and were collected on a 7T Bruker pre-clinical scanner using an 86mm quadrature coil. Relaxometry included multiple spin echo (MSE) which had 32 echoes, and selective inversion recovery (SIR), which had 15 inversion recovery volumes. DTI was collected using echo planar imaging (EPI) at a b value of 1500-3000 s/mm2 (60 directions) and 4500 s/mm2 (60 directions). Forward and reverse phase encode sets were obtained to correct for geometric distortion. Processing was conducted on the University of Arizona’s high-performance computing (HPC) clusters. REMMI toolbox6 was utilized to obtain relaxometry maps such as MWF and BPF. For diffusion weighted images (DWIs), TORTOISE7,8,9 was implemented to obtain quantitative diffusion maps such as FA and PA. Automatic segmentation was implemented with ANTs10, to isolate WM and grey matter (GM). T1 weighted images in the SIR scan were used as the input for segmentation to achieve contrast in the two desired tissue types. Of the 12 brains, 3 were excluded due to being fixed in glutaraldehyde which has been previously reported to affect water relaxation and diffusion properties11. 1D and 2D histograms were conducted using a representative specimen from the study to aid in visualization of signal intensity profile for GM and WM for each map. For the 9 specimens in the study, a Spearman ranked correlation was conducted to compare MR metrics.Results
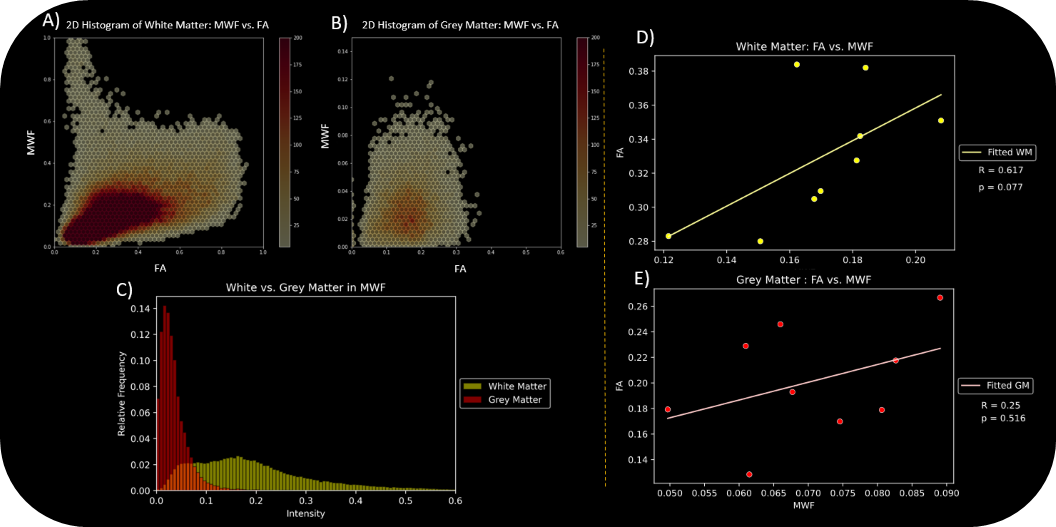
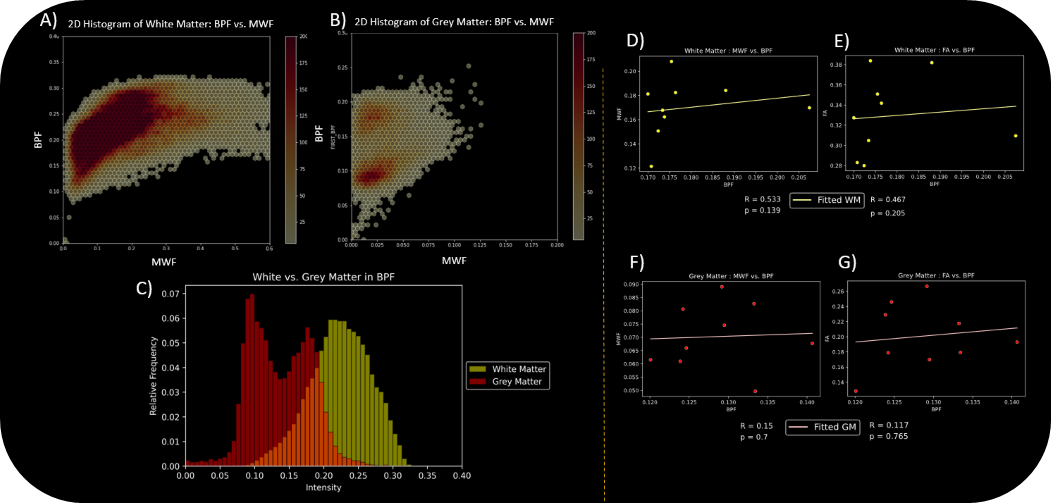
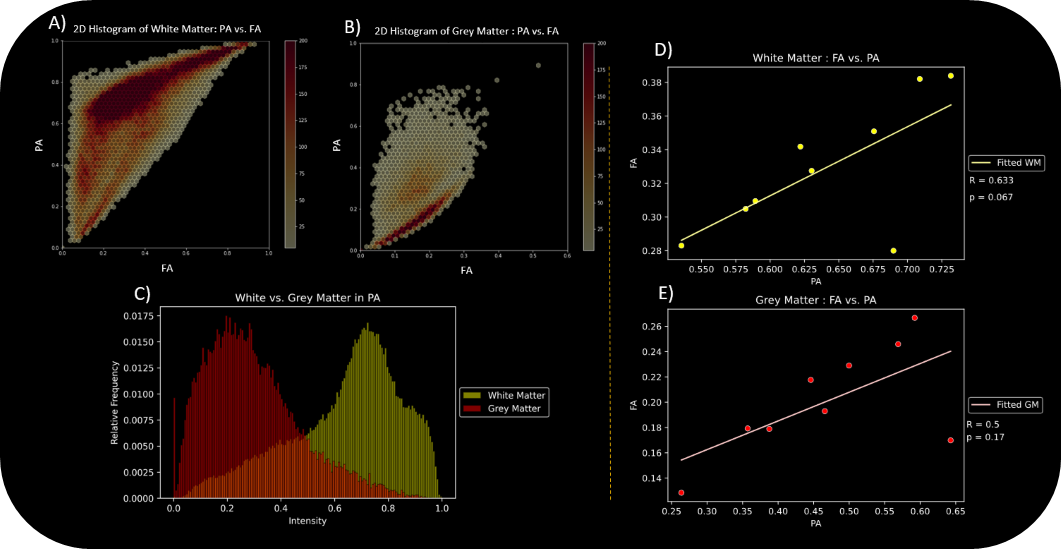
1D histograms for FA and MWF showed a similar pattern, where GM had a distinct peak while WM had a large variation in signal intensity. The 1D histogram for BPF revealed 2 distinct peaks in GM that was not observed in WM. 2D histograms for GM in all metrics appeared to no have a higher number of overlapping voxels of similar signal intensity except for PA and FA at a lower range of values. 2D histograms for WM for all metrics appeared to have a large number of overlapping voxels of similar intensity. Correlation was not significant in FA vs. MWF in WM and GM; however, FA and MWF was more correlated in WM than GM. FA and PA correlations in both tissue types were not significant, however, had a stronger correlation in WM than in GM.Discussion
Several aspects of our findings suggest improved specificity for both PA and MWF as compared with FA in the normal bonnet macaque brain. PA showed less overlap between GM and WM on 1D histograms than FA and two clusters for the two tissue types on joint histograms with FA, which indicates that PA may discriminate between different tissue environments that give rise to the same FA value. There was a prominent relationship between PA and FA within each tissue type. The correlation (although not significant) between PA and FA was higher for WM than GM when comparing mean values across all specimens. MWF demonstrated a strong specificity for the WM with very low values in the GM and a wide range of MWF values in the WM potentially indicating a sensitivity to differences in myelination across the brain. The correlation between MWF and FA was higher (although not significant) for WM than for GM and interestingly MWF was not strongly similar to the BPF metric, which supports the myelin specificity of this metric and more generally macromolecular sensitivity for BPF.Conclusions
PA and MWF appear to provide distinct and complementary microstructural specificity compared to FA. Our study suggests that PA and MWF offer distinct information compared to previously utilized MR metrics and may shed more information on WM microstructure than possible when utilizing purely traditional MR methods.Acknowledgements
All imaging was performed in the UA translational bioimaging resource (TBIR) and made possible by the NIH small instrumentation grant: S10 OD025016. This work was also supported by the State of Arizona, DHS and the McKnight Brain Research Foundation.References
1. Pierpaoli C, Basser PJ. Toward a quantitative assessment of diffusion anisotropy. Magn Reson Med. 1996;36(6):893–906.
2. A. Leow, L. Zhan, et al. White matter integrity measured by fractional anisotropy correlates poorly with actual individual fiber anisotropy. 2009 IEEE International Symposium on Biomedical Imaging: From Nano to Macro, ISBI 2009; 622-625.3.
3. E. Özarslan, C. Koay, T. Shepherd, et. al. Mean apparent propagator (MAP) MRI: a novel diffusion imaging method for mapping tissue microstructure. NeuroImage, 2013; 78:16-32.
4. Does MD. Inferring brain tissue composition and microstructure via MR relaxometry. Vol. 182, NeuroImage. Academic Press Inc.; 2018. p. 136–48.
5. D. Gray and C. Barnes. Experiments in macaque monkeys provide critical insights into age-associated changes in cognitive and sensory function. PNAS, 2019;116(52): 26247-26254.
6. K. Harkins and M. Does. REMMI — Resource for Experimental Magnetic resonance Microstructure Imaging | remmi-toolbox.github.io. https://remmi-toolbox.github.io/.
7. C.Pierpaoli, L.Walker, M.O.Irfanoglu, A.Barnett, P.Basser, L-C. Chang, C.Koay, S.Pajevic, G.Rohde, J.Sarlls, and M. Wu. TORTOISE: an integrated software package for processing of diffusion MRI data. ISMRM 18th annual meeting,Stockholm,Sweden, 2010; #1597.
8. M. O. Irfanoglu, A. Nayak, J. Jenkins, and C. Pierpaoli. TORTOISEv3:Improvements and New Features of the NIH Diffusion MRI Processing Pipeline, ISMRM 25th annual meeting, Honolulu, HI, abstract #35409.
9. M.O. Irfanoglu, P. Modi, A. Nayak, E. B. Hutchinson, J. Sarlls, C. Pierpaoli. DR-BUDDI (Diffeomorphic Registration for Blip-Up blip-Down Diffusion Imaging) method for correcting echo planar imaging distortions, Neuroimage. 2015 Feb 1;106:284-99. doi: 10.1016/j.neuroimage.2014.11.042. Epub 2014 Nov 26.
10. B. Avants, N. Tustison, et. al. An open source multivariate framework for n-tissue segmentation with evaluation on public data. Neuroinformatics, 2011; 9(4): 381-400.
11. T. Shepherd, P. Thelwall, G. Stainisz, et. al. Aldehyde Fixative Solutions Alter the Water Relaxation and Diffusion Properties of Nervous Tissue. Magnetic resonance in medicine : official journal of the Society of Magnetic Resonance in Medicine / Society of Magnetic Resonance in Medicine. 2009; 62(1): 26.
Figures