0653
Myelin Water Imaging Using a New 3D Short TR Adiabatic Inversion Recovery Prepared Short Echo Time (STAIR-STE) Sequence1Radiology, University of California, San Diego, San Diego, CA, United States, 2Pathology, University of California, San Diego, San Diego, CA, United States, 3Veterans Affairs San Diego Healthcare System, San Diego, CA, United States, 4Psychiatry, University of California, San Diego, San Diego, CA, United States, 5Anesthesiology, University of California, San Diego, San Diego, CA, United States
Synopsis
Myelin water imaging (MWI) has been proposed as a myelin-specific technique to quantify water trapped within or tightly bound to myelin bilayers and thus provides an indirect assessment of myelin content and integrity. In this study, we developed and evaluated a novel 3D short TR adiabatic inversion recovery prepared short echo time (STAIR-STE) Cones sequence for robust MWI on a clinical 3T scanner. Our results show that the 3D STAIR-STE Cones sequence robustly suppresses long-T2 intra/extracellular water signals and provides selective volumetric imaging and quantification of myelin water fraction in the whole brain.
Introduction
Myelin damage is a central feature of many neurological diseases such as multiple sclerosis, TBI, and Alzheimer’s disease (1-3). Clinical MRI techniques including T1-weighted gradient-recalled-echo (GRE) and T2-weighted fast-spin-echo (FSE) sequences show high sensitivity to brain abnormalities in patients. However, conventional MRI sequences of this type generally lack specificity for evaluation of the heterogeneous pathologic substrates seen in many diseases of the brain and are often unable to accurately estimate damage in areas outside of focal lesions (4). MWI has been proposed as a more myelin-specific technique to quantify water trapped within, or tightly bound to the myelin bilayers and thus provide indirect assessment of myelin content and integrity (5). However, many studies have shown that the accuracy and robustness of parameter estimation using current multi-component MWI techniques are limited by MRI system imperfections and model complexity (6-14). In this study, we developed and evaluated a novel short TR adiabatic inversion recovery prepared short echo time (STAIR-STE) Cones sequence for MWI and aMWF mapping using a clinical 3T scanner.Methods
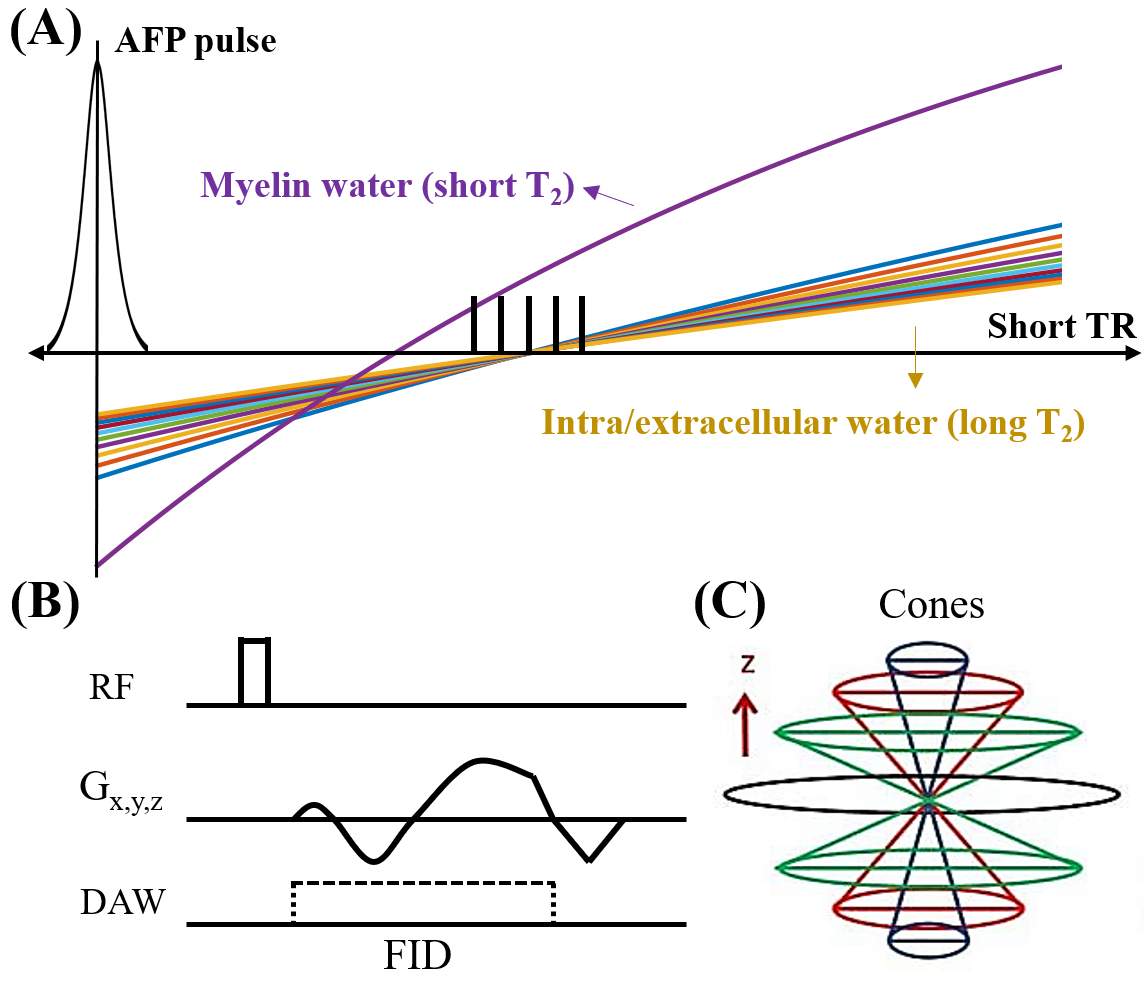
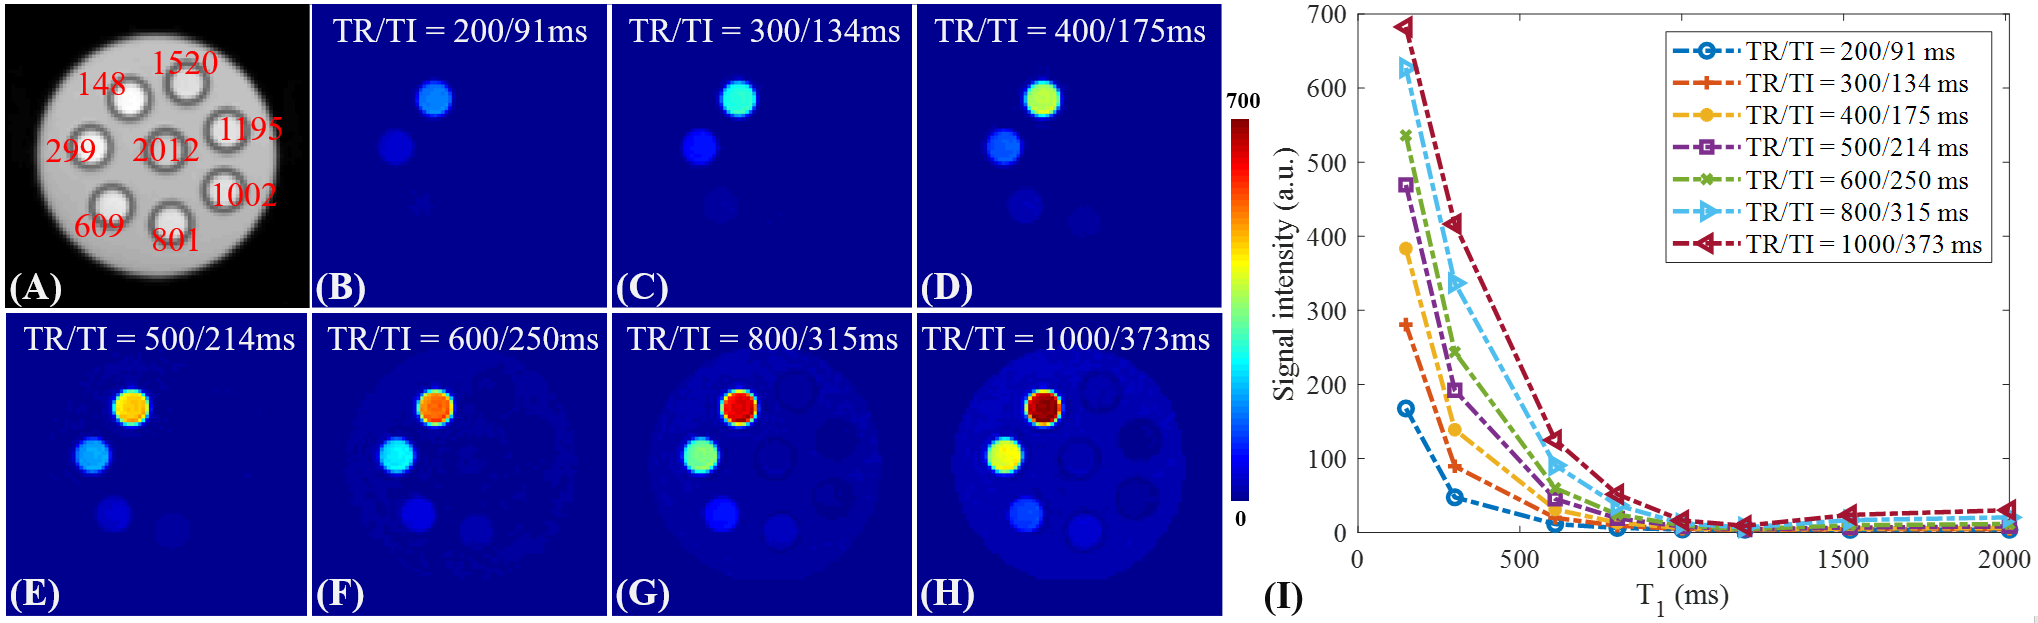
The features of the STAIR-STE Cones sequence are shown in Figure 1. The sequence exploits the short T1 of myelin water rather than its short T2 or T2*, which are the tissue properties employed in multi-component T2 or T2* decay data fitting methods (6,15). Based on numerical simulations, a short TR (e.g., 200-400 ms range) used with the STAIR-STE sequence effectively suppresses signals from long-T2 water components as a consequence of their longer T1s (i.e., 600-2000 ms) (16-19), and preserves shorter T1 myelin water signals (20-22).A phantom consisting of eight 5-mL doped water tubes with different T1s was scanned using a STAIR-STE Cones sequence with TRs ranging from 200 to 1000 ms. The water tubes were doped with manganese (II) chloride tetrahydrate (MnCl2∙4H2O) with concentrations of 0.0055, 0.01, 0.015, 0.0195, 0.0265, 0.0375, 0.085, and 0.18 g/L, respectively. The tubes were placed in parallel orientations within a cylindrical container filled with 1% agarose.
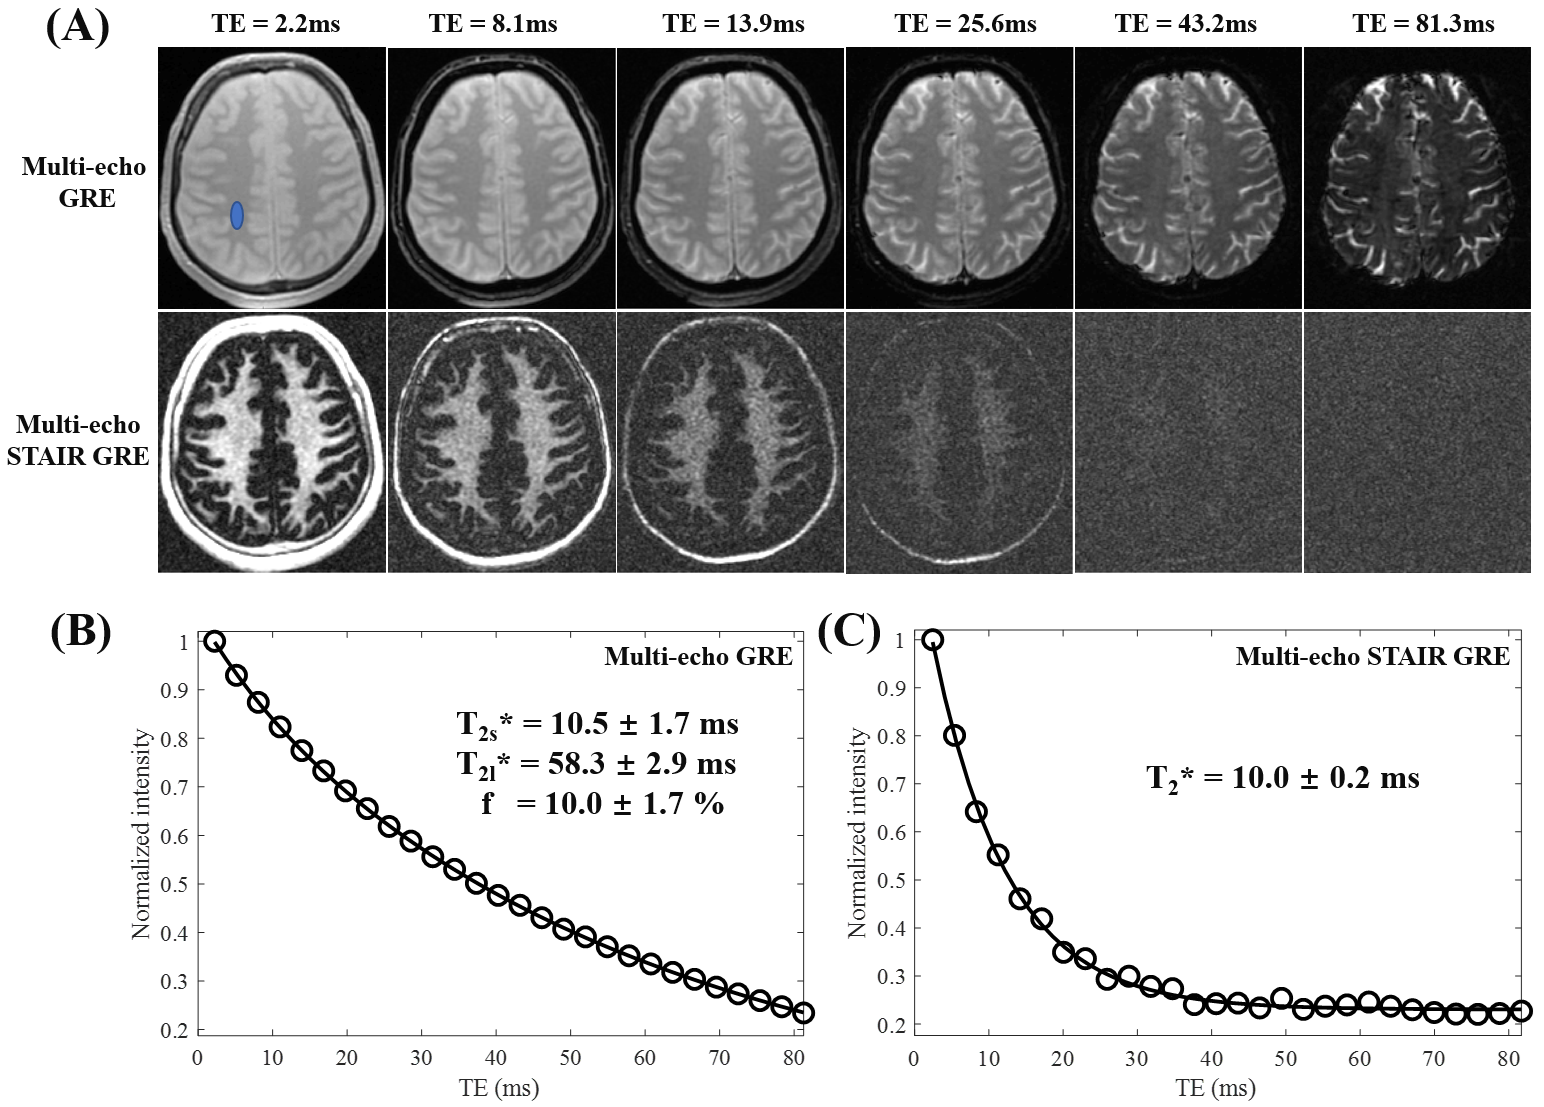
To validate the performance of the STAIR preparation for suppressing long T2 water signals, a 2D multi-echo GRE sequence and a 2D multi-echo STAIR GRE sequence were both implemented and in a study of a healthy volunteer provided bi-component and single-component analyses respectively. Three healthy volunteers and three patients with TBI were scanned with a 3D STAIR-STE Cones sequence to provide whole-brain MWI and aMWF mapping. Informed consent was obtained from all the volunteers and patients in accordance with guidelines issued by the Institutional Review Board. The sequence parameters were as follows: 1) 3D STAIR-STE Cones: field of view (FOV)=22×22×14.4mm3, matrix=160×160×36, TR/TI/TE=250/114/2.0ms, number of spokes per TR=5, flip angle=40º, and total scan time=10min; 2) 3D proton density-weighted STE (PDw-STE) Cones: FOV=22×22×14.4mm3, matrix=160×160×36, TR/TE=7.0/2.0ms, flip angle=1º, and total scan time=1.5min.
aMWF was calculated as the ratio STAIR-STE signals divided by PDw-STE signals after correction for myelin water signal evolution during acquisition of the STAIR-STE and PDW-STE. More details about this can be found in Eq [9] in Ref. 23.
Results and Discussion
Figure 2 reveals that signals from the doped water tubes with long T1 values (i.e., T1≥600 ms) were effectively suppressed when using a short TR (i.e., TR<400 ms). With appropriate selection of TR (e.g., 200-400ms), signals from water tubes with short T1s were well preserved. The doped water phantom results demonstrate that the STAIR-STE Cones sequence can selectively image water with short T1s and simultaneously suppress signals from water with a broad range of longer T1s.Figure 3A shows representative images of multi-echo GRE and multi-echo STAIR GRE sequences from a 39-year-old healthy male. The signals shown with the multi-echo STAIR GRE images decay much faster than those obtained with the multi-echo GRE sequence, demonstrating that long T2 water components are suppressed by the STAIR GRE sequence. Bi-component analysis of the multi-echo GRE data in white matter shows a short T2* of 10.5ms and a long T2* of 58.3ms with the short T2* faction 10.0%. In comparison, only a short T2* component was observed using the multi-echo STAIR GRE images. This had a T2* of 10.0ms which is close to reported T2* values for myelin water (6,24), and is consistent with the detected signals mainly originating from myelin water.
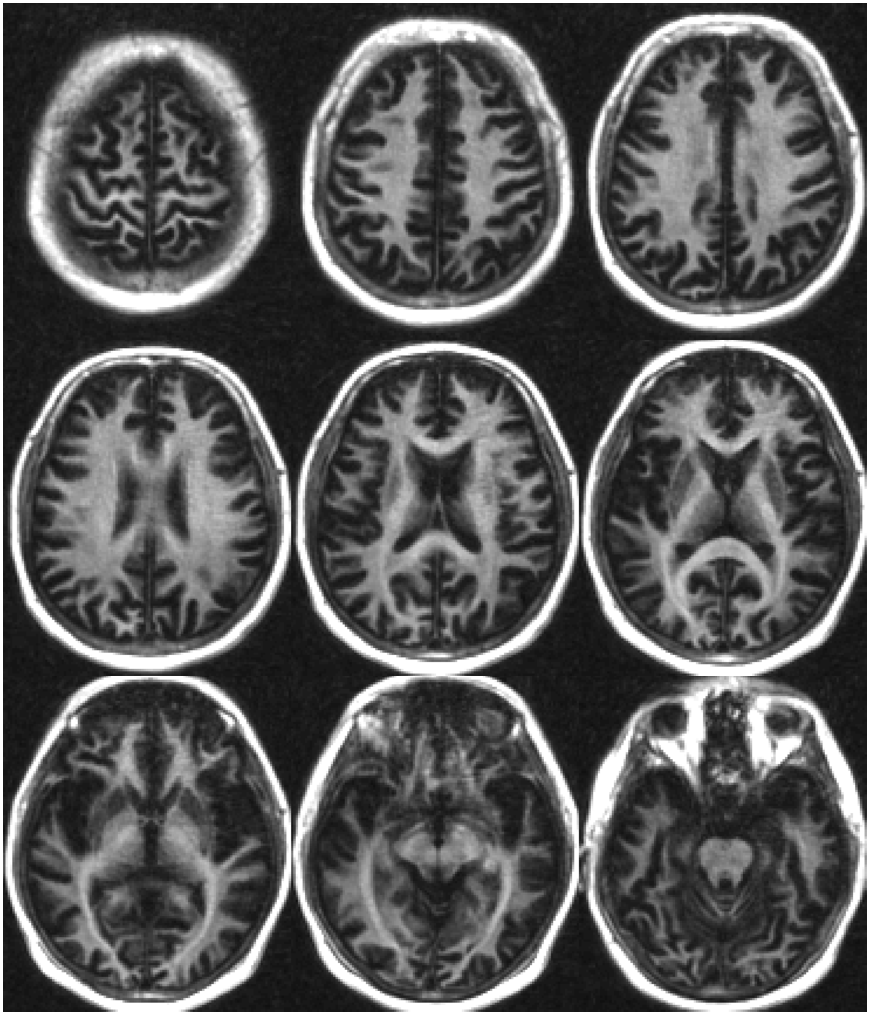
Figure 4 shows representative STAIR-STE Cones images from the same volunteer. High-quality myelin water images were obtained throughout the brain. The STAIR preparation is insensitive to eddy currents as well as B0 and B1 inhomogeneities, potentially making it more robust than multi-component MWI techniques.
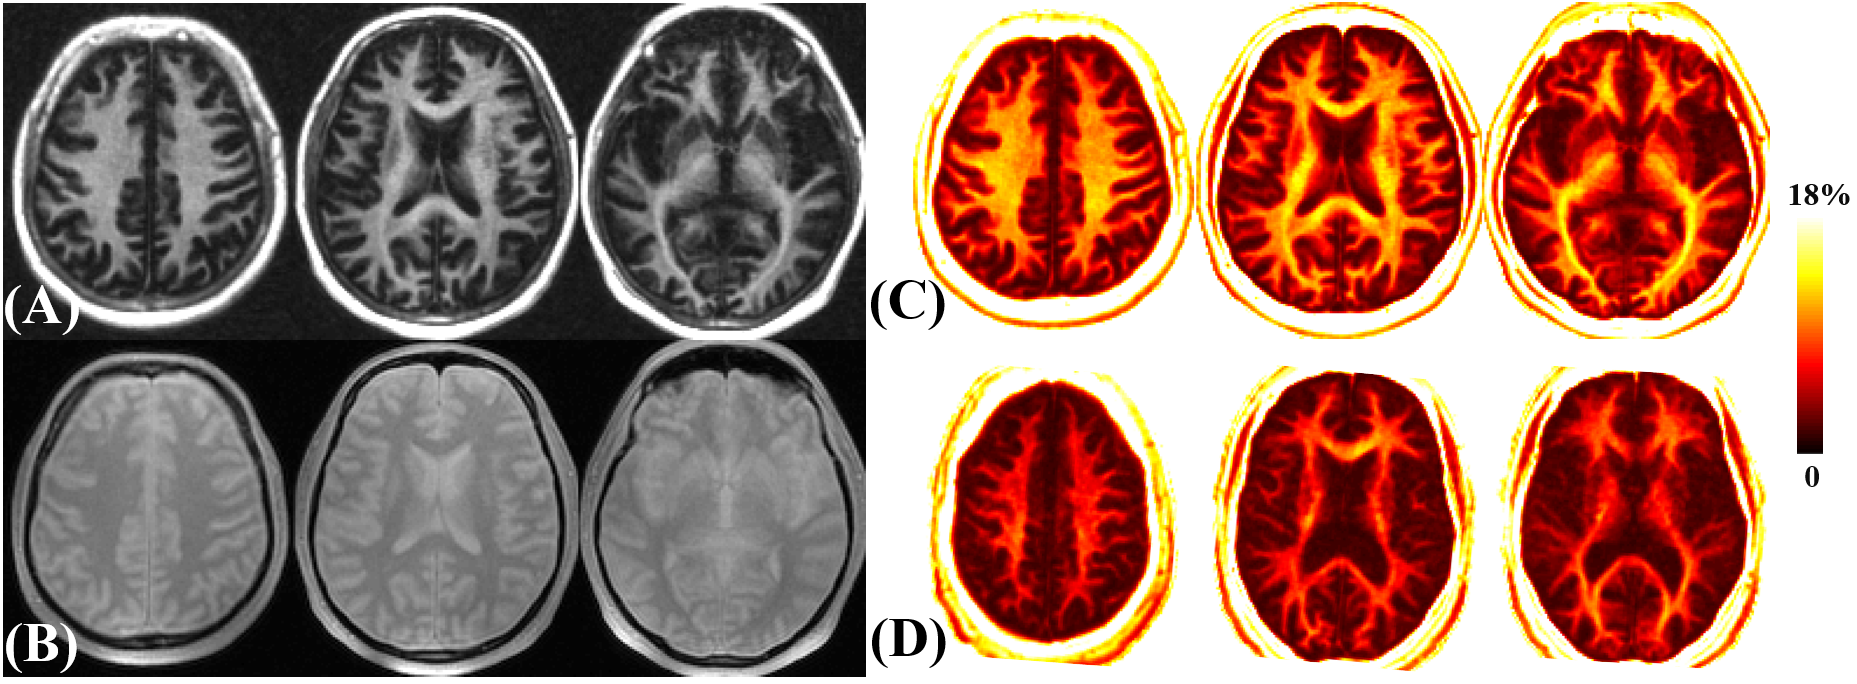
Figure 5 shows 3D aMWF mapping in a 39-year-old healthy volunteer and a 21-year-old mTBI patient (8 years post-injury). There is a reduction in aMWF in the brain of the patient consistent with generalized myelin loss. The STAIR-STE-measured aMWF in white matter was reduced from 12.1±1.9% in the healthy volunteers to 9.6±2.1% in the mTBI patients.
Conclusion
The 3D STAIR-STE Cones sequence robustly suppresses long-T2 intra/extracellular water signals and provides volumetric selective myelin water mapping. mTBI patients showed a lower aMWF in white matter compared with healthy volunteers. This study demonstrates the considerable potential of the STAIR-STE sequence for more specific assessment of myelin loss in diseases of the brain.Acknowledgements
The authors acknowledge grant support from NIH (R21AR075851), VA Clinical Science and Rehabilitation Research and Development Services (Merit Awards I01CX001388, I01RX002604, and I01CX002211), and GE Healthcare.References
1. Noseworthy JH, Lucchinetti C, Rodriguez M, Weinshenker BG. Multiple sclerosis. N Engl J Med 2000;343(13):938–952.
2. Flygt J, Djupsjo A, Lenne F, Marklund N. Myelin loss and oligodendrocyte pathology in white matter tracts following traumatic brain injury in the rat. EJN 2013; 38:2153-2165.
3. Nasrabady SE, Rizvi B, Goldman JE, Brickman AM. White matter changes in Alzheimer’s disease: a focus on myelin and oligodendrocytes. Acta neuropathologica communications. 2018 Dec;6(1):1-0.
4. Brück W, Bitsch A, Kolenda H, Brück Y, Stiefel M, Lassmann H. Inflammatory central nervous system demyelination: correlation of magnetic resonance imaging findings with lesion pathology. Ann Neurol 1997;42(5):783–793.
5. Alonso-Ortiz E, Levesque IR, Pike GB. MRI-based myelin water imaging: A technical review. Magn Reson Med 2015;73(1):70–81.
6. Hwang D, Kim D-H, Du YP. In vivo multi-slice mapping of myelin water content using T2* decay. NeuroImage 2010;52:198–204.
7. Prasloski T, Mädler B, Xiang Q-S, MacKay A, Jones C. Applications of stimulated echo correction to multicomponent T2 analysis. Magn Reson Med 2012;67:1803–1814.
8. Lee D, Lee J, Lee J, Nam Y. Single-scan z-shim method for reducing susceptibility artifacts in gradient echo myelin water imaging. Magn Reson Med 2018;80:1101–1109.
9. Shin H-G, Oh S-H, Fukunaga M, et al. Advances in gradient echo myelin water imaging at 3T and 7T. NeuroImage 2019;188:835–844.
10. Lee J, Choi JY, Shin D, Se-Hong O, Lee J. Exploring generalization capacity of artificial neural network for myelin water imaging. ISMRM 2020;0051.
11. Nam Y, Lee J, Hwang D, Kim D-H. Improved estimation of myelin water fraction using complex model fitting. NeuroImage 2015;116:214–221.
12. Lankford CL, Does MD. On the inherent precision of mcDESPOT. Magn Reson Med 2013;69:127–136.
13. Zhang J, Kolind SH, Laule C, MacKay AL. Comparison of myelin water fraction from multiecho T2 decay curve and steady-state methods. Magn Reson Med 2015;73:223–232.
14. Deoni SC, Matthews L, Kolind SH. One component? Two components? Three? The effect of including a nonexchanging “free” water component in multicomponent driven equilibrium single pulse observation of T1 and T2. Magn Reson Med 2013;70:147–154.
15. Mackay A, Whittall K, Adler J, Li D, Paty D, Graeb D. In vivo visualization of myelin water in brain by magnetic resonance. Magn Reson Med 1994;31:673–677.
16. Suzuki S, Sakai O, Jara H. Combined volumetric T1, T2 and secular-T2 quantitative MRI of the brain: age-related global changes (preliminary results). Magn Reson Imaging 2006;24(7):877–887.
17. Cheng HL, Stikov N, Ghugre NR, Wright GA. Practical medical applications of quantitative MR relaxometry. J Magn Reson Imaging 2012;36(4):805–824.
18. Rooney WD, Johnson G, Li X, et al. Magnetic field and tissue dependencies of human brain longitudinal 1H2O relaxation in vivo. Magn Reson Med 2007;57(2):308–318.
19. Stikov N, Boudreau M, Levesque IR, Tardif CL, Barral JK, Pike GB. On the accuracy of T1 mapping: searching for common ground. Magn Reson Med 2015;73(2):514–522.
20. Deoni SC, Rutt BK, Arun T, Pierpaoli C, Jones DK. Gleaning multicomponent T1 and T2 information from steady‐state imaging data. Magn Reson Med 2008;60(6):1372-87.
21. Oh SH, Bilello M, Schindler M, Markowitz CE, Detre JA, Lee J. Direct visualization of short transverse relaxation time component (ViSTa). Neuroimage 2013;83:485-92.
22. Bouhrara M, Spencer RG. Rapid simultaneous high-resolution mapping of myelin water fraction and relaxation times in human brain using BMCmcDESPOT. Neuroimage 2017;147:800–811.
23. Ma YJ, Jang H, Wei Z, Wu M, Chang EY, Corey-Bloom J, Bydder GM, Du J. Brain ultrashort T2 component imaging using a short TR adiabatic inversion recovery prepared dual-echo ultrashort TE sequence with complex echo subtraction (STAIR-dUTE-ES). J Magn Reson 2021;323:106898.
24. MacKay AL, Laule C. Magnetic resonance of myelin water: an in vivo marker for myelin. Brain plasticity 2016;2(1):71-91.
Figures