0652
A multiclass deep-learning model with realistic data augmentation for improved 7T gray matter/spinal cord segmentation on patients and controls1CRMBM, Aix-Marseille Univ, CNRS, Marseille, France, 2CEMEREM, APHM, CHU Timone, Marseille, France, 3NeuroPoly Lab, Institute of Biomedical Engineering, Polytechnique Montréal, Montreal, QC, Canada, 4MILA, Québec AI Institute, Montreal, QC, Canada, 5iLab-Spine, International Associated Laboratory, Marseille-Montreal, France
Synopsis
Automated methods for WM/GM segmentation in the spinal cord are now largely available. However, these techniques were mostly developed for conventional systems (≤3T) and do not necessarily perform well on 7T MRI data that feature finer details, contrasts, but also different artifacts or signal dropout.
The primary goal of this study was thus to propose a new deep-learning model allowing robust SC/GM multi-class segmentation based on high-resolution 7T T2*-w MR images. The second objective was to highlight the relevance of implementing a realistic hybrid data augmentation strategy to provide better model generalization.
INTRODUCTION
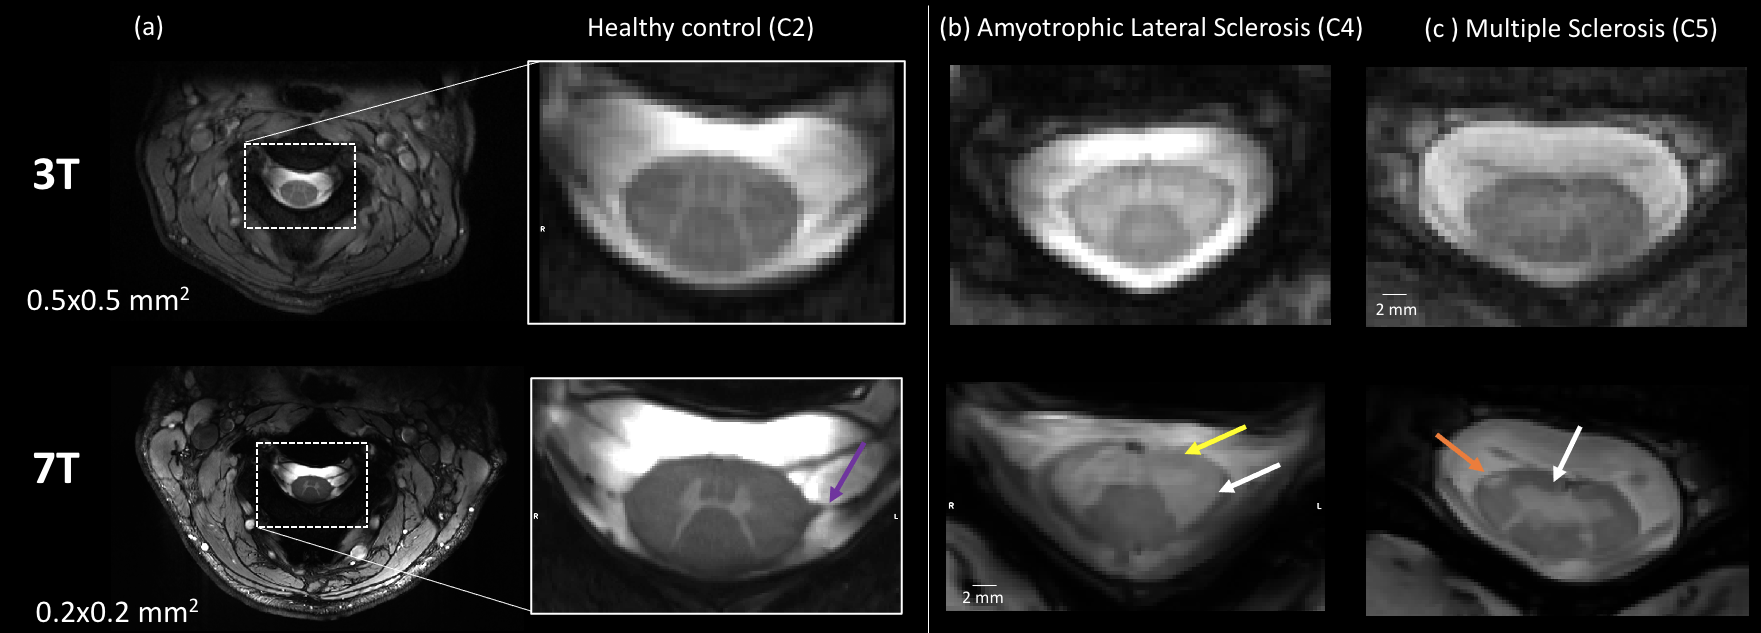
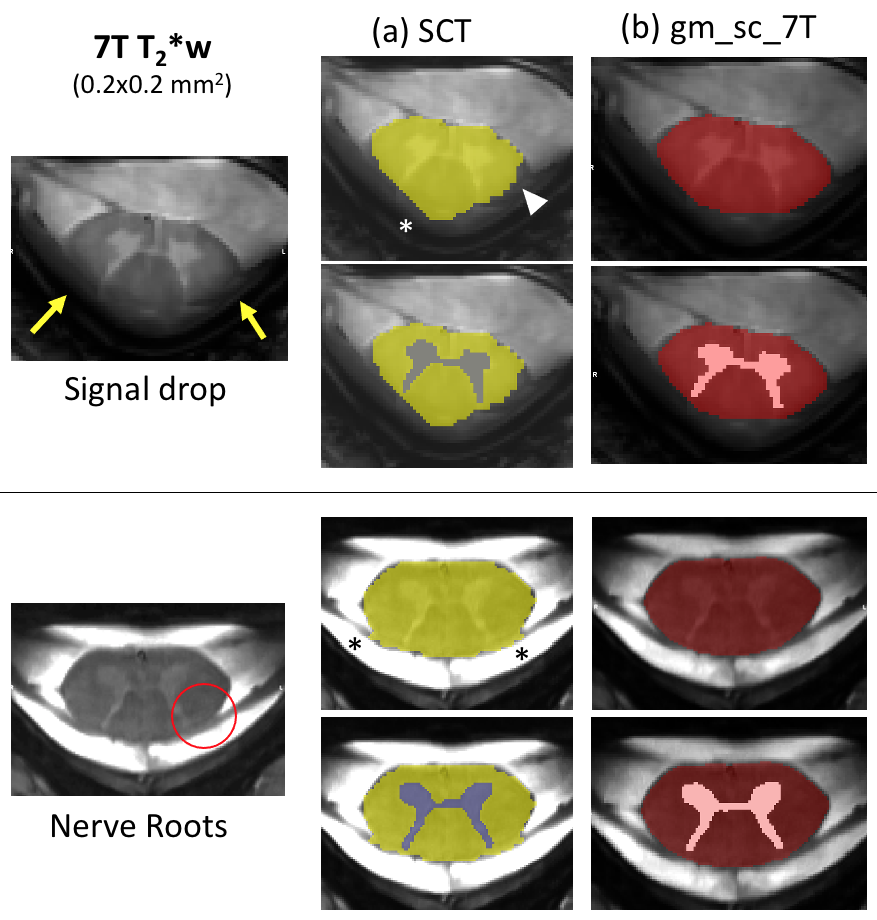
7T MR systems bring new potentialities over conventional MR systems for spinal cord (SC) imaging 1,2 thanks to improved SNR that can be traded for better spatial resolution and increased detection of anatomical and pathological features 3,4,5,6 (cf.fig.1). Although the added value of 7T SC MRI for diagnostic has not yet been fully demonstrated, it highly motivates methodological developments and clinical research applications.In this research context, cord and white matter/gray matter (WM/GM) segmentations are usually an entry point and a requirement for further analyses, for cross-sectional area measurements or for subsequent multimodal registration and ROI analyses. As manual segmentation is time consuming and reproducibility is required, several automated segmentation techniques7, based on gradient-methods8,8', atlases9,9',10, or more recently deep-learning (DL) approaches11,12 have been proposed to the community over the last decade. Most of them have been widely applied and validated in the context of 3T MRI. However, with the emergence of 7T systems, SC images with higher spatial resolution and contrasts are now collected, revealing new details such as nerve roots, and artifacts or signal drop out, that may challenge existing segmentation methods (fig.2a).
Consequently, the main objective of this study was to propose a dedicated approach for 7T SC MRI data segmentation. The approach is based on T2*-weighted images from healthy and pathological subjects, DL and data augmentation to mitigate overfitting during the training while increasing the robustness against artifacts or intrinsic variability of multi-center acquisitions.
MATERIALS AND METHODS
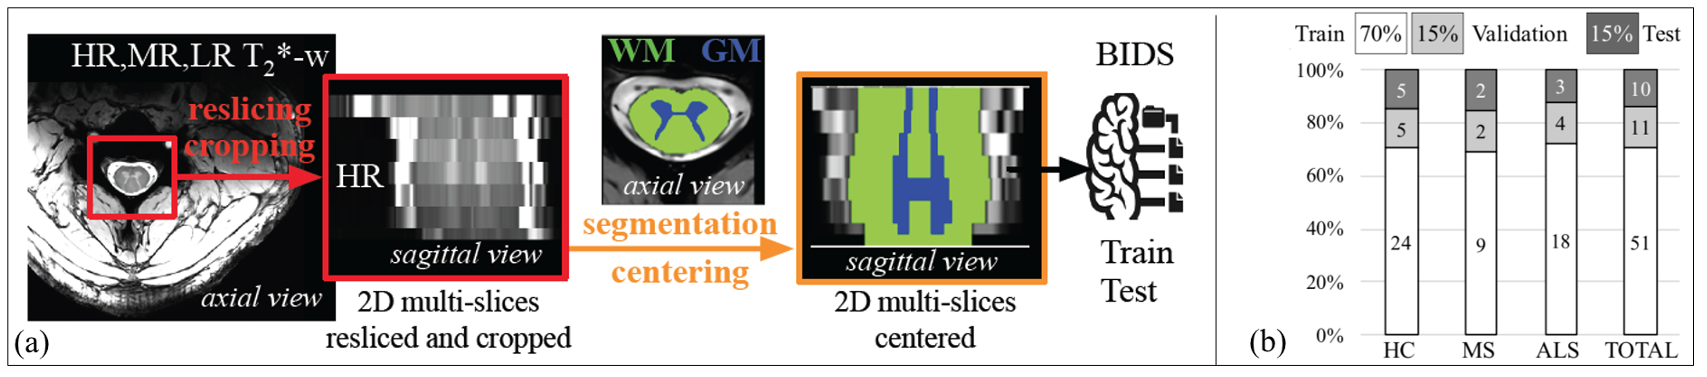
Datasets: A monocentric dataset (DS1) was built using 72 subjects (see fig.3b) scanned using a 7T Magnetom Siemens system and an 8-channel Tx/Rx Rapid Biomedical neck coil. A smaller multicentric dataset (DS2), used to assess the model ability to generalize to new acquisition conditions, was composed of 5 subjects, acquired in 3 different 7T MR scanners/centers (#1 and #3: 7T_Terra, Rapid_Biomedical coil, #2: 7T_Magnetom, home-made volume coil).MR protocol: Images were collected using an axial 2D multi-echo T2*-weighted GRE sequence13. Slices were positioned from C1-to-C7, perpendicular to the cord. High, medium and low-resolution series were acquired depending on time constraint and investigation purpose.
Image processing: High SNR/CNR images were generated by computing the sum of squares of each echo (MEDIC image). SC and GM binary masks were manually segmented for each slice when possible (Ground Truth=GT). A total of 745 slices/994 were included in a BIDS database (fig.3a). The remaining corresponds to data that could not be segmented by the experts (6.4% for SC and 23.4% for GM) mostly due to motion artifacts.
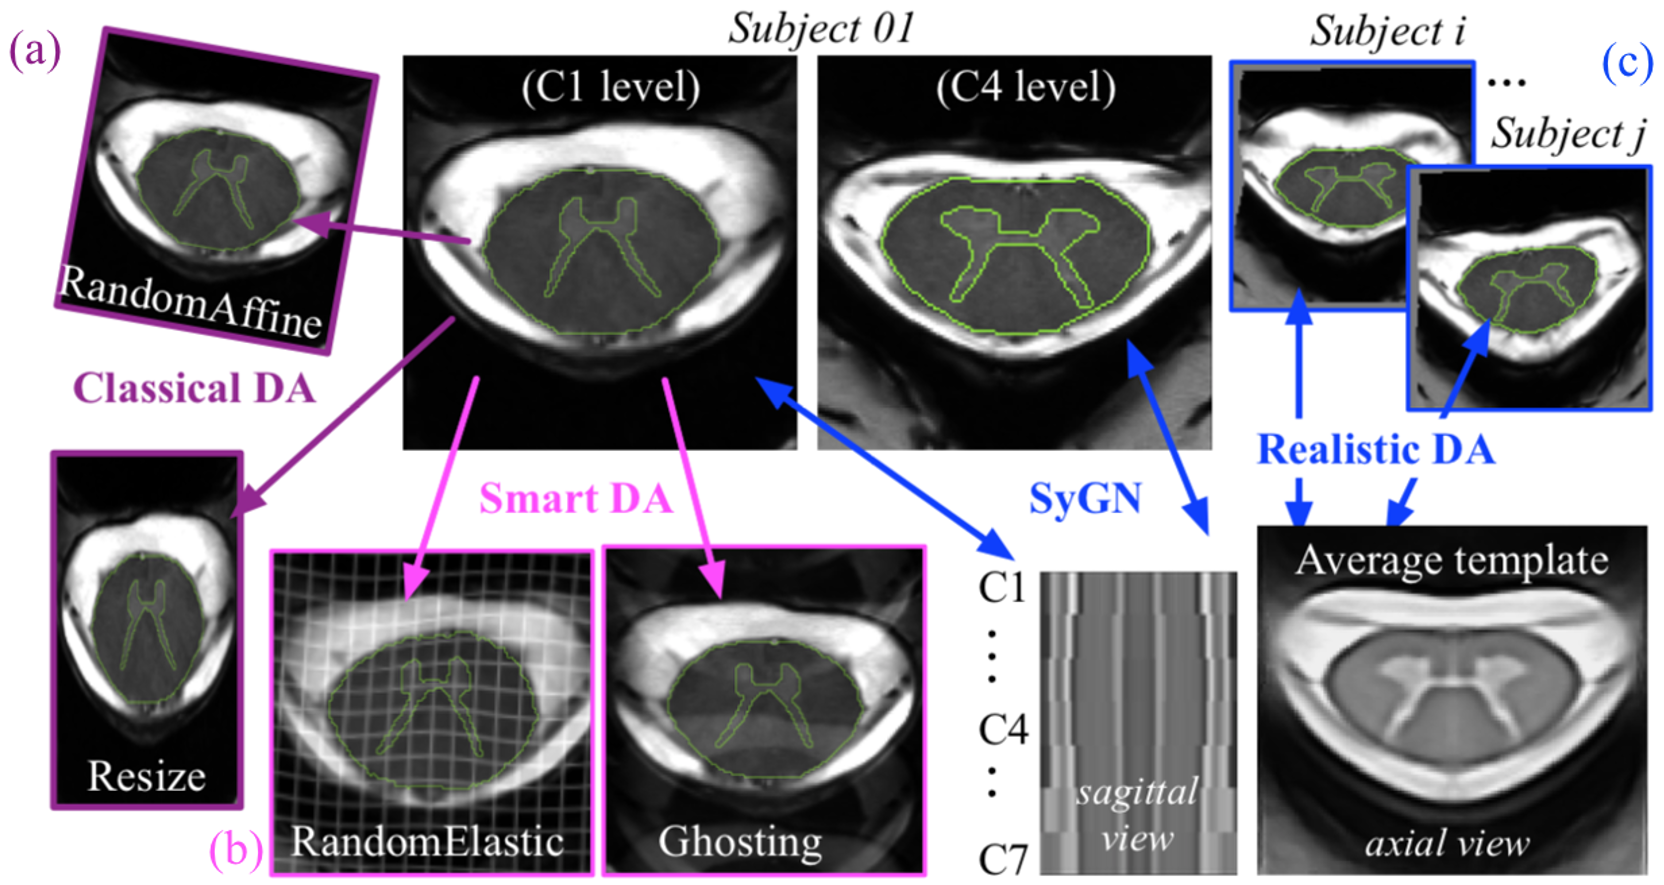
Data augmentation (DA): A new and original approach called "Hybrid_DA", based on a set of realistic geometric transformations ("Realistic_DA"), combined with both "Smart_DA" and "Classical_DA" strategies, was additionally proposed (see details in Fig.4). The Classical_DA (such as random affine or resize transformations) was obtained using the default implementation in ivadomed14. The TorchIO python Library15 was used to generate the set of "Smart" transformations, mimicking MRI-specific effects such as ghosting effect and motion artifacts. An average template was generated to create a reference space in which it was possible to compose several inter-subject deformation fields (Realistic approach). The process more specifically consisted in morphing a slice of the Subject_i into a slice of the Subject_j , thus mixing the contrast of a subject with the anatomy of another subject (and vice versa). For each slice of all N subjects, a set of (N-1) slices with realistic contrasts and correct anatomy were thus generated.
Training and evaluation were performed with the ivadomed toolbox14, using a single model with multi-class segmentation (SC+GM). The dataset DS1 was split into Training, Validation and Test subsets, following a 70/15/15 ratio, as illustrated on fig.3b.
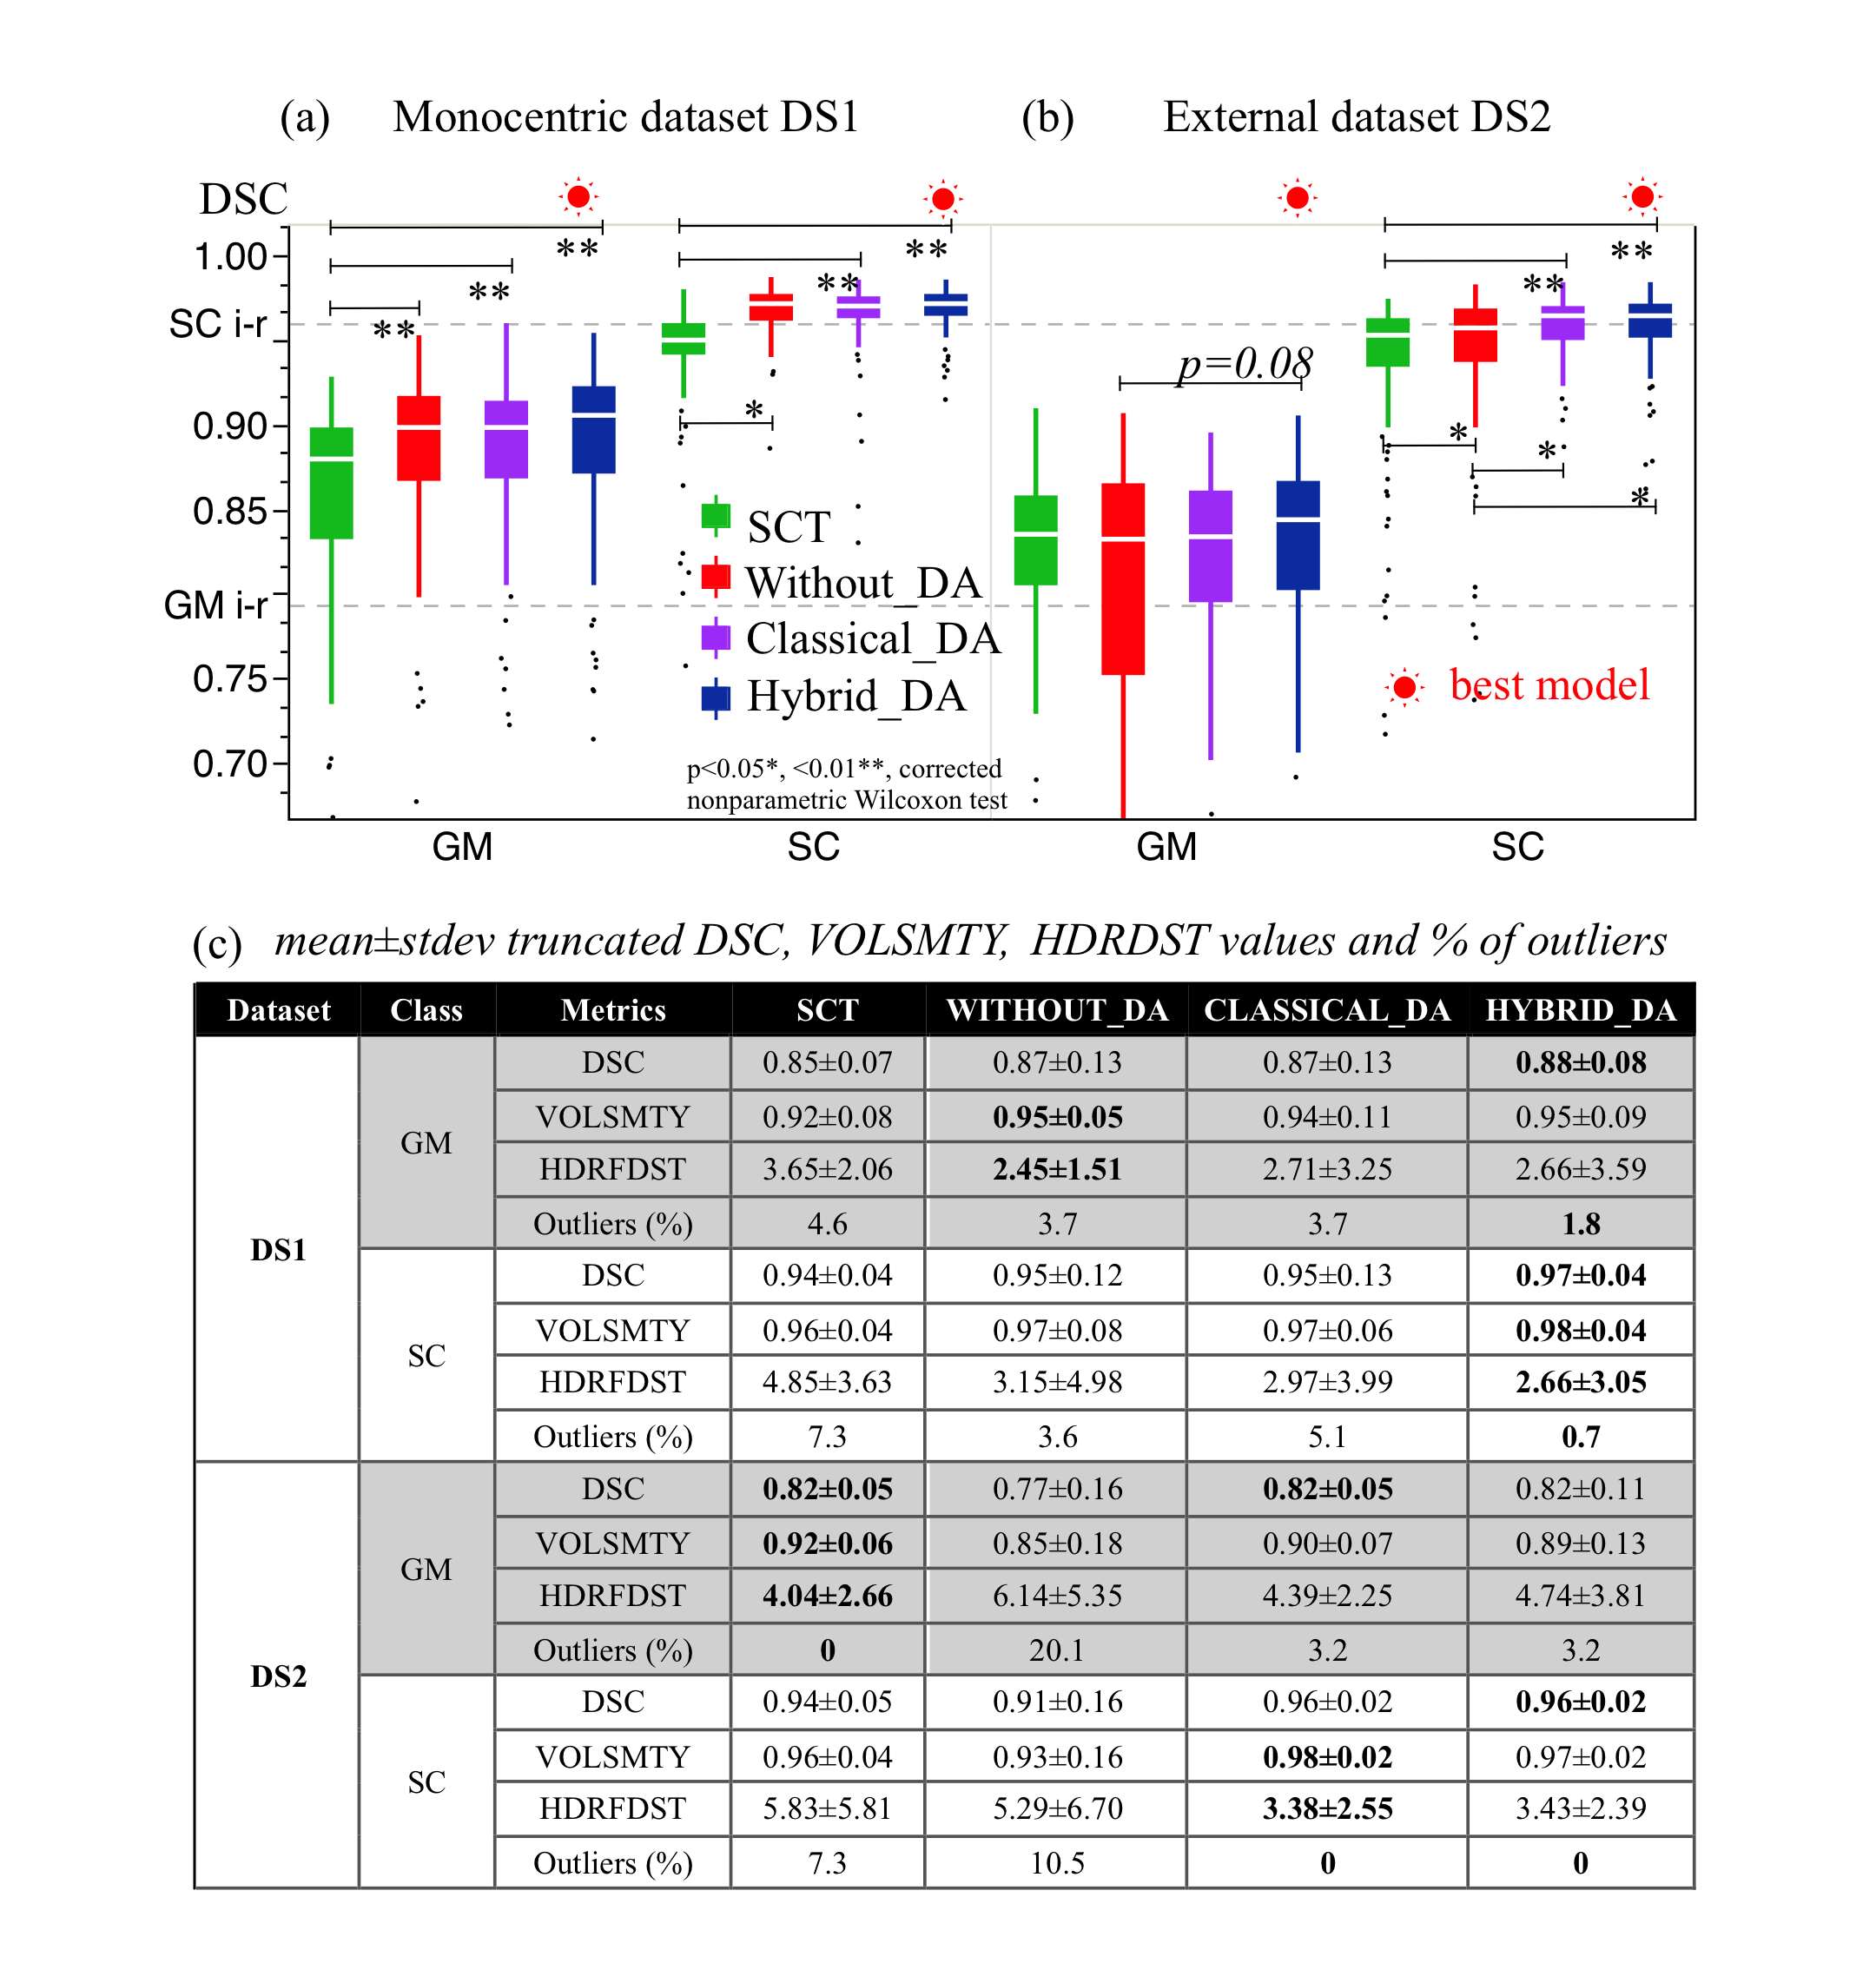
Statistics: The performance of the Hybrid_DA strategy was evaluated on DS1 and DS2 comparing with other DA models and SCT9 GM/SC models run by the functions sct_deepseg_gm11 and sct_deepseg_sc12. Automatic segmentations were compared to manual segmentation (GT) using mean±stdev values of similarity metrics (Dice Similarity Coefficient (DSC), Hausdorff distance (HDRFDST), and Volumetric Similarity (VOLSMTY)). DSC outliers were also quantified considering the 95% confidence intervals for the mean and a 15% of trimming for the calculation of truncated mean values.
RESULTS
Examples of GM/SC segmentations are provided on fig.2b. DSC values and percentages of outliers obtained for both GM and SC classes with the different DA approaches and reference SCT are illustrated on fig.5a and summarized in fig.5b. High similarity metrics and low percentage of outliers were obtained using our hybrid multi-class segmentation. The Without_DA model showed high performance on DS1 (monocentric), but collapsed on multicentric DS2, which reinforces the interest of DA to increase robustness and built a model more generalizable.DISCUSSION/CONCLUSION
This study highlights the interest of training a specific model containing healthy and pathological images at different resolutions and integrating data augmentation, for the segmentation of 7T spinal cord images. It also opens great perspectives for the generation of new templates, Tensor-Based-Morphometry studies, and potentially more robust Cross-Sectional Area measurements.Further testing and applications on external data are now required to fully evaluate the added value of our approach. In that perspective, our model was integrated into the SCT’s sct_deepseg command and made publicly available on the ivadomed github repository19.
Acknowledgements
No acknowledgement found.References
1. Barry, R. L., Vannesjo, S. J., By, S., Gore, J. C. & Smith, S. A. Spinal cord MRI at 7T. NeuroImage 168, 437–451 (2018).
2. Callot, V., Combes, A., Destruel, A. & Smith, S. A. Ultra-High Field Spinal Cord MRI. in Ultra-high field Neuro MRI in press (2022).
3. Cohen-Adad, J., Zhao, W., Wald, L. L. & Oaklander, A. L. 7T MRI of spinal cord injury. Neurology 79, 2217–2217 (2012).
4. Dula, A. N. et al. Magnetic resonance imaging of the cervical spinal cord in multiple sclerosis at 7T. Mult Scler 22, 320–328 (2016).
5. Ouellette, R. et al. 7 T imaging reveals a gradient in spinal cord lesion distribution in multiple sclerosis. Brain 143, 2973–2987 (2020).
6. Callot, V., Massire, A., Guye, M., Attarian, S. & Verschueren, A. Visualization of Gray Matter Atrophy and Anterior Corticospinal Tract Signal Hyperintensity in Amyotrophic Lateral Sclerosis Using 7T MRI. Neurology 96, 1094–1095 (2021).
7. De Leener, B., Taso, M., Cohen-Adad, J. & Callot, V. Segmentation of the human spinal cord. Magma 29, 125–53 (2016).
8. Horsfield, M. et al. Rapid semi-automatic segmentation of the spinal cord from magnetic resonance images: application in multiple sclerosis. Neuroimage 50:446-55 (2010).
8'. De Leener, B. et al. Robust, accurate and fast automatic segmentation of the spinal cord. Neuroimage 98:528-36 (2017).
9. Asman, A. J., Smith, S. A., Reich, D. S. & Landman, B. A. Robust GM/WM segmentation of the spinal cord with iterative non-local statistical fusion. Med Image Comput Comput Assist Interv 16, 759–767 (2013).
9'. Dupont, S. et al. Fully-integrated framework for the segmentation and registration of the spinal cord white and gray matter. Neuroimage 150, 358-372 (2017).
10. Massire, A., Rasoanandrianina, H., Guye, M. & Callot, V. Anterior fissure, central canal, posterior septum and more: New insights into the cervical spinal cord gray and white matter regional organization using T1 mapping at 7T. Neuroimage 205, 116275 (2020).
11. Perone, C. S., Calabrese, E. & Cohen-Adad, J. Spinal cord gray matter segmentation using deep dilated convolutions. Sci Rep 8, 5966 (2018).
12. Gros, C. et al. Automatic segmentation of the spinal cord and intramedullary multiple sclerosis lesions with convolutional neural networks. Neuroimage 184, 901–915 (2019).
13. Massire, A. et al. High-resolution multi-parametric quantitative magnetic resonance imaging of the human cervical spinal cord at 7T. NeuroImage 143, 58–69 (2016).
14. Gros, C. et al. ivadomed: A Medical Imaging Deep Learning Toolbox. Journal of Open Source Software, 6(58), 2868.(2021).
15. Pérez-García, F., Sparks, R. & Ourselin, S. TorchIO: A Python library for efficient loading, preprocessing, augmentation and patch-based sampling of medical images in deep learning. Comput Methods Programs Biomed 208, 106236 (2021).
16. Avants, B. B. et al. The optimal template effect in hippocampus studies of diseased populations. Neuroimage 49, 2457–2466 (2010).
17. Avants, B. B., Duda, J. T., Zhang, H. & Gee, J. C. Multivariate normalization with symmetric diffeomorphisms for multivariate studies. Med Image Comput Comput Assist Interv 10, 359–366 (2007).
18. Avants, B. B. et al. The Insight ToolKit image registration framework. Front Neuroinform 8, 44 (2014).
19. https://github.com/ivadomed/model_seg_gm-wm_t2star_7t_unet3d-multiclass
Figures