0650
Fasciculus Axonal Connective Tissue (FACT) Mapping of Porcine Optic Nerve for Accurate Connectome Mapping at Viable Cost
Sudhir Kumar Pathak1, Yijen L Wu2,3, Vijay Saradhi Gorantla4, Fatih Zor4, Yalcin Kulahci4, Alan Watson5, Yongxin Zhao6, and Walter Schneider1,7
1Psychology, University of Pittsburgh, Pittsburgh, PA, United States, 2Rangos Research Center Animal Imaging Core, Children's Hospital of Pittsburgh of UPMC, Pittsburgh, PA, United States, 3Developmental Biology, School of Medicine, University of Pittsburgh, Pittsburgh, PA, United States, 4Regenerative Medicine, Wake Forest Institute for Regenerative Medicine, Winston-Salem, NC, United States, 5Department of Cell Biology, University of Pittsburgh, Pittsburgh, PA, United States, 6Department of Biological Sciences, Carnegie Mellon University, Pittsburgh, PA, United States, 7Neurosurgery, University of Pittsburgh, 15260, PA, United States
1Psychology, University of Pittsburgh, Pittsburgh, PA, United States, 2Rangos Research Center Animal Imaging Core, Children's Hospital of Pittsburgh of UPMC, Pittsburgh, PA, United States, 3Developmental Biology, School of Medicine, University of Pittsburgh, Pittsburgh, PA, United States, 4Regenerative Medicine, Wake Forest Institute for Regenerative Medicine, Winston-Salem, NC, United States, 5Department of Cell Biology, University of Pittsburgh, Pittsburgh, PA, United States, 6Department of Biological Sciences, Carnegie Mellon University, Pittsburgh, PA, United States, 7Neurosurgery, University of Pittsburgh, 15260, PA, United States
Synopsis
Accurate brain connectome mapping requires tracking fasciculus bundles of axons within tracts. In a porcine optic nerve harvested tissue, we optimized/tested MRI structural and diffusion imaging to demonstrate following fasciculi within the optic tract. On a 7T Bruker magnet, we can clearly identify fasciculus boarders and diffusion paths providing 29 micron precision MRI with clear tissue differentiation. We found that axons travel with no evidence of crossing fasciculi walls. This suggests Fasciculus Axonal Connective Tissue (FACT) imaging can provide full mapping of connectivity between cortical sources supporting comprehensive accurate mapping of connectivity in large mammal tract systems at viable cost.
Introduction
Accurate connectome tract mapping is a yet unachieved goal of imaging of our times. There are multiple technologies for anatomical mapping with dramatically different levels of resolution and cost. Full brain MRI delivers several millimeter resolution with modest accuracy and spatial resolution at a cost in the range $1000 per brain. Electron block EM microscope methods can deliver 10-nanometer resolution but as a cost over $500,000 for centimeters of tissue and cannot trace axons over centimeters of distances. We are developing a Fasciculus Axonal Connective Tissue (FACT) Mapping technology to economically span the whole-brain scale and axon bundle connectivity scale at a viable cost. A pivotal need is to have precise aligned measurements to go from the whole brain to the white matter entry and exit points of the axonal bundle bundles within tracts. We are developing this technology in harvested porcine tissue with multiscale MRI (millimeter to 29 microns) to be complemented with micron fluorescent antibody stain verification of the same tissue1. Within tracts, axons travel changing topology along the tract. In the human and rhesus optic nerve fasciculi move within the tract, split and reorganize in the optic chiasm and reorder to layers of LGN2,3. Large mammals have large fasciculi (0.3-0.7 mm) with connective tissue walls with a thickness of 20-80 microns. Individual axons with (modal diameter 0.8 microns4) cannot be followed with MRI likely for decades. In contrast, fasciculi tracking of bundles of tens of thousands of axons is potentially viably in MRI imaging today at scale (30 microns) in harvested tissue. As a first step towards fasciculus connective tissue mapping, we determined if in the porcine optic tract we could segment the fasciculus connective and axonal tissue and track the diffusion pathway of neighboring fasciculi.Method
A. Samples: Full-grown domestic Yorkshire pigs were euthanized to extract the whole brain along with the eyes, extraocular muscles, extraocular connective tissues, and intact ON tracks. Following the whole-brain imaging, the eye and brain tissues were dissected out to isolate the optic nerve in the fasciculus connective tissue casing. The brains and ON tissues were immersed in Fomblin Y (perfluoropolyether, Sigma-Aldrich Millipore) during imaging to eliminate the susceptibility artifact at the tissue-air interface.B. Anatomical MRI:
- Whole brain: T2WT fast spin-echo MRI was acquired at a preclinical 7-Tesla MRI (Bruker BioSpec USR 70/30) with a 72-mm birdcage coil, with the following parameters: isotropic (156 μm)3 voxel size, TE = 12.347 msec, RARE factor = 8, effective TE = 24.69 msec, and TR = 1500 msec.
- Optic nerve: T2WT high-resolution microimaging of the isolated optic nerve was acquired with the 4-channel mouse brain surface coil with isotropic (29 μm)3 voxel size, TE = 12.347 msec, RARE factor = 8, effective TE = 24.69 msec, and TR = 1500 msec.
- Whole brain: Diffusion MRI was acquired with 32 directions, diffusion gradient duration = 4 msec, diffusion gradient separation = 8 msec, b=1200 s/mm2, in-plane resolution = 234 μm, TE = 16.665 msec, TR = 2750 msec.
- Optic chiasm: Multi-shell diffusion MRI was acquired with a 0.5 mm3 isotropic voxel size, stimulated echo diffusion preparation, diffusion gradient duration = 2 msec, diffusion gradient separation = 50 msec, with the following diffusion conditions - Shell 1: 64 diffusion direction, b=3000 s/mm2; Shell 2: 128 diffusion directions, b=5000 s/mm2.
- Optic nerve: Diffusion MRI was acquired with 32 directions, diffusion gradient duration = 4 msec, diffusion gradient separation = 8 msec, b=1200 s/mm2, isotropic resolution of 100 μm, TE = 16.665 msec, TR = 1000 msec.
Results
Fig1 shows anatomical T2WT MRI (Fig.1 A&B) and diffusion tractography (Fig.1C-F) of a porcine brain. The white matter and gray matter exhibited general integrity, indicating good tissue preservation. White matter tracks are preserved well. Fig.1D-F showed 3 planes through chiasm. The optic nerves displayed different orientations at different depths inside the chiasm. MRI of the dissected optic system (Fig.2) has successfully captured optic nerve bundles through optic chiasm and entering LGN (Fig.2B). Once entered LGN (Fig.2C), the optic nerve projections fan out to form a topological organization (Fig. 2 D&E) longitudinally (Fig.2D) and transaxially (Fig.2E). Fig3 A&B shows high-resolution T2WT structural images of the optic nerve with clear trackable fasciculi boundaries. Fig3 CD shows segmented fasciculi of about 0.3–0.7 mm in diameter providing a tube for an estimated 35,000–192,000 axons traveling as an MRI tractable bundle. Fig4 shows diffusion imaging of the parallel traveling fasciculi.Conclusion
Our MRI study showed that the axons do not cross individually but rather travel in fasciculi segmented tubes moving within the tract that interdigitates and slips between each other without axon crossings. We are doing selected micron confocal microscope histology1 of selected millimeter segments of the fasciculi MRI imaged paths to verify preserved axon counts and lack of crossings FACT imaging of tract holds the potential for full mapping of each axon path from eye to LGN at viable cost on existing animal scanners.Acknowledgements
No acknowledgement found.References
- Watson, A.M., et al., Ribbon scanning confocal for high-speed high-resolution volume imaging of brain. PLoS One, 2017. 12(7): p. e0180486
- Naito, J, 1996, Morphological and quantitative analysis of the fascicular pattern of monkey optic nerve. Cell & Tissue Research 283;255-261
- Malpeli, J.G., D. Lee, and F.H. Baker, Laminar and retinotopic organization of the macaque lateral geniculate nucleus: Magnocellular and parvocellular magnification functions. Journal of Comparative Neurology, 1996. 375(3): p. 363-377.
- Innocenti, G.M., A. Vercelli, and R. Caminiti, The Diameter of Cortical Axons Depends Both on the Area of Origin and Target. Cerebral Cortex, 2014. 24(8): p. 2178-2188
Figures
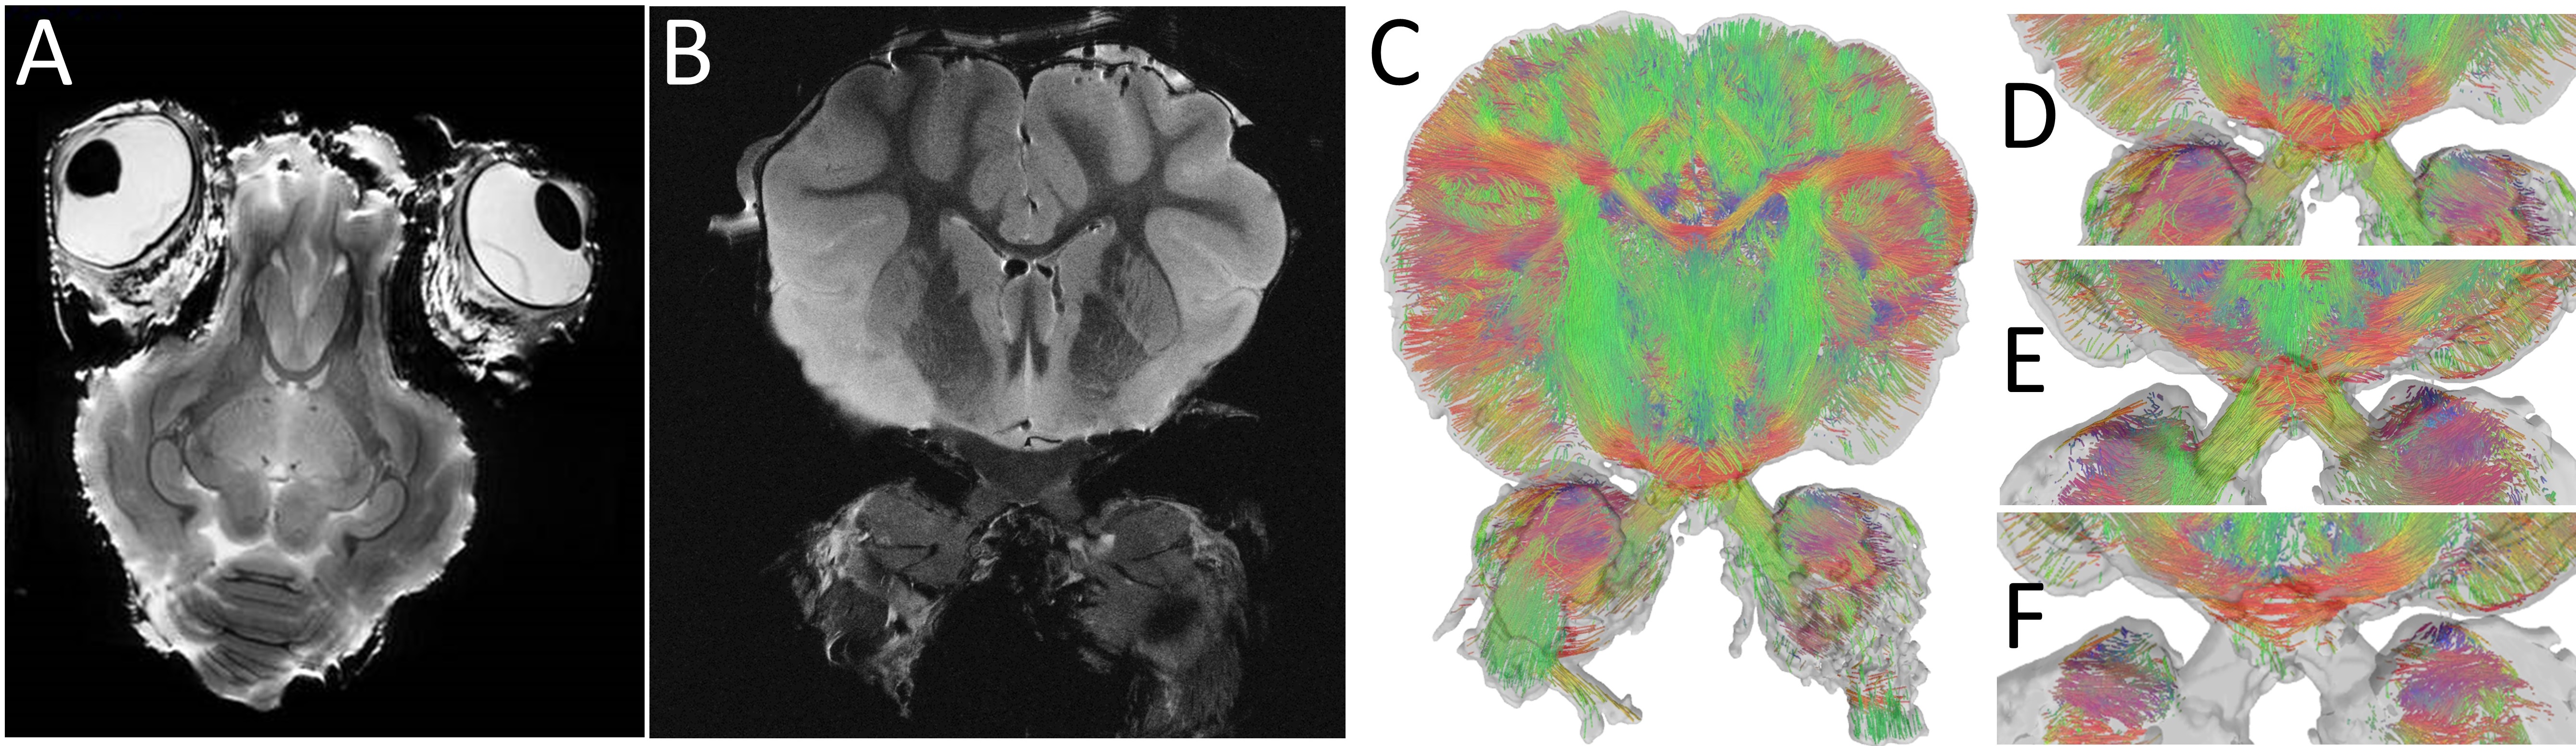
Whole-brain MRI. T2WT MRI (A, B) and diffusion tractography (C-F) of porcine brains. (A, B) 3D T2WT RARE imaging. (C-F) diffusion tractography through the optic chiasm with 32 directions, b=1200 s/mm2. (D-F) Three planes through different depths inside the chiasm.

MRI of LGN (A) Corresponding orientation of the sample placement indicating positions of LGN, optic chiasm, optic nerves, and eyeballs in the imaging coil. (B) MRI of LGN, optic chiasm, and optic nerves. (C) Optic nerves entering LGN, (D) Neuronal projections in LGN indicated by white arrowheads (E) Cross-sections of the nerve projections in LGN, showing the topological organization of the optic projections.
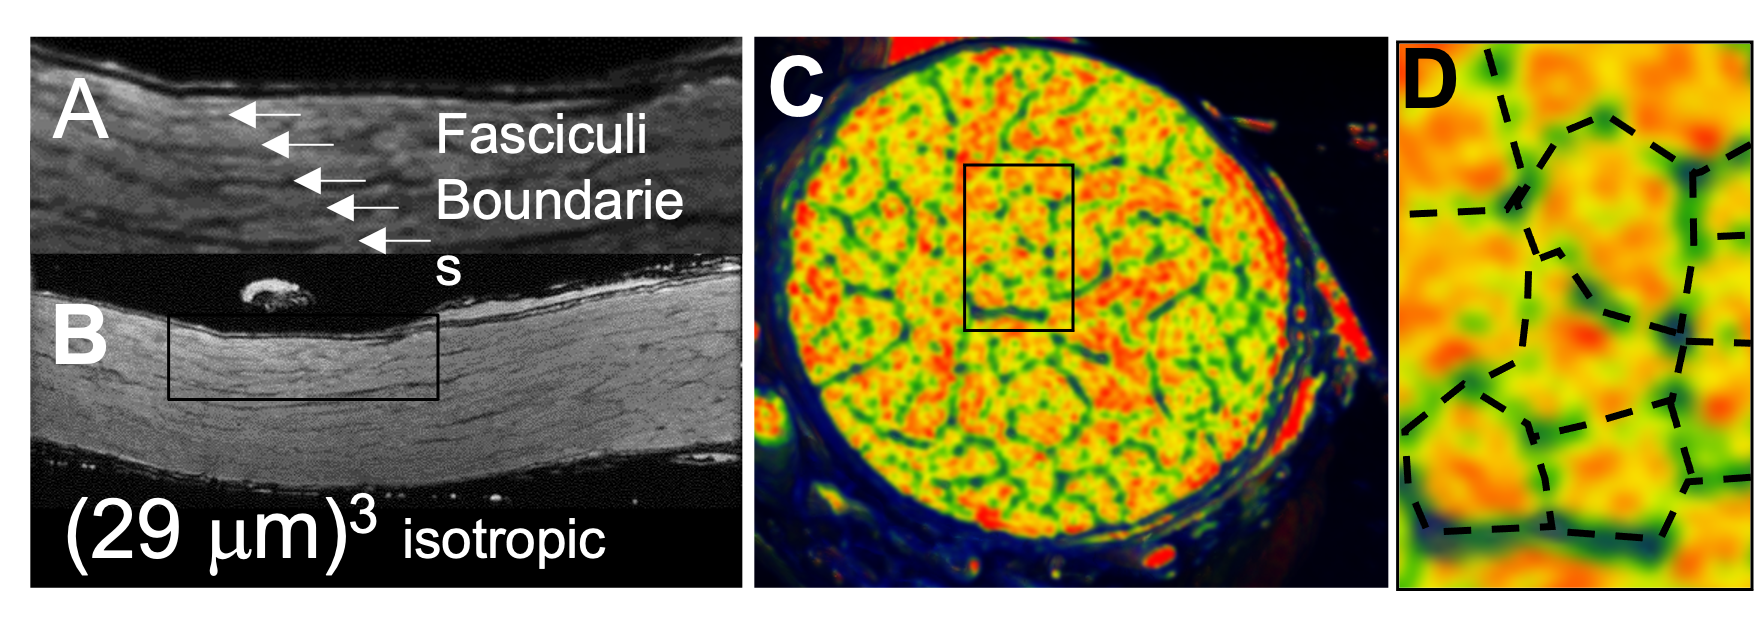
Porcine showing detail of fascicle boarders A&B) MRI image along optic nerve; C&D cross-section of optic nerve color image green fasciculi boarders with 4-channel array tissue classification. D includes segmentation of fasciculi boundaries.
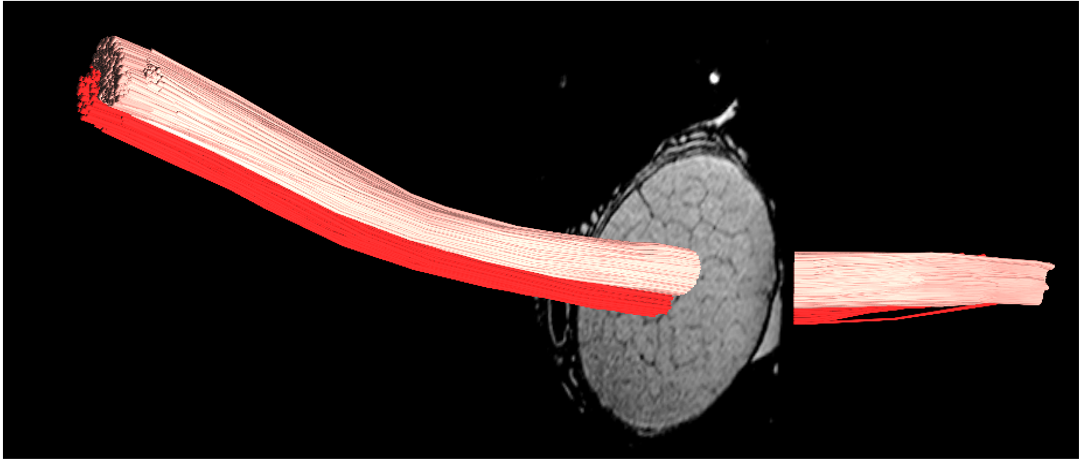
Diffusion
fiber tracking of two adjoining fasciculi with separate seed points showing a
long parallel trajectory without mixing.
DOI: https://doi.org/10.58530/2022/0650