0648
Is diffusion tensor principal diffusivity aligned with axon fiber in the human brain white matter?1Department of Radiology, University of Michigan, Ann Arbor, MI, United States
Synopsis
An angle offset has been identified in proton magnetic resonance transverse relaxation orientation dependencies in the human brain WM in vivo when DTI primary diffusivity direction was used as an internal reference. This angle offset has not yet been accounted for in previous studies. The present work demonstrates that the observed angle offset can be removed using an angle derived from the perpendicular and parallel diffusivities of an axially symmetric diffusion tensor regardless of axon fiber orientations. The finding from this study clearly suggests that the diffusion tensor principal diffusivity direction deviates from an axon fiber orientation in WM.
Introduction
In vivo orientation-dependent proton MR transverse ($$$R_2$$$ or $$$R_2^*$$$) relaxation studies of white matter (WM) rely predominantly on the principal diffusion direction derived from diffusion tensor imaging (DTI).1,2 The measured relaxation orientation dependencies from adult brains reveal an angle offset,2-4 which becomes exacerbated in neonates.5 Consequently, a model parameter $$$ε_0$$$ was introduced into the proposed generalized magic angle effect (gMAE) model to account for this confounding factor regardless of fiber orientations.6 This work demonstrates that an orientation-specific angle offset $$$ε_0$$$ can be removed, rendering the model parameter $$$ε_0$$$ unnecessary in gMAE modeling.Theory
For an image voxel in DTI, water diffusion can be modeled by a 3 by 3 tensor characterized by its eigenvalues ($$$λ_i$$$) and eigenvectors ($$$\overrightarrow{e_{i}}$$$), with $$$i=1,2,3$$$. An axially symmetric tensor (Fig. 1A), describing either linear ($$$λ_1 > λ_2≈λ_3$$$, 1st row) or planar ($$$λ_1 ≈ λ_2>λ_3$$$, 2nd row) anisotropy, could be separated into isotropic (Fig. 1B) and anisotropic (Fig. 1C) components, with an effective direction ($$$\overrightarrow{n}$$$) of the latter assumed to be along the axon fiber direction (Fig. 1D). Thus, an angle offset $$$ε_0$$$ can be determined by $$$tan^{-1}D_⊥⁄D_∥$$$. Previously proposed orientation-dependent $$$R_2$$$ function7 and gMAE model6 are expressed by Equations 1 and 2: $$ f(α,ε)=1/4(3cos^2α-1)^2 (3cos^2ε-1)^2+9/8(sin^4α sin^4ε+sin^22αsin^22ε) (1)$$ $$R_2=R_2^i+R_2^a*f(α,Φ-ε_0) (2) $$ where $$$R_2^i$$$, $$$R_2^a$$$, $$$α$$$, and $$$Φ (=ε +ε_0)$$$ denote an isotropic relaxation rate, an anisotropic relaxation rate with $$$f(α,ε)=1$$$, an open angle for residual dipolar coupling distributions, and principal diffusivity direction with respect to $$$B_0$$$, respectively.Method
A publicly available8 high-resolution (760 $$$μm^3$$$) Connectome DTI dataset of in vivo human brain at 3T was utilized to validate the proposed theoretical framework. More specifically, six preprocessed data subsets with b=1000 s/mm2 were analyzed using the FSL DTIFIT to calculate related diffusion parameters,9 i.e. $$$λ_i$$$, $$$\overrightarrow{e_{i}}$$$, FA (fractional anisotropy), MO (mode of anisotropy), and T2W signal (SO) with b=0. An anisotropic $$$R_2$$$ could be readily assessed using T2W signal as previously demonstrated using Eq. 3, given a known TE=75ms used in DTI.10$$lnSO/TE=(lnS_0⁄TE-R_2^i)-R_2^a*f(α,Φ-ε_0 ) (3)$$ Note, $$$S_0$$$ is SO when TE=0 and the term $$$(lnS_0⁄TE-R_2^i)$$$ can be treated as a constant $$$C_0$$$ to be fitted. $$$Φ$$$ was determined from the primary eigenvector $$$\overrightarrow{e_{1}}$$$ by the relationship of $$$cosΦ=(\overrightarrow{e_{1}}\cdot{B_{0}})⁄(\mid\overrightarrow{e_{1}}\mid\cdot\mid{B_{0}}\mid)$$$. The measured SO (in a logarithmic scale) of specific voxels from the whole brain either with linear (i.e., 0.5<FA<0.9 and 0.5<MO<1.0) or planar (i.e., 0.3<FA<0.6 and -1.0<MO<-0.5) diffusion anisotropy were sorted and then averaged into 180 different bins of fiber orientations ranging from 0° to 90°. The fit using Eq. 3 was labeled respectively as “Fit A” with $$$ε_0$$$ or “Fit B” without $$$ε_0$$$. Goodness of fit was characterized by root-mean-square error (RMSE) and F-test was used for comparing fitting models. The statistical significance was set to P < .05. The mean and standard deviation (SD) of the fits were presented unless otherwise stated. Data analysis and visualization were performed using in-house software written in IDL 8.5 (Harris Geospatial Solutions, Inc., Broomfield, CO, USA).
Results
Figs. 2A-C show a representative imaging slice of anisotropic $$$R_2$$$ (2A), the primary diffusivity orientation (2B) and MO (2C) ranging from 1 (ideally linear anisotropy) to -1 (ideally planar anisotropy), with 0 indicating an isotropic case. As highlighted by a black box in 2D histogram map (Fig. 2D), the measured (mean ± SD) and fitted anisotropic $$$R_2$$$ profiles of voxels with predominantly linear anisotropy are plotted in Fig. 2E, showing that Fit A (red line, thick) significantly (P<.01) outperformed Fit B (blue dashed line) as demonstrated by reduced RMSE (i.e., 0.08 vs. 0.14). The fitted $$$ε_0$$$, as indicated by a vertical dashed green line in Fig. 2E, and the calculated average $$$⟨ε_0 ⟩$$$ across all fiber orientations, as indicated by a horizontal dashed green line in Fig. 2F, were comparable within measurement uncertainties, implying that a global $$$ε_0$$$ was an adequate approximation when an orientation-dependent alternative was inaccessible. As diffusion anisotropy increasingly deviated from an ideally linear case, an angle offset $$$ε_0$$$ became increasingly larger as shown in Fig. 3A. After an orientation-specific $$$ε_0$$$ correction for anisotropic $$$R_2$$$ profiles as shown in Fig. 3C, Fit B performed at least equally well as Fit A (Fig. 3B), with slightly reduced fitting errors. The observed relatively larger measurement uncertainties for least (i.e., $$$ε+ε_0<20°$$$) orientated axon fibers most likely resulted from a smaller number of voxels as shown in Fig. 3D. On the other hand, for voxels with predominantly planar anisotropy as highlighted by a white box in Fig. 2D, Fit B also successfully fitted data (Figs. 4A and 4B) after the corresponding $$$ε_0$$$ removed. However, this was not the case if an offset angle was incorrectly calculated based on linear anisotropic diffusion (Figs. 4C and 4D), which agrees well with the proposed theoretical framework.Conclusion
The results clearly indicate that an angle offset observed in anisotropic $$$R_2$$$ and $$$R_2^*$$$ profiles of in vivo human brain WM originates from inaccurate axon fiber orientations guided by DTI principal diffusivity directions. This conclusion has significant implications when interpreting clinical tractography results in various neuro applications or when evaluating alternative MR methods for characterizing WM microstructures if DTI directional information be used as an internal orientation reference.Acknowledgements
No acknowledgement found.References
1. Denk C, Torres EH, MacKay A, Rauscher A. The influence of white matter fibre orientation on MR signal phase and decay. NMR in Biomedicine 2011;24(3):246-252.
2. Birkl C, Doucette J, Fan M, Hernandez-Torres E, Rauscher A. Myelin water imaging depends on white matter fiber orientation in the human brain. Magn Reson Med 2021;85(4):2221-2231.
3. Lenz C, Berger C, Bauer M, Scheurer E, Birkl C. Sensitivity of fiber orientation dependent R2∗ to temperature and post mortem interval. Magn Reson Med 2021; 86(5):2703-2715.
4. Schyboll F, Jaekel U, Weber B, Neeb H. The impact of fibre orientation on T 1-relaxation and apparent tissue water content in white matter. Magnetic Resonance Materials in Physics, Biology and Medicine 2018;31(4):501-510.
5. Weber AM, Zhang Y, Kames C, Rauscher A. Myelin water imaging and R2* mapping in neonates: Investigating R2* dependence on myelin and fibre orientation in whole brain white matter. NMR in Biomedicine 2020;33(3):e4222.
6. Pang Y. Anisotropic transverse relaxation in the human brain white matter induced by restricted rotational diffusion. In: Proceedings of the 29th Virtual Annual Meeting of ISMRM, 2021. (abstract: 1711).
7. Pang Y. Characterization of anisotropic T2W signals from human knee femoral cartilage: The magic angle effect on a spherical surface. NMR in Biomedicine 2021:e4535.
8. Wang F, Dong Z, Tian Q, Liao C, Fan Q, Hoge WS, Keil B, Polimeni JR, Wald LL, Huang SY. In vivo human whole-brain Connectom diffusion MRI dataset at 760 µm isotropic resolution. Scientific Data 2021;8(1):1-12.
9. Smith SM, Jenkinson M, Woolrich MW, Beckmann CF, Behrens TE, Johansen-Berg H, Bannister PR, De Luca M, Drobnjak I, Flitney DE. Advances in functional and structural MR image analysis and implementation as FSL. Neuroimage 2004;23:S208-S219.
10. Pang Y, Palmieri-Smith RM, Malyarenko DI, Swanson SD, Chenevert TL. A unique anisotropic R2 of collagen degeneration (ARCADE) mapping as an efficient alternative to composite relaxation metric (R2 -R1 rho ) in human knee cartilage study. Magn Reson Med 2019;81(6):3763-3774.
Figures
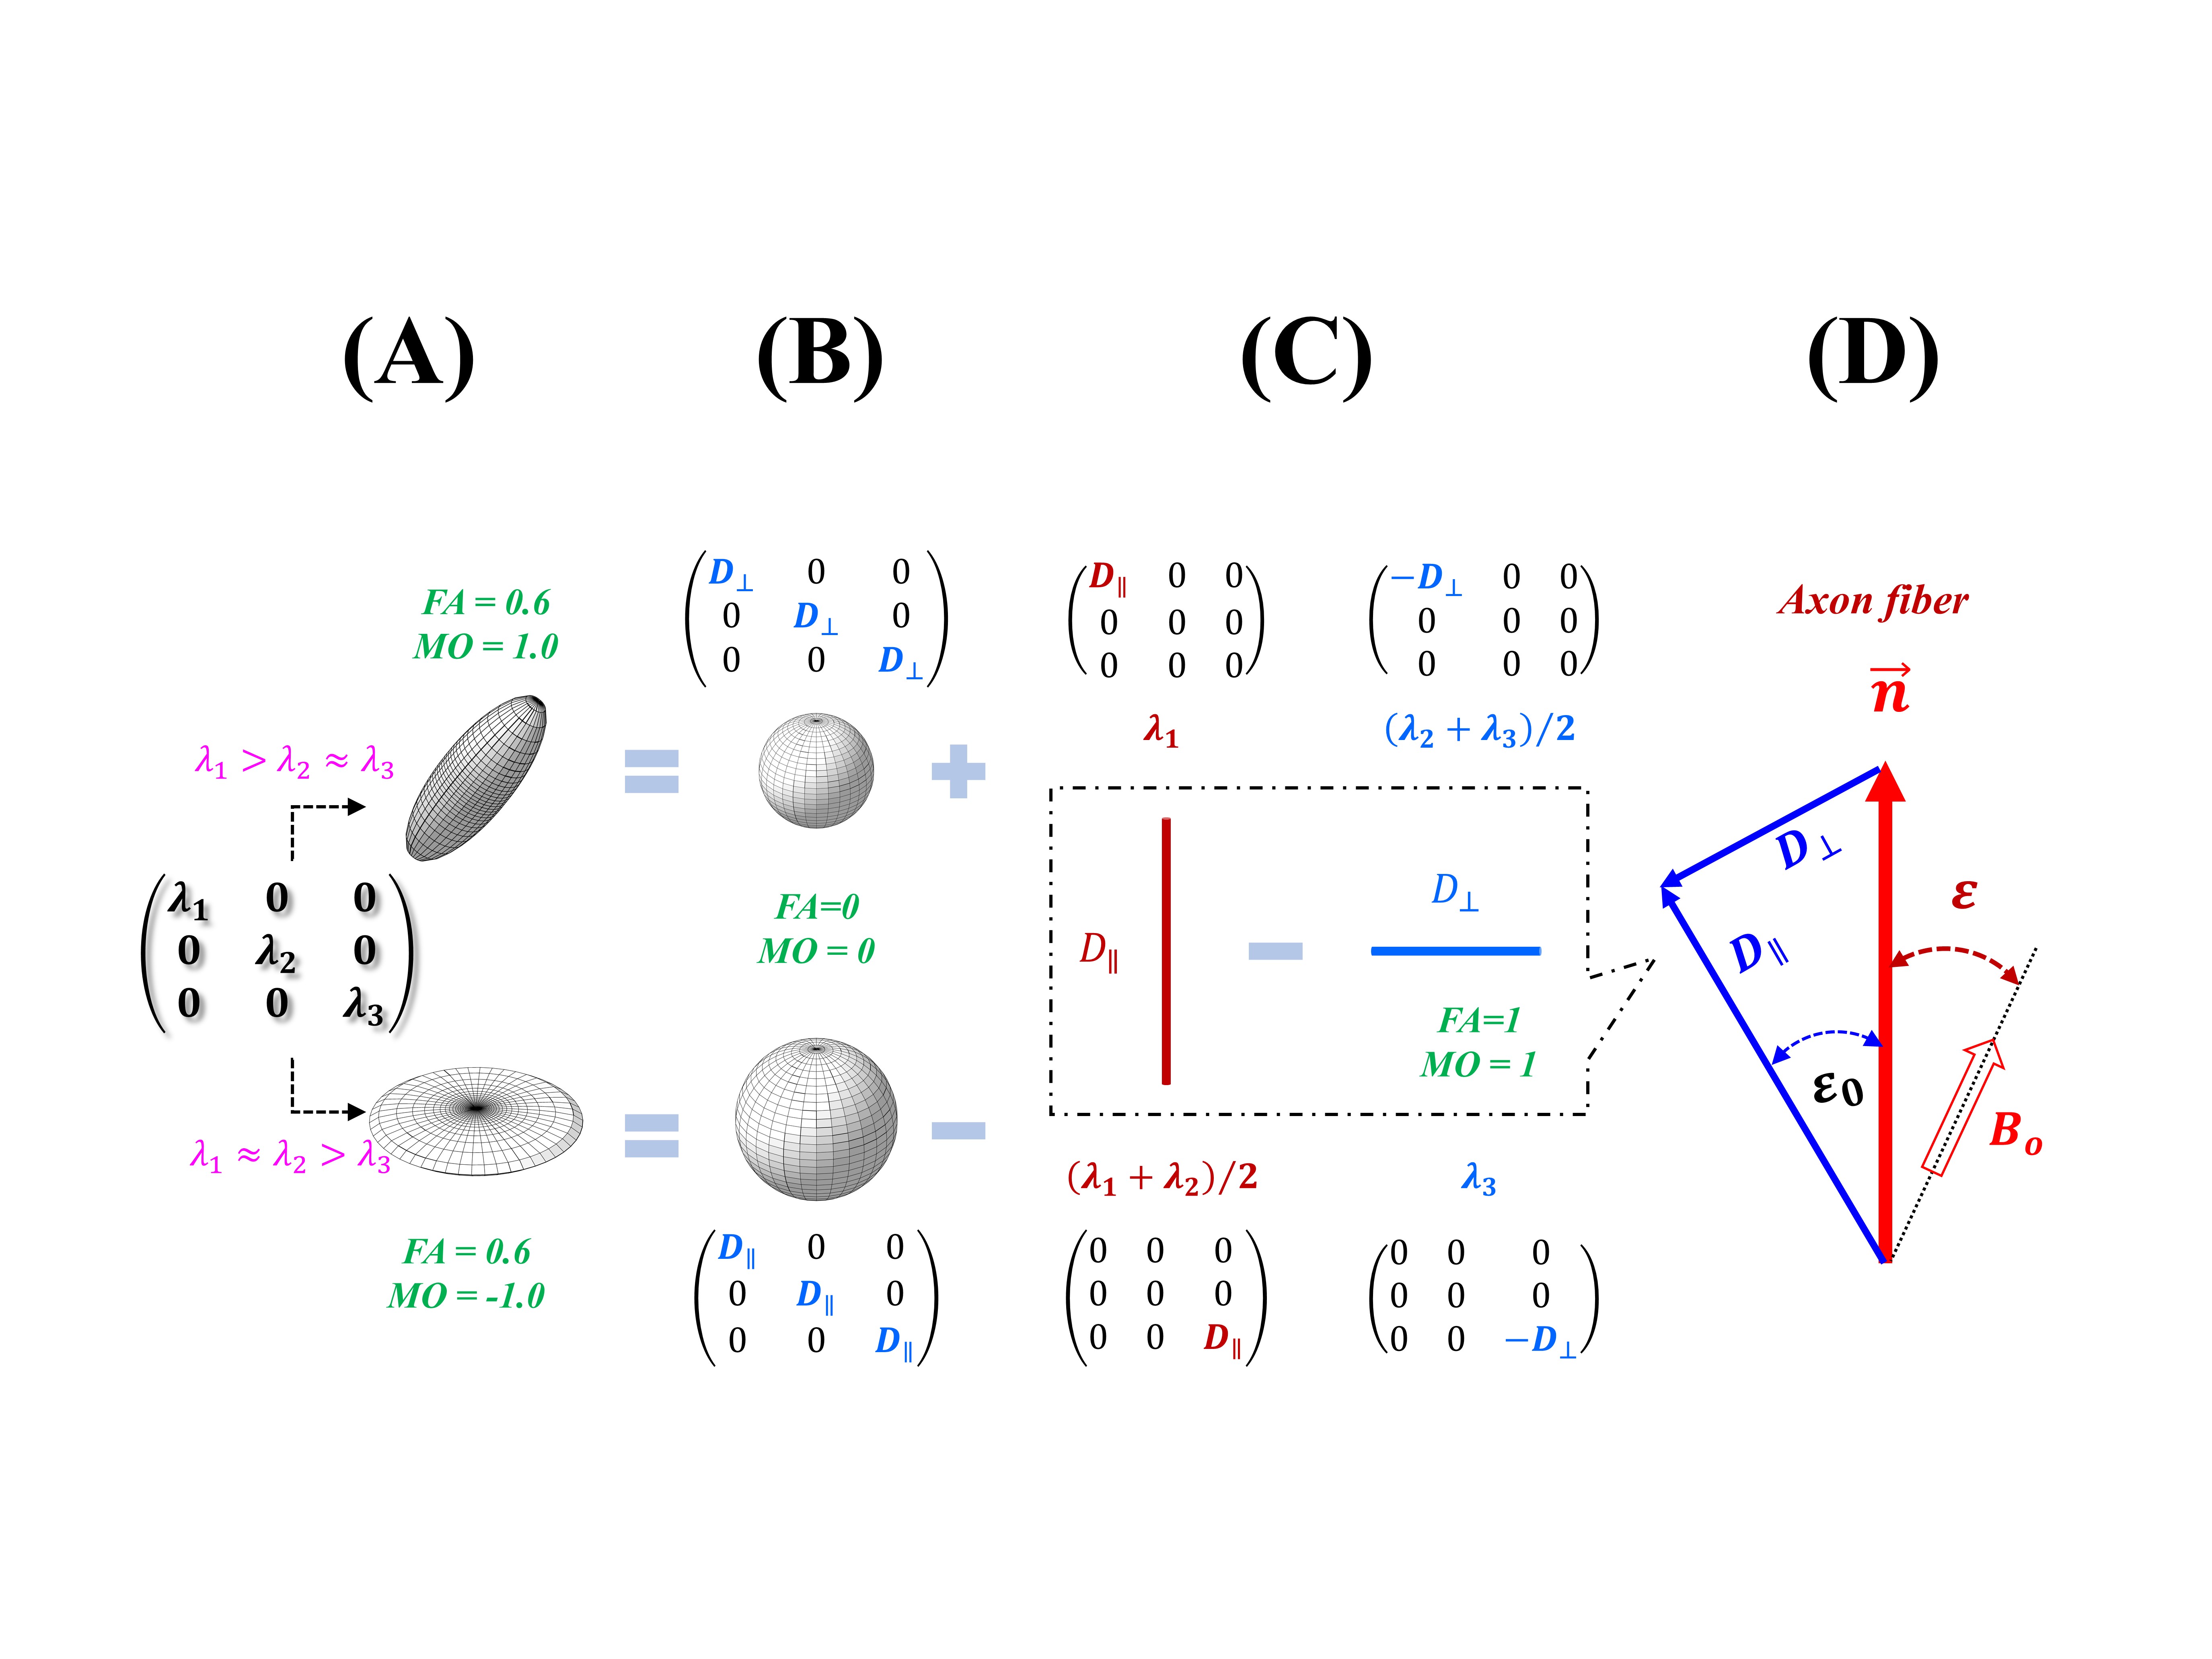
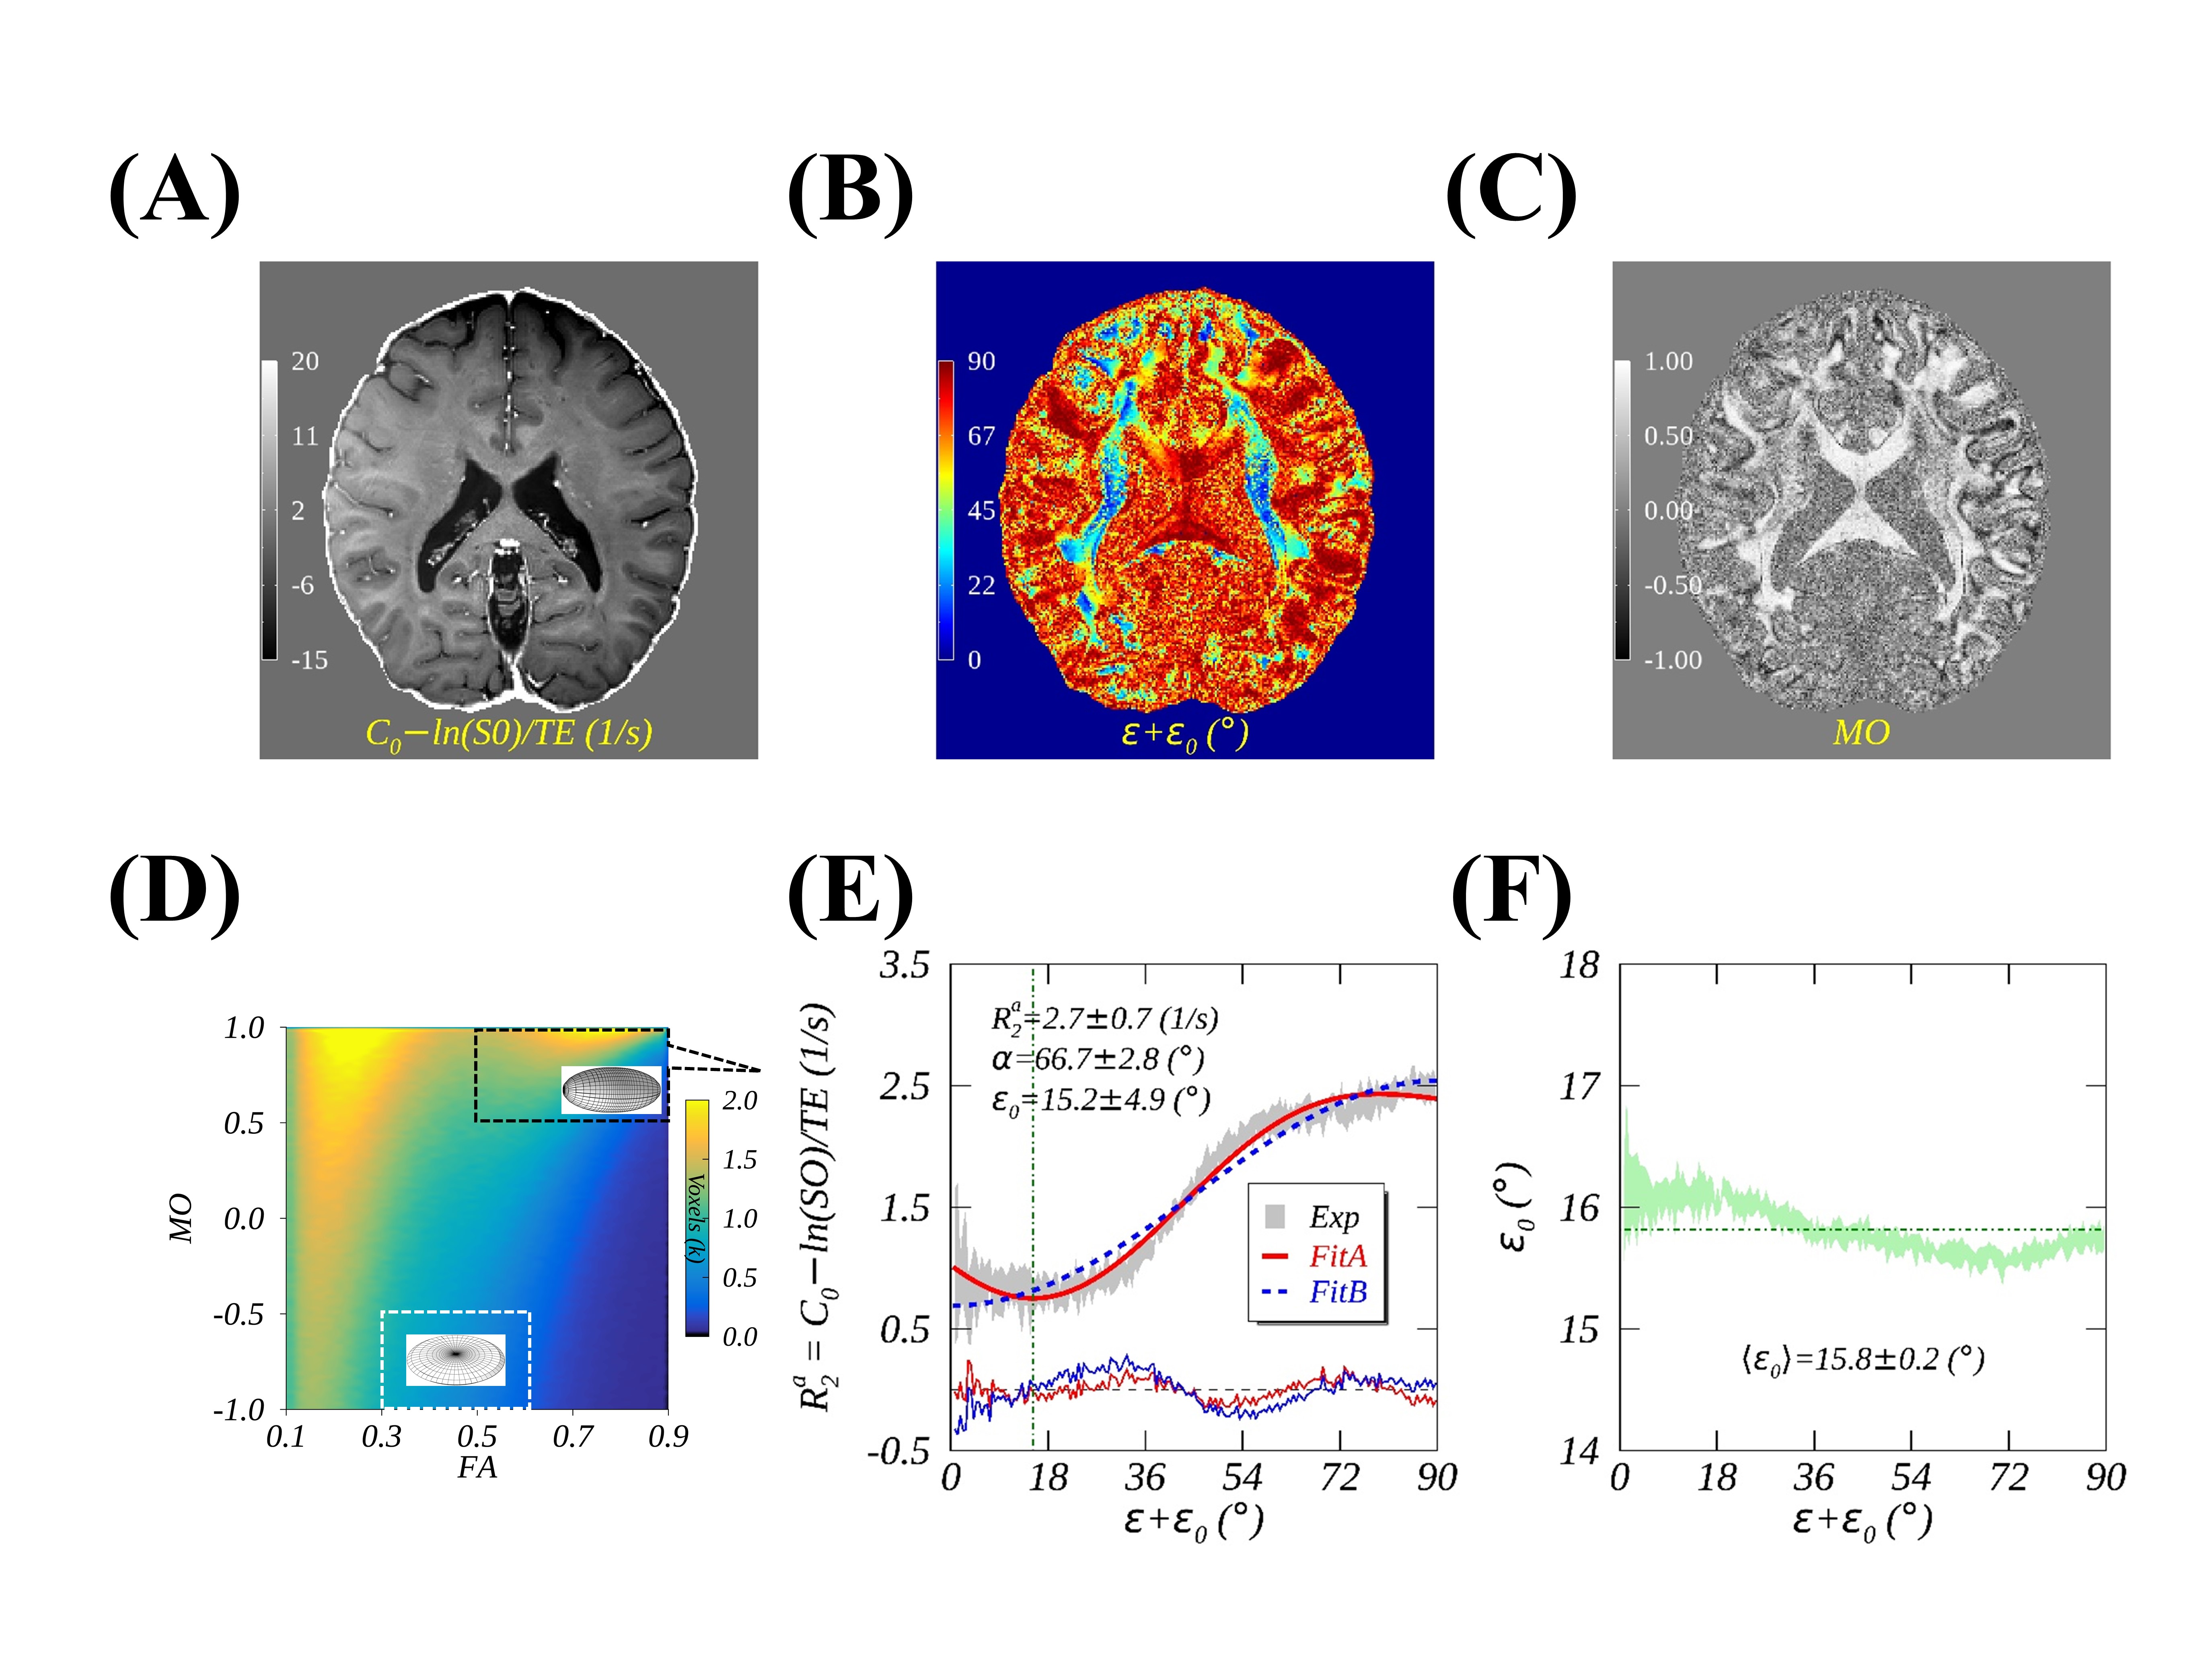
FIG. 2. An illustrative image of anisotropic $$$R_2$$$ (2A), principal diffusivity orientation $$$Φ=ε+ε_0$$$ (2B), and mode of diffusion (MO) anisotropy (2C); an example of the measured and fitted anisotropic $$$R_2$$$ profiles (2E) from voxels with restricted linear diffusion anisotropies as highlighted (black box) in a 2D histogram (2D), and orientation-dependent offset angles $$$ε_0$$$ (2F).
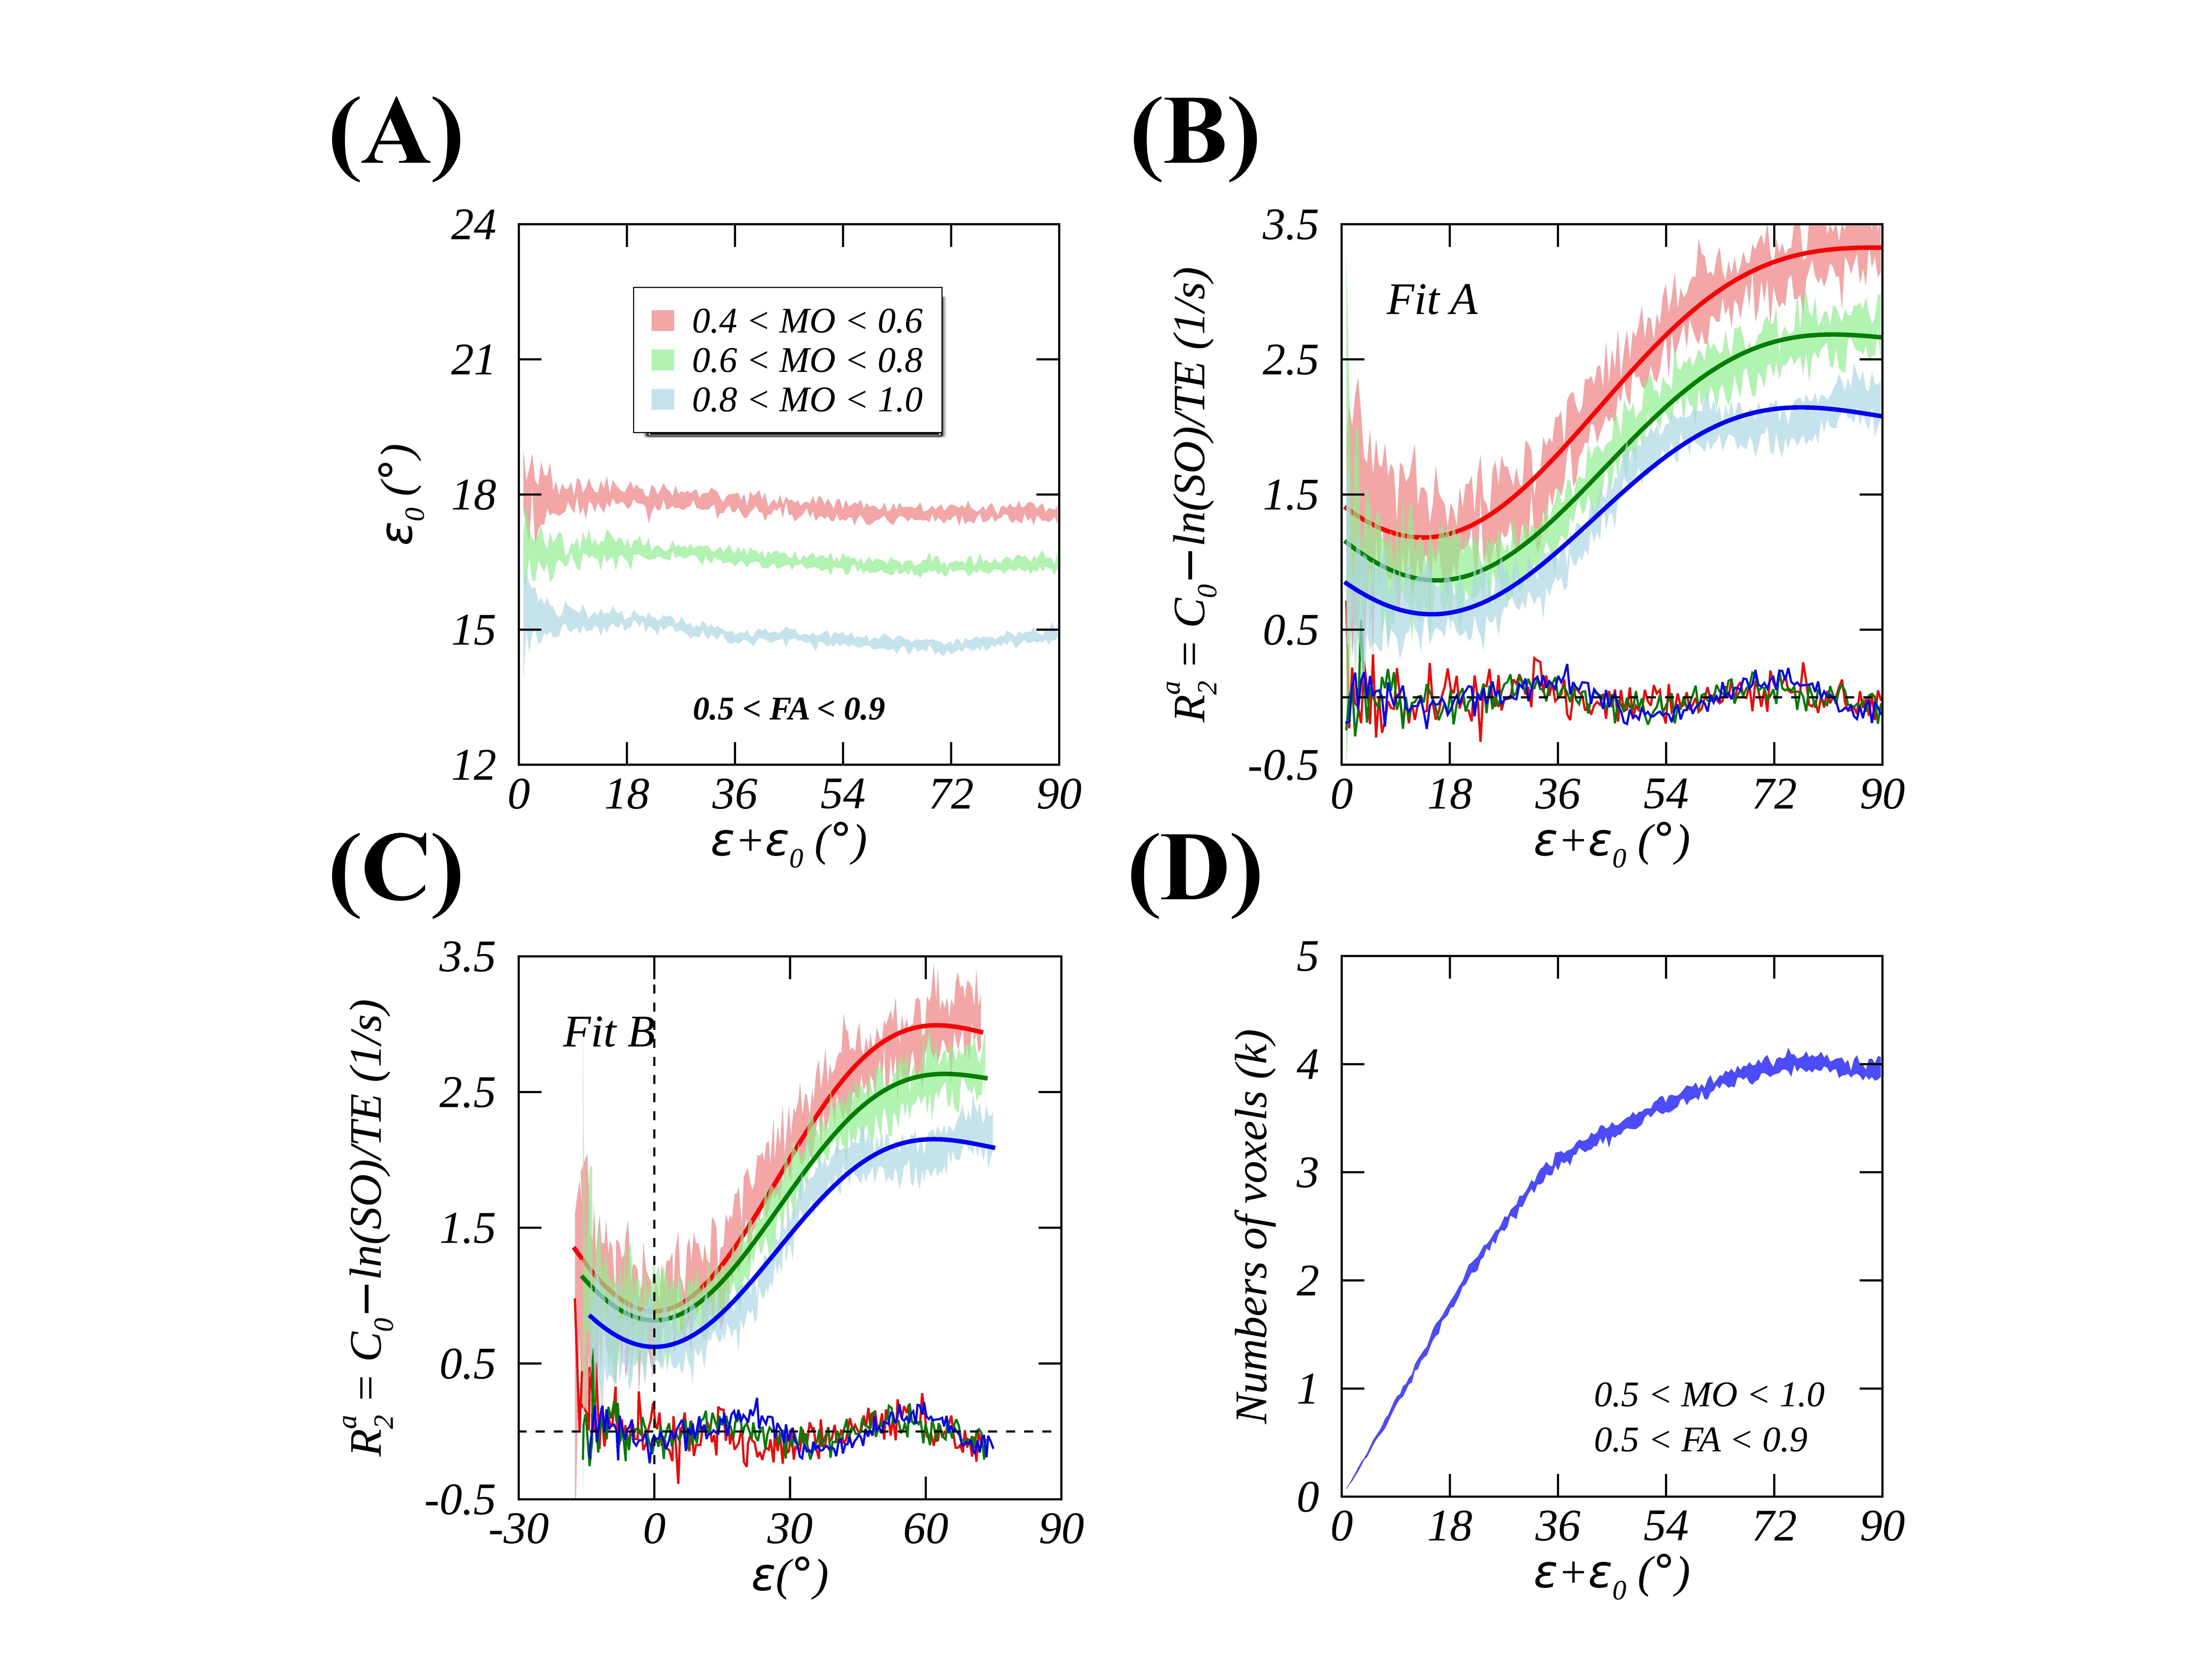
FIG. 3. Orientation-dependent angle offsets $$$ε_0$$$ from voxels with different linear anisotropies are plotted in Fig. 3A, with MO restricted to [0.4, 0.6] (red), [0.6, 0.8] (green), and [0.8, 1.0] (blue). Fig. 3B and 3C display, respectively, the measured (mean ± SD, colored shades) and fitted (thick solid lines) $$$R_2$$$ profiles with Fit A and Fit B after the corresponding orientation-dependent $$$ε_0$$$ removed. The distribution of voxels with different fiber orientations is presented in Fig. 3D.
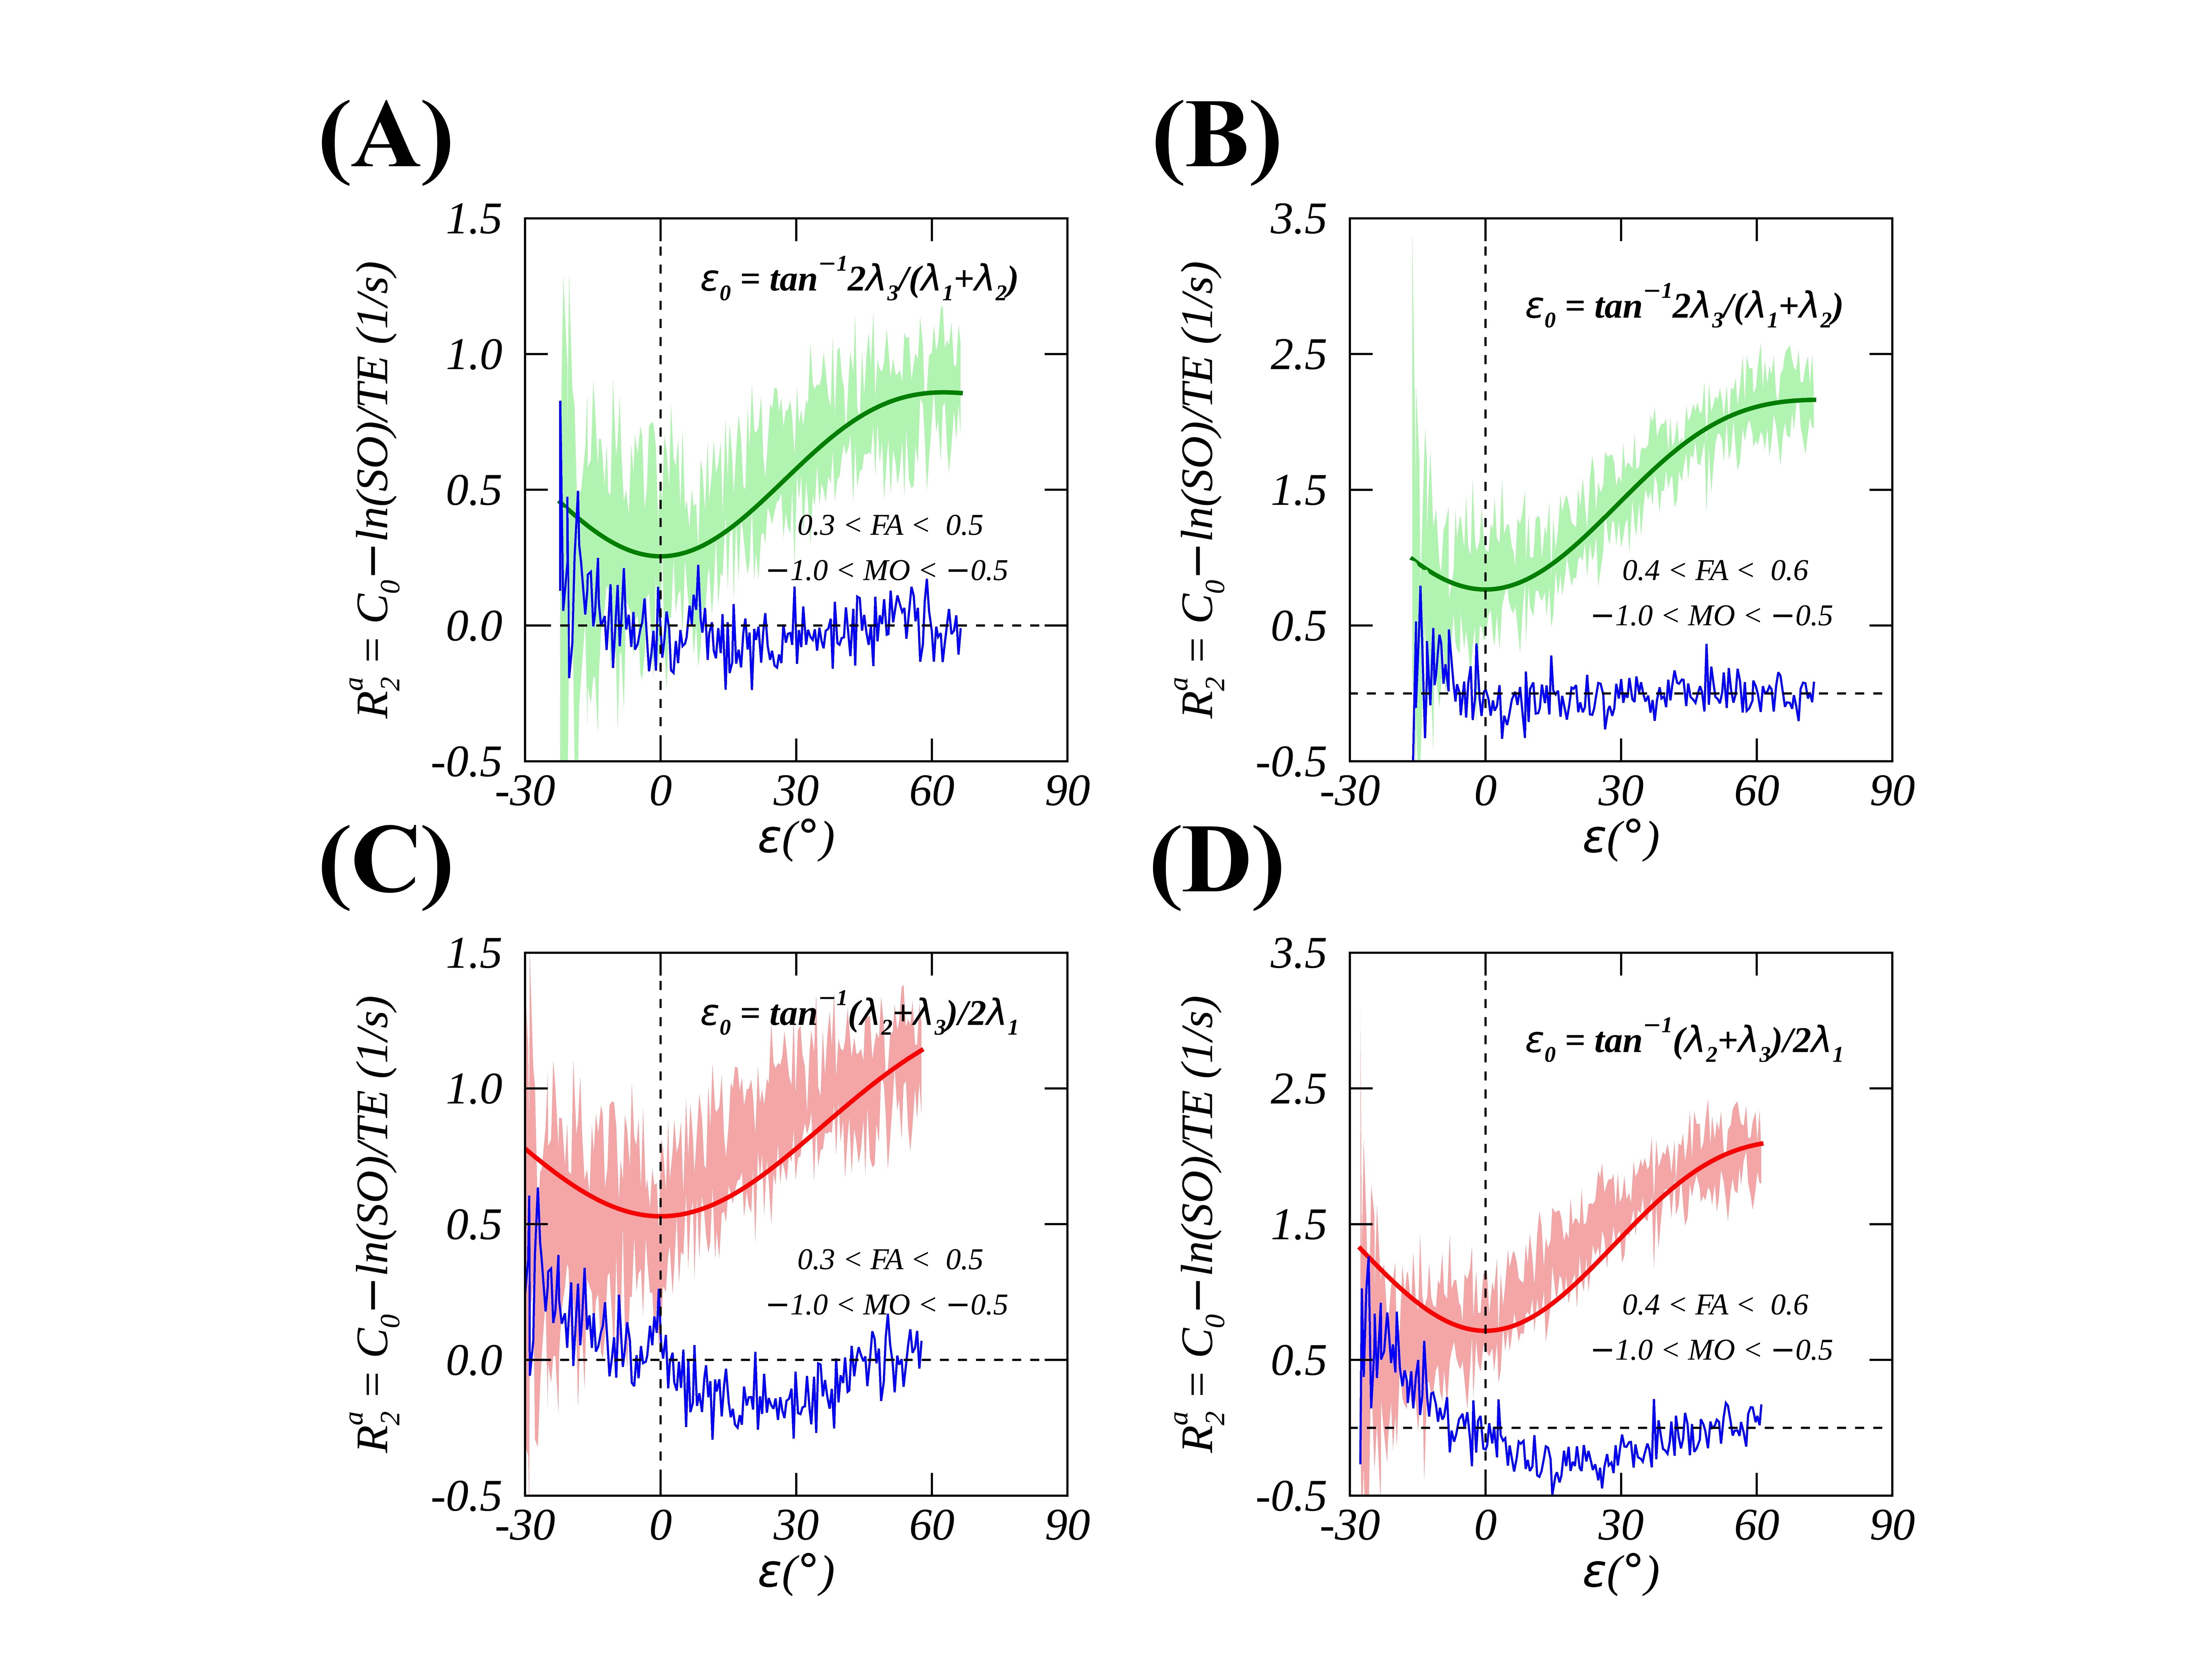
FIG. 4. Measured (mean ± SD, colored shades) and fitted (Fit B, thick solid lines) $$$R_2$$$ profiles after removing orientation-dependent $$$ε_0$$$ from voxels with planar (-1.0<MO<-0.5) anisotropic diffusion where FA was limited to either [0.3, 0.5] (4A and 4C) or [0.4, 0.6] (4B and 4D). The fitted residue is depicted by thin blue lines and an offset angle $$$ε_0$$$ was calculated based on either planar (4A and 4B) or linear (4C and 4D) anisotropic case.