0647
Susceptibility-weighted imaging and quantitative susceptibility mapping of the human brain at 10.5 Tesla: an initial experience
Xiaoping Wu1, Andrea Grant1, Xiaodong Ma1, Edward Auerbach1, Jerahmie Ladder1, Alireza Sadeghi-Tarakameh1, Yigitcan Eryaman1, Russell Lagore1, Nader Tavaf2, Pierre‐Francois Van de Moortele1, Gregor Adriany1, and Kamil Ugurbil1
1CMRR, Radiology, University of Minnesota, Minneapolis, MN, United States, 23M, Minneapolis, MN, United States
1CMRR, Radiology, University of Minnesota, Minneapolis, MN, United States, 23M, Minneapolis, MN, United States
Synopsis
Susceptibility-weighted imaging (SWI) and quantitative susceptibility mapping (QSM) have been shown to provide unique contrasts that can be used to study pathophysiologic changes of tissue magnetic susceptibility in various brain diseases. As magnetic susceptibility effects increase with the main field strength, there has been a rapidly growing interest in performing SWI and QSM at ultrahigh field (UHF) (7 Tesla and above). The aim of this study was to demonstrate how the use of the UHF of 10.5 Tesla may promote SWI and QSM of the human brain.
Introduction
The purpose of this study was to demonstrate the utility of ultrahigh field of 10.5 Tesla (10.5T) for susceptibility-weighted imaging (SWI) (Haacke et al., 2004) and quantitative susceptibility mapping (QSM) (Wang and Liu, 2015) of the human brain.Methods
Human studies were conducted on a 10.5T MRI system (Magnetom DotPlus, Siemens, Erlangen, Germany) equipped with 64 receive channels and a whole-body gradient (70 mT/m maximum strength and 200 T/m/s maximum slew rate). The system can be operated in a multi-channel RF transmission mode enabling up to 16 transmit channels. Healthy volunteers who signed a consent form approved by the local Institutional Review Board were scanned using a homemade 16-channel transmit and 32-channel receive head RF coil (Tavaf et al., 2021).We acquired both SWI and QSM data in 48 contiguous axial-coronal oblique slices at 0.21-mm isotropic in-plane resolutions using a 3D gradient-echo (GRE) sequence (relevant imaging parameters provided in Fig. 1). For SWI, single-echo GRE images were obtained at 1.3-mm slice resolutions, whereas for QSM multi-echo GRE images with six bipolar echoes were acquired at 1.5-mm slice resolutions.
To improve RF uniformity, RF shimming was performed. In particular, RF shims (corresponding to 16-channel RF magnitude and phase modulations) were calculated with a goal of avoiding any signal dropout across the imaging volume of interest (VOI) and by using multi-channel transmit B1 estimation (Van de Moortele P, 2009) obtained from three gapped, equal-distant slices that jointly spanned the VOI.
A multi-channel multi-echo data processing pipeline (Fig. 2) was utilized for reconstruction of QSM. Briefly, channel-uncombined magnitude and phase images (exported as dicom data from the scanner) were combined using the POEM (phase-offset estimation from multi-echo) approach (Sun et al., 2020). The resulting channel-combined multi-echo phase images were unwrapped using the Laplacian algorithm (Li et al., 2011) and were then used to linearly fit the echo times to estimate the total field map. The background field was removed from the total field map using the Laplacian-boundary-value method (Zhou et al., 2014). The resulting local field map along with channel- and echo-combined magnitude images was used to reconstruct the QSM using the MEDI (morphology-enabled dipole inversion) method (Liu et al., 2011) with model error reduction (Liu et al., 2013).
Results
High-quality channel-combined multi-echo magnitude and phase images (Fig. 3) obtained after POEM coil combination and Laplacian-based phase unwrapping showed enhanced tissue contrasts, especially for longer echo times.Both the estimated local field map and reconstructed QSM (Fig. 4) presented high tissue contrasts, delineating fine brain structures in gray and white matters and in deep brain organizations (including caudate, putamen, globus pallidus, thalamus, red nuclei, and substantia nigra).
The SWI and its minimum intensity projection map (Fig. 5) also exhibited enhanced T2*-weighted and phase contrasts between various brain structures, clearly visualizing deep brain nuclei and small veins.
Discussion
We have successfully demonstrated that high-quality high-resolution SWI and QSM of the human brain can be attainable at the UHF of 10.5T. Our results show that even with a single average, the reconstructed SWI and QSM images (with ~0.2-mm isotropic in-plane resolutions) can possess sufficient SNR and contrast to delineate fine brain structures across the brain, especially in the deep brain regions.Critical to this accomplishment was a synergistic combination of various techniques including RF coil design, RF management, data acquisition, and image reconstruction.
Part of our future work is to compare with lower field strengths (such as 3T and 7T) and to investigate how best to achieve rapid acquisition of high-resolution, high-quality whole-brain SWI and QSM at 10.5T using multi-channel RF transmission and parallel imaging methods.
Conclusion
We have demonstrated the feasibility and utility of 10.5T for SWI and QSM of the human brain by using a custom 16-channel transmit 32-channel receive RF coil. Our image results with enhanced SNR and tissue contrast suggest that the UHF of 10.5T in combination with other imaging technology has great potential to promote high-resolution SWI and QSM of the human brain.Acknowledgements
The authors acknowledge John Strupp for setting up necessary computational resources. This work was supported by the NIH grants NIBIB P41 EB027061 and NIH U01 EB025144.References
Haacke, E.M., Xu, Y.B., Cheng, Y.C.N., Reichenbach, J.R., 2004. Susceptibility weighted imaging (SWI). Magnetic Resonance in Medicine 52, 612-618.Li, W., Wu, B., Liu, C.L., 2011. Quantitative susceptibility mapping of human brain reflects spatial variation in tissue composition. NeuroImage 55, 1645-1656.
Liu, T., Liu, J., de Rochefort, L., Spincemaille, P., Khalidov, I., Ledoux, J.R., Wang, Y., 2011. Morphology Enabled Dipole Inversion (MEDI) from a Single-Angle Acquisition: Comparison with COSMOS in Human Brain Imaging. Magnetic Resonance in Medicine 66, 777-783.
Liu, T., Wisnieff, C., Lou, M., Chen, W.W., Spincemaille, P., Wang, Y., 2013. Nonlinear formulation of the magnetic field to source relationship for robust quantitative susceptibility mapping. Magnetic Resonance in Medicine 69, 467-476.
Sun, H., Cleary, J.O., Glarin, R., Kolbe, S.C., Ordidge, R.J., Moffat, B.A., Pike, G.B., 2020. Extracting more for less: multi-echo MP2RAGE for simultaneous T1 -weighted imaging, T1 mapping, R 2 * mapping, SWI, and QSM from a single acquisition. Magn Reson Med 83, 1178-1191.
Tavaf, N., Lagore, R.L., Jungst, S., Gunamony, S., Radder, J., Grant, A., Moeller, S., Auerbach, E., Ugurbil, K., Adriany, G., Van de Moortele, P.F., 2021. A self-decoupled 32-channel receive array for human-brain MRI at 10.5 T. Magnetic Resonance in Medicine.
Van de Moortele P, U.K., 2009. Very Fast Multi Channel B1 Calibration at High Field in the Small Flip Angle Regime. Proc Intl Soc Mag Reson Med, Honolulu, USA, p. 367.
Wang, Y., Liu, T., 2015. Quantitative Susceptibility Mapping (QSM): Decoding MRI Data for a Tissue Magnetic Biomarker. Magnetic Resonance in Medicine 73, 82-101.
Zhou, D., Liu, T., Spincemaille, P., Wang, Y., 2014. Background field removal by solving the Laplacian boundary value problem. NMR in Biomedicine 27, 312-319.
Figures

Fig. 1. Relevant imaging parameters for the susceptibility-weighted
imaging (SWI) and quantitative susceptibility mapping (QSM) protocols. For both
SWI and QSM, 3D gradient echo (GRE) data of single average were obtained from 48
contiguous axial-coronal oblique slices with a nominal flip angle of 10 degrees
and with the partial Fourier of 7/8 being applied to both phase encode
directions. The multi-echo GRE data for QSM were acquired with six bipolar
echoes with the echo times ranging from 5.42 to 25.82 ms in steps of 4.08 ms.

Fig. 2. QSM
reconstruction pipeline. Multichannel multiecho magnitude and phase images were
combined using POEM (phase offset estimation from multiecho). Resulting channel combined multiecho phase images were unwrapped with the
Laplacian algorithm and were used to fit echo times to
estimate the total field map. The background field was removed from the total
field map with the Laplacian-boundary-value method. The estimated local field map along with channel and echo combined magnitude images
was used to reconstruct QSM with MEDI (morphology-enabled dipole
inversion).
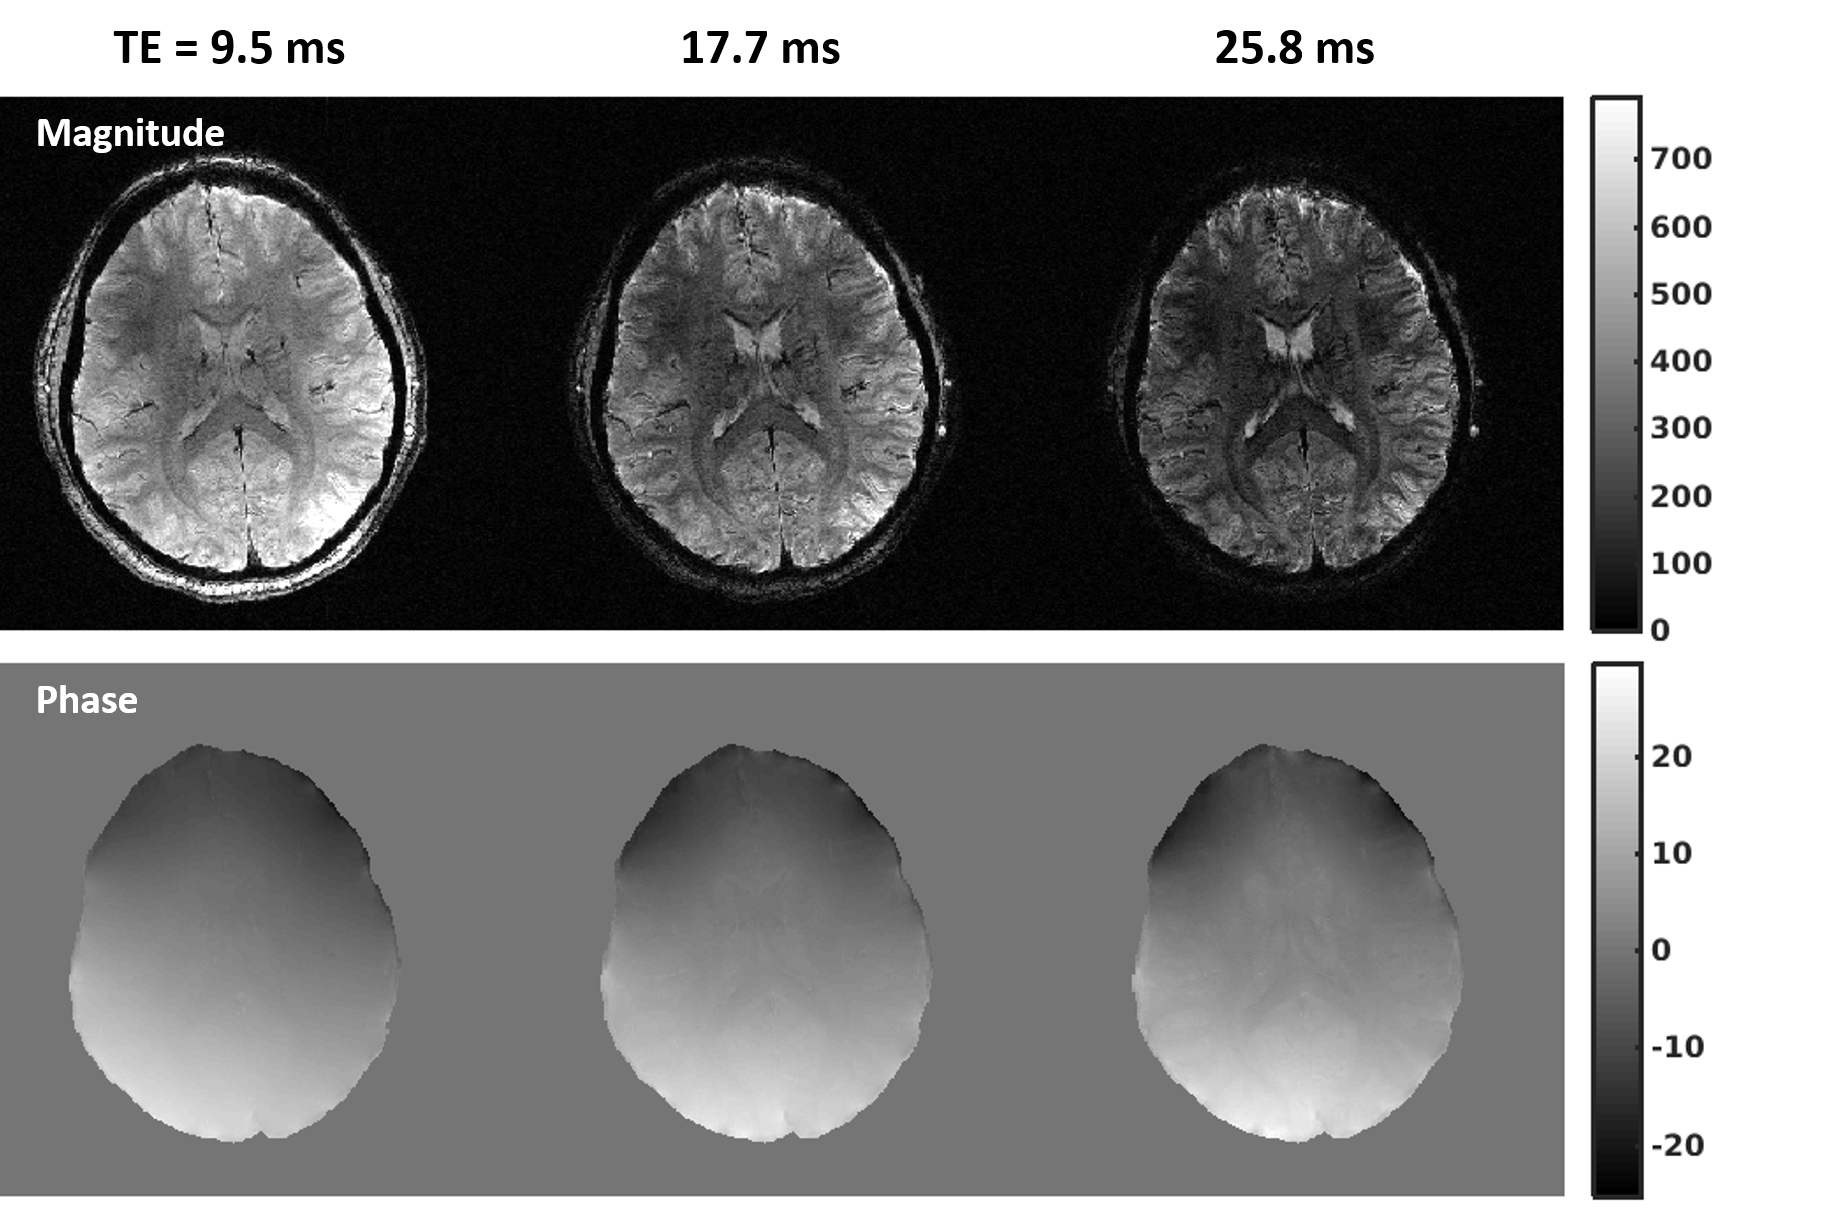
Fig.
3. Channel-combined multi-echo magnitude (top) and unwrapped multi-echo phase
(bottom) images. Shown are images in a representative slice for the even
echoes. Data were obtained with 0.21-mm isotropic in-plane and 1.5-mm slice
resolutions from an oblique imaging slab (of 72 mm in thickness) using a custom
16-channel transmit and 32-channel receive head RF coil. RF shimming was
conducted to avoid any signal dropout across the volume of interest. Note how the tissue contrasts in both
magnitude and phase images varied with increasing echo times.
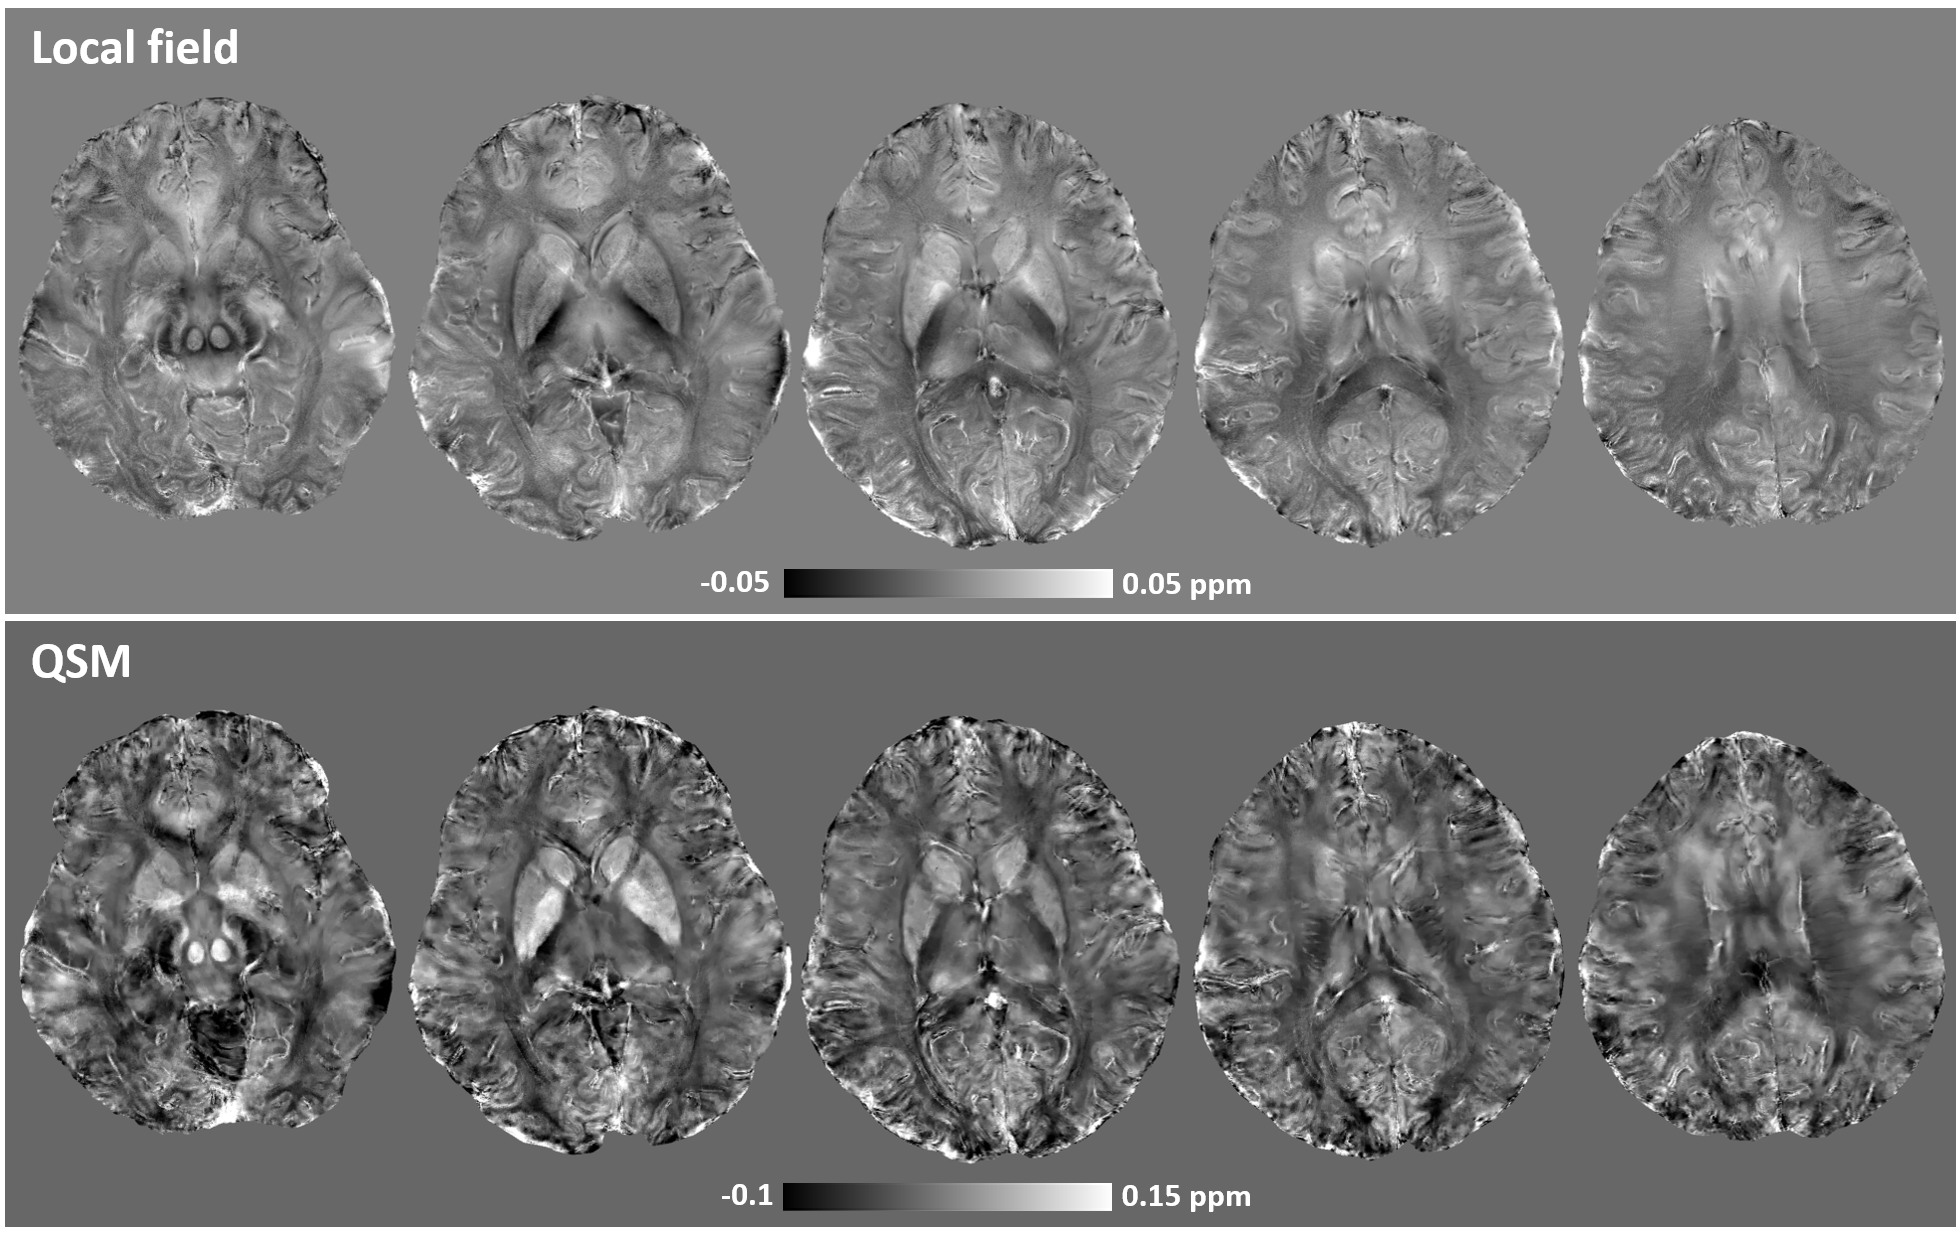
Fig. 4. Estimated local field map (top) and reconstructed QSM (bottom).
Shown are results in five representative slices. The local field map was
obtained by removing the background field with the Laplacian-boundary-value
method, and the QSM reconstructed using the morphology-enabled dipole inversion
(MEDI) approach. Note that with the increased magnetic susceptibility effects
at 10.5T, high tissue contrasts between gray and white matters and between deep
brain structures were observed in both local field and QSM images.
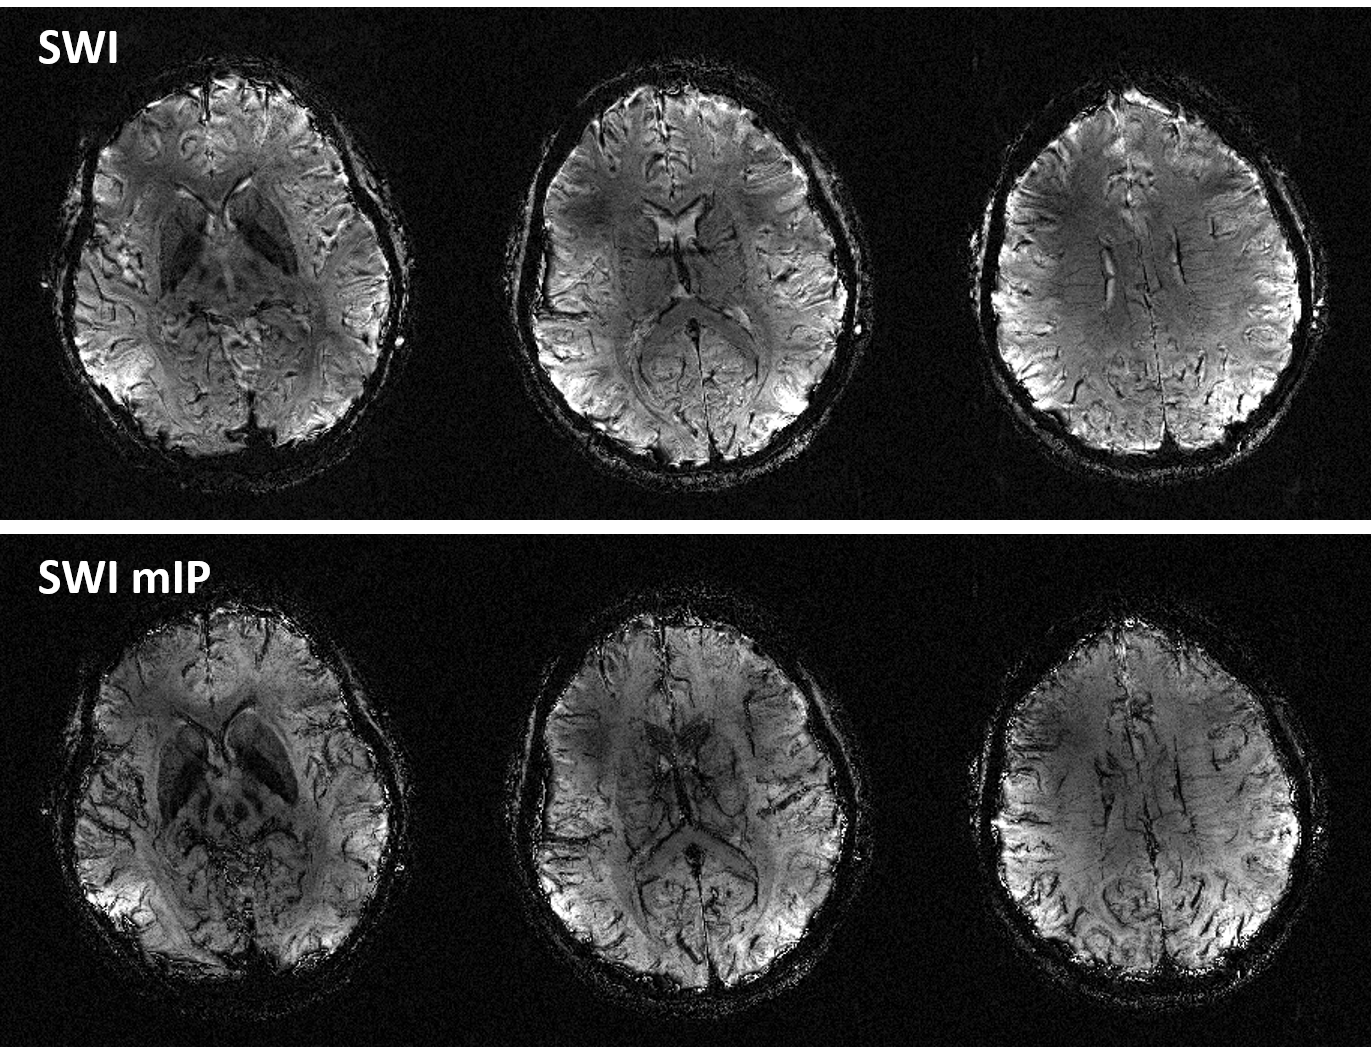
Fig. 5. SWI and its minimum intensity projection (SWI mIP). Shown are
results in three representative slices. The projection thickness was 10.4 mm. Data were obtained at 0.21-mm isotropic in-plane
and 1.3 mm slice resolutions from an oblique slab (62.4 mm in
thickness) using a custom 16 channel transmit and 32 channel receive head RF
coil. RF shimming was conducted to avoid signal dropout across the volume
of interest. Note that the enhanced T2*-weighted and phase contrasts at
10.5T facilitate visualizing various brain structures including deep brain nuclei and
small veins.
DOI: https://doi.org/10.58530/2022/0647