0642
Beat Phenomena in MRI - Theoretical and Experimental Description of the Impact of Mechanical Resonances on Fast Readouts1ETH and University Zurich, Zurich, Switzerland
Synopsis
This work highlights the mechanically resonant behaviour of MRI gradient systems when excited with an oscillating gradient, e.g. echo planar readout. Results demonstrate that a beat phenomenon can be observed in the signal phase with a frequency dependent on readout bandwidth and mechanical resonances of the system. Insights of the beat source are derived theoretically and validated experimentally. Data confirms that the beat phenomenon results in increased blurring in phase encoding direction leading to suggestions for system optimization in order to reduce the impact of the beat phenomenon.
Introduction
Fast readout strategies such as echo planar1 or spiral imaging employ rapidly switching gradient waveforms during extended acquisition windows which are subject to B02, susceptibility3 and trajectory imperfection artefacts4. Previous works by Kasper et al.5 have employed concurrent field monitoring and observed periodic variations of the signal phase when using EPI trajectories. The authors concluded that these field fluctuations have a non-negligible impact on the resulting images and attributed this effect to heating of the gradient coils. In the current work, we propose a different, theoretical explanation of the beat phenomenon and validate it by phantom experiments and simulation.Theory
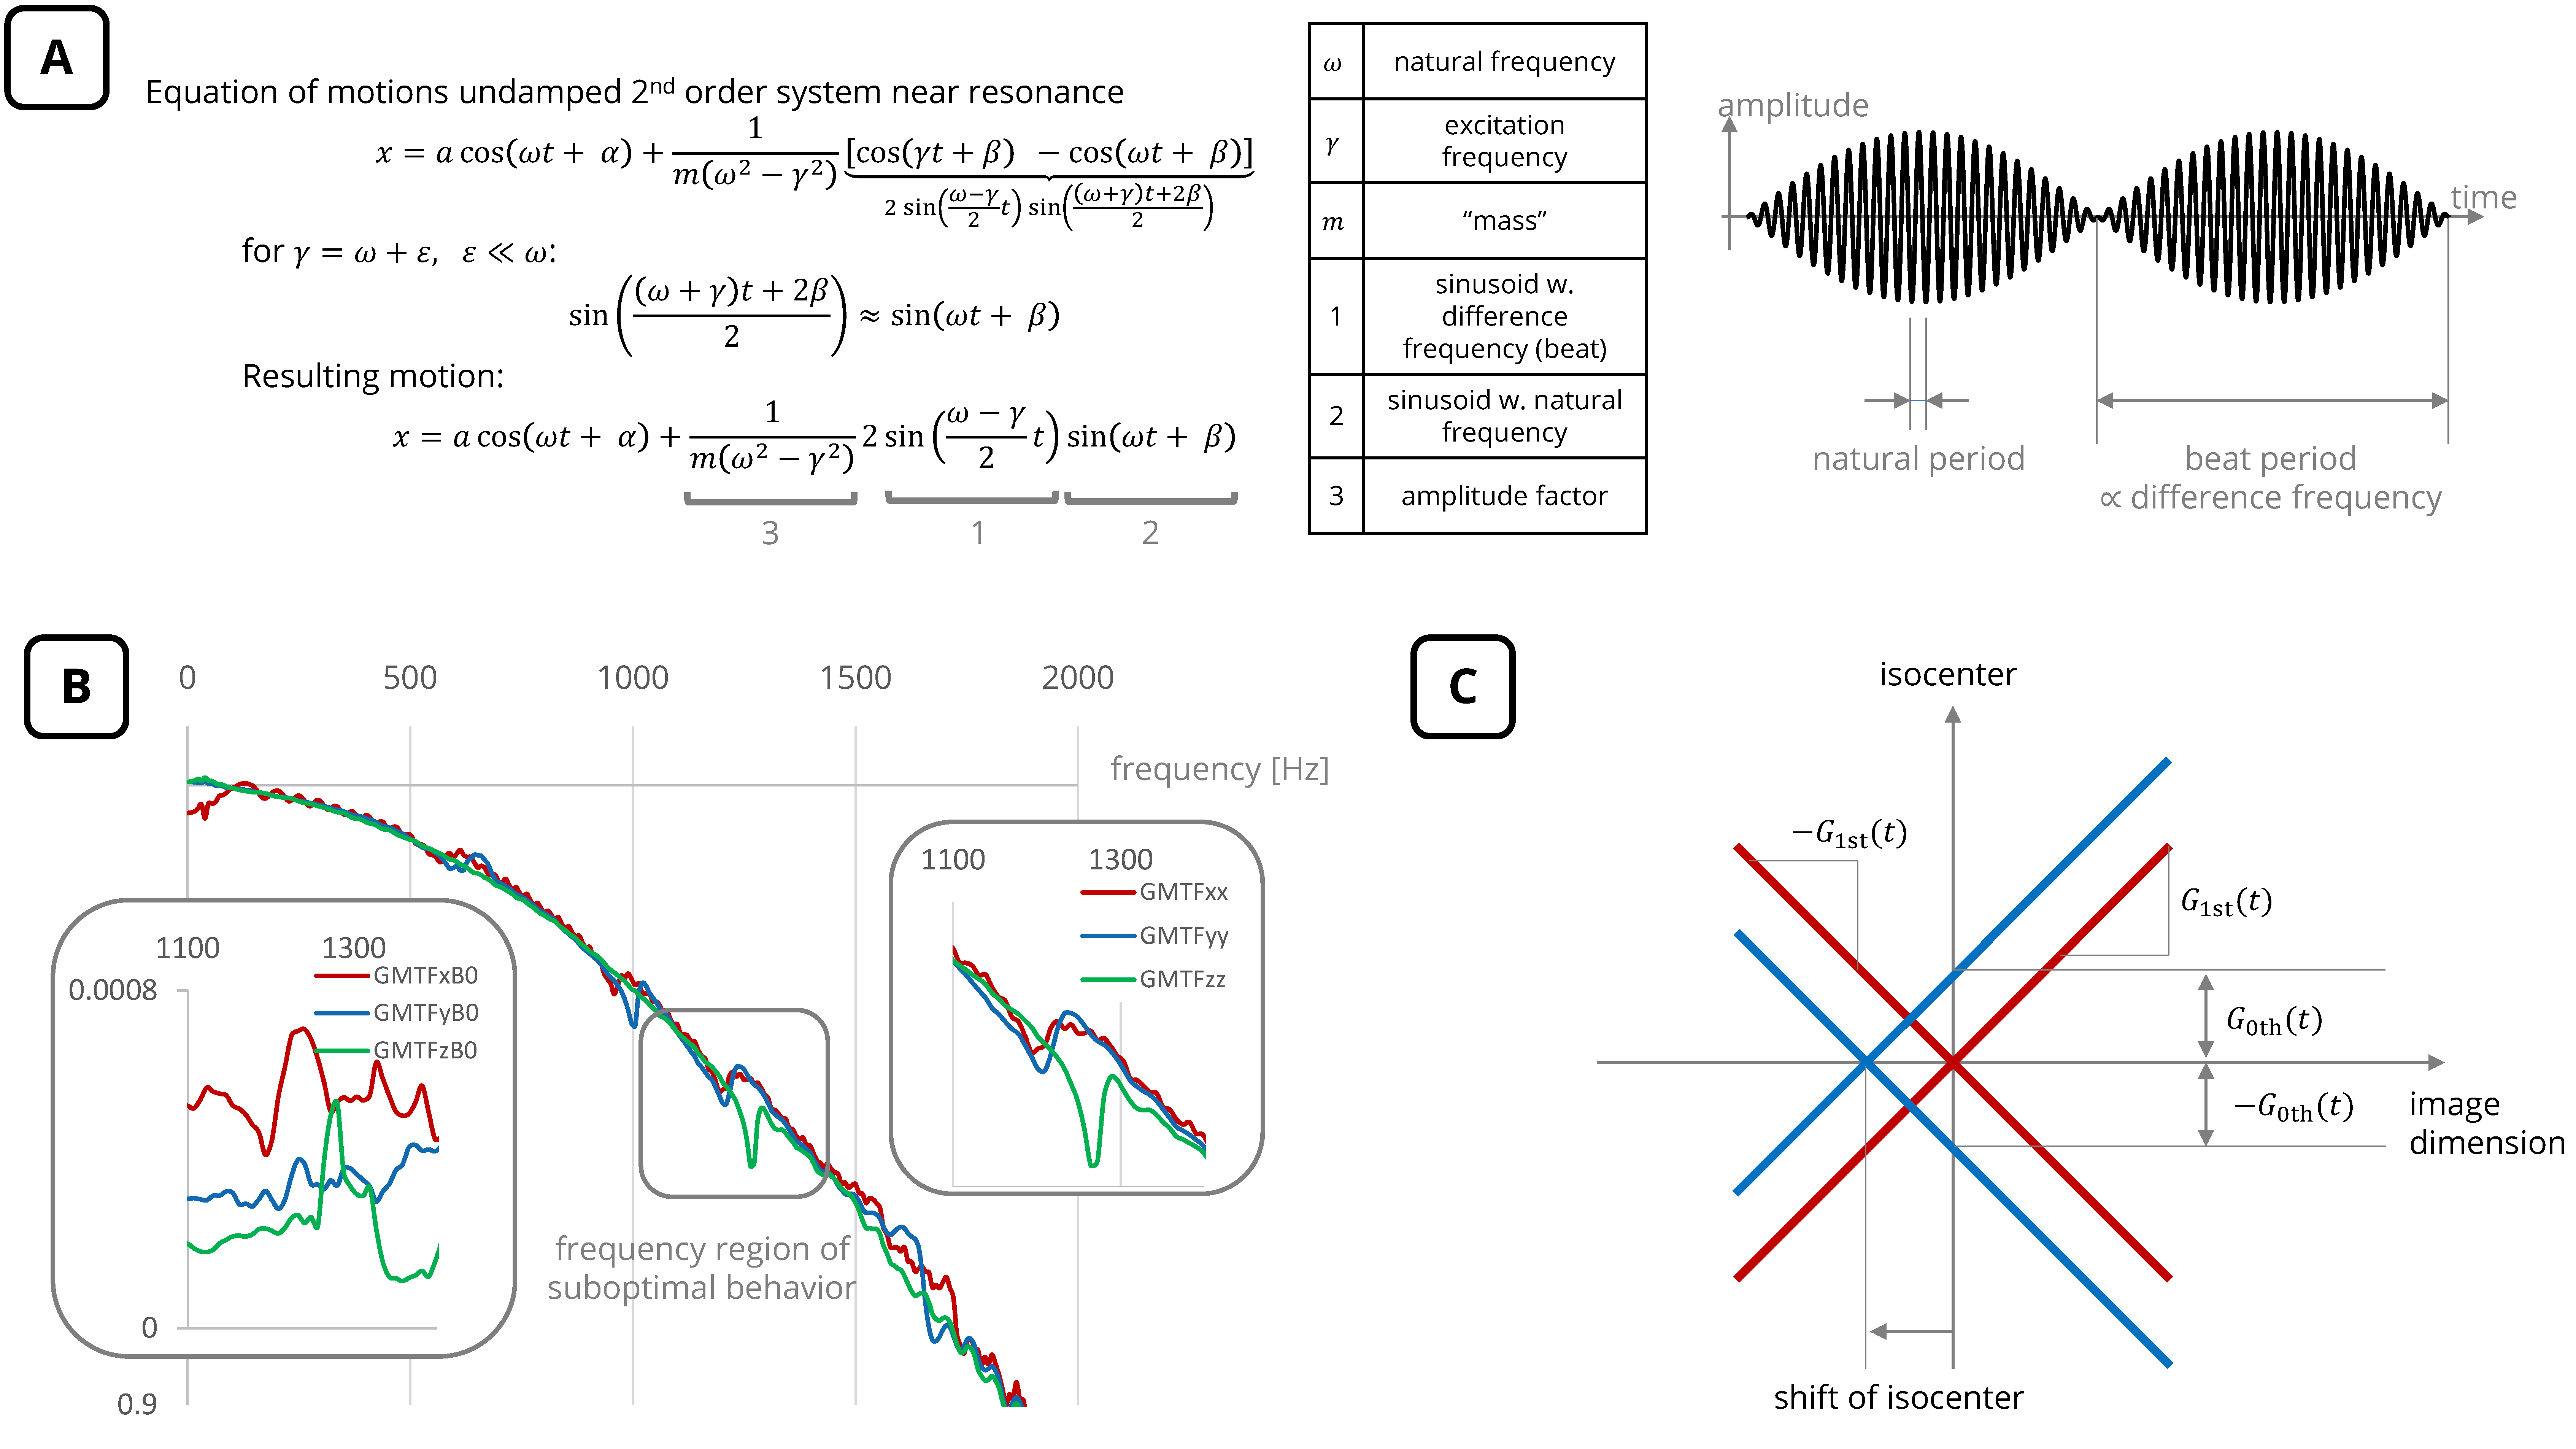
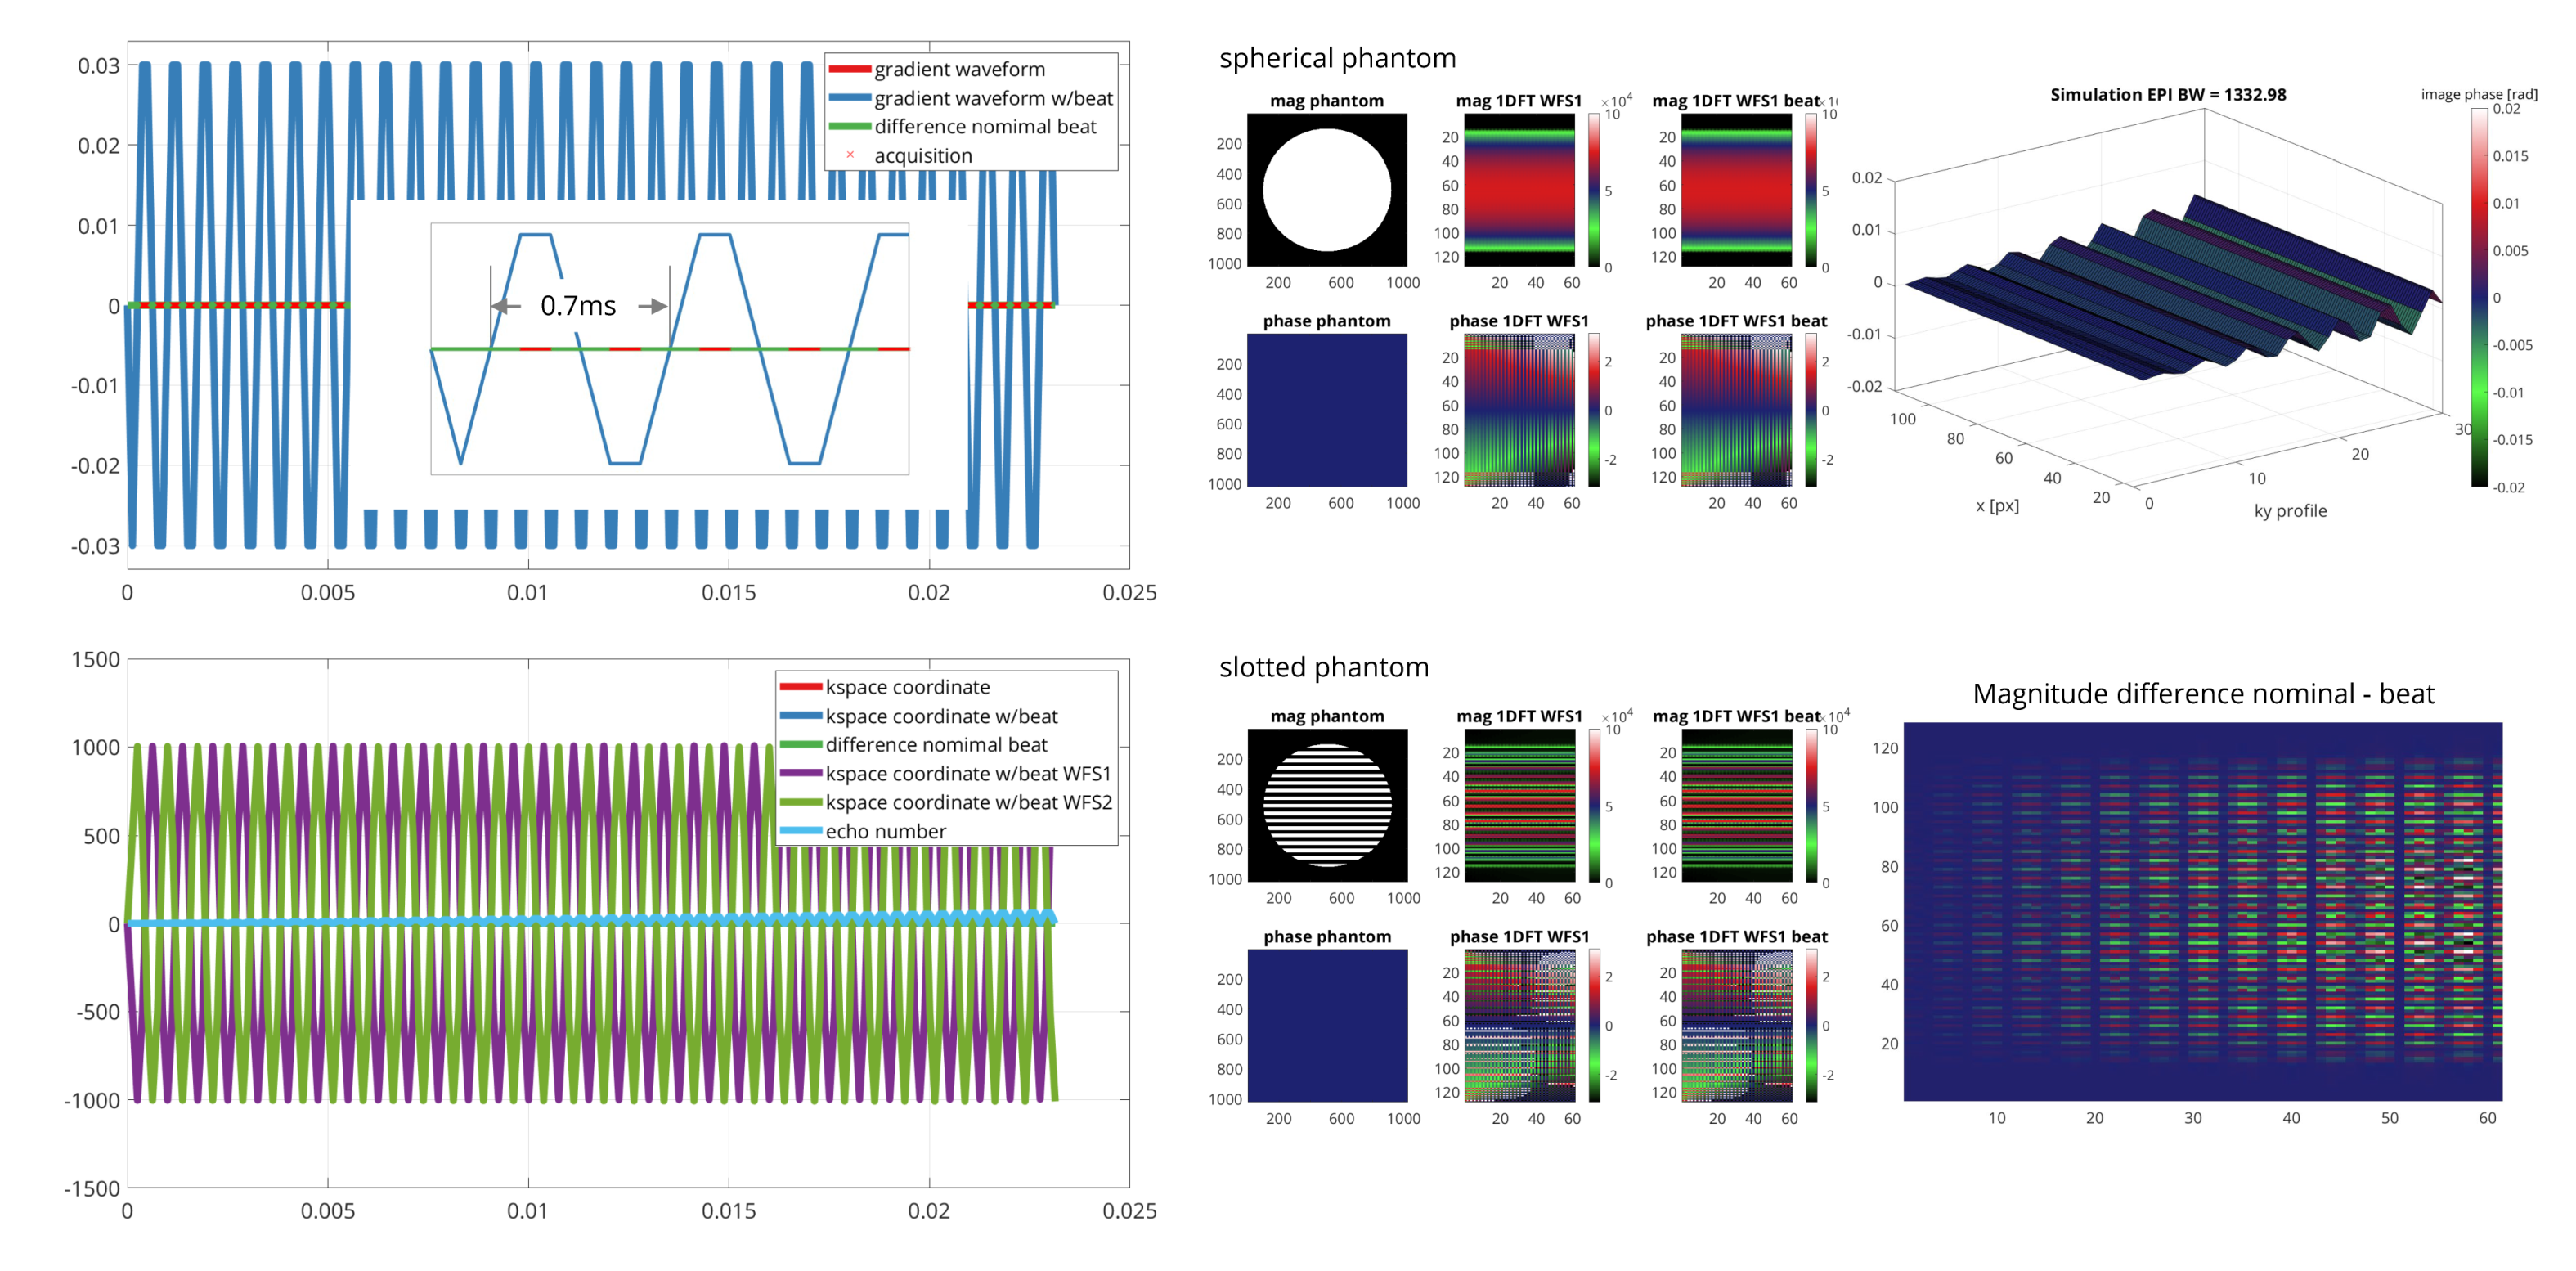
In previous works light has been shed on the mechanically resonant behavior of MRI gradient systems6 and its impact on PC-MRI gradient-echo sequence design7. Oscillating readouts, on the other hand, such as EPI or spiral trajectories, relate to forced excitation of (several) second-order systems (mechanical resonances). Following Lifschitz and Landau8, it is found that the deflection must follow a beat phenomenon whose amplitude is modulated over time with a period that equals the inverse of the difference frequency (Figure 1A), if the excitation frequency is near the natural frequency (= mechanical resonance frequency, Figure 1B).Given that the gradient modulation transfer function (GMTF) exhibits peaks at the mechanical eigenfrequencies in both 1st (symmetric around isocenter) and 0th order terms (shift of isocenter, Figure 1C), in theory, both terms can be monitored such that
$$$\Delta\varphi(t)\propto\Delta k_{1st}x+\Delta{B0}_{0th}t $$$,
where$$$\;\Delta\varphi(t)$$$ represents the erroneous phase,$$$\;\Delta{k}_{1st}\;$$$the erroneous kspace position due to 1st order GMTF terms,$$$\;x\;$$$the spatial position,$$$\;\Delta{B0}_{0th}\;$$$the erroneous B0 offset due to 0th order GMTF terms and$$$\;t\;$$$the acquisition time. It is known that 1st and 0th order terms result in k-space shifts7 and phase accrual over acquisition time, respectively.
Methods
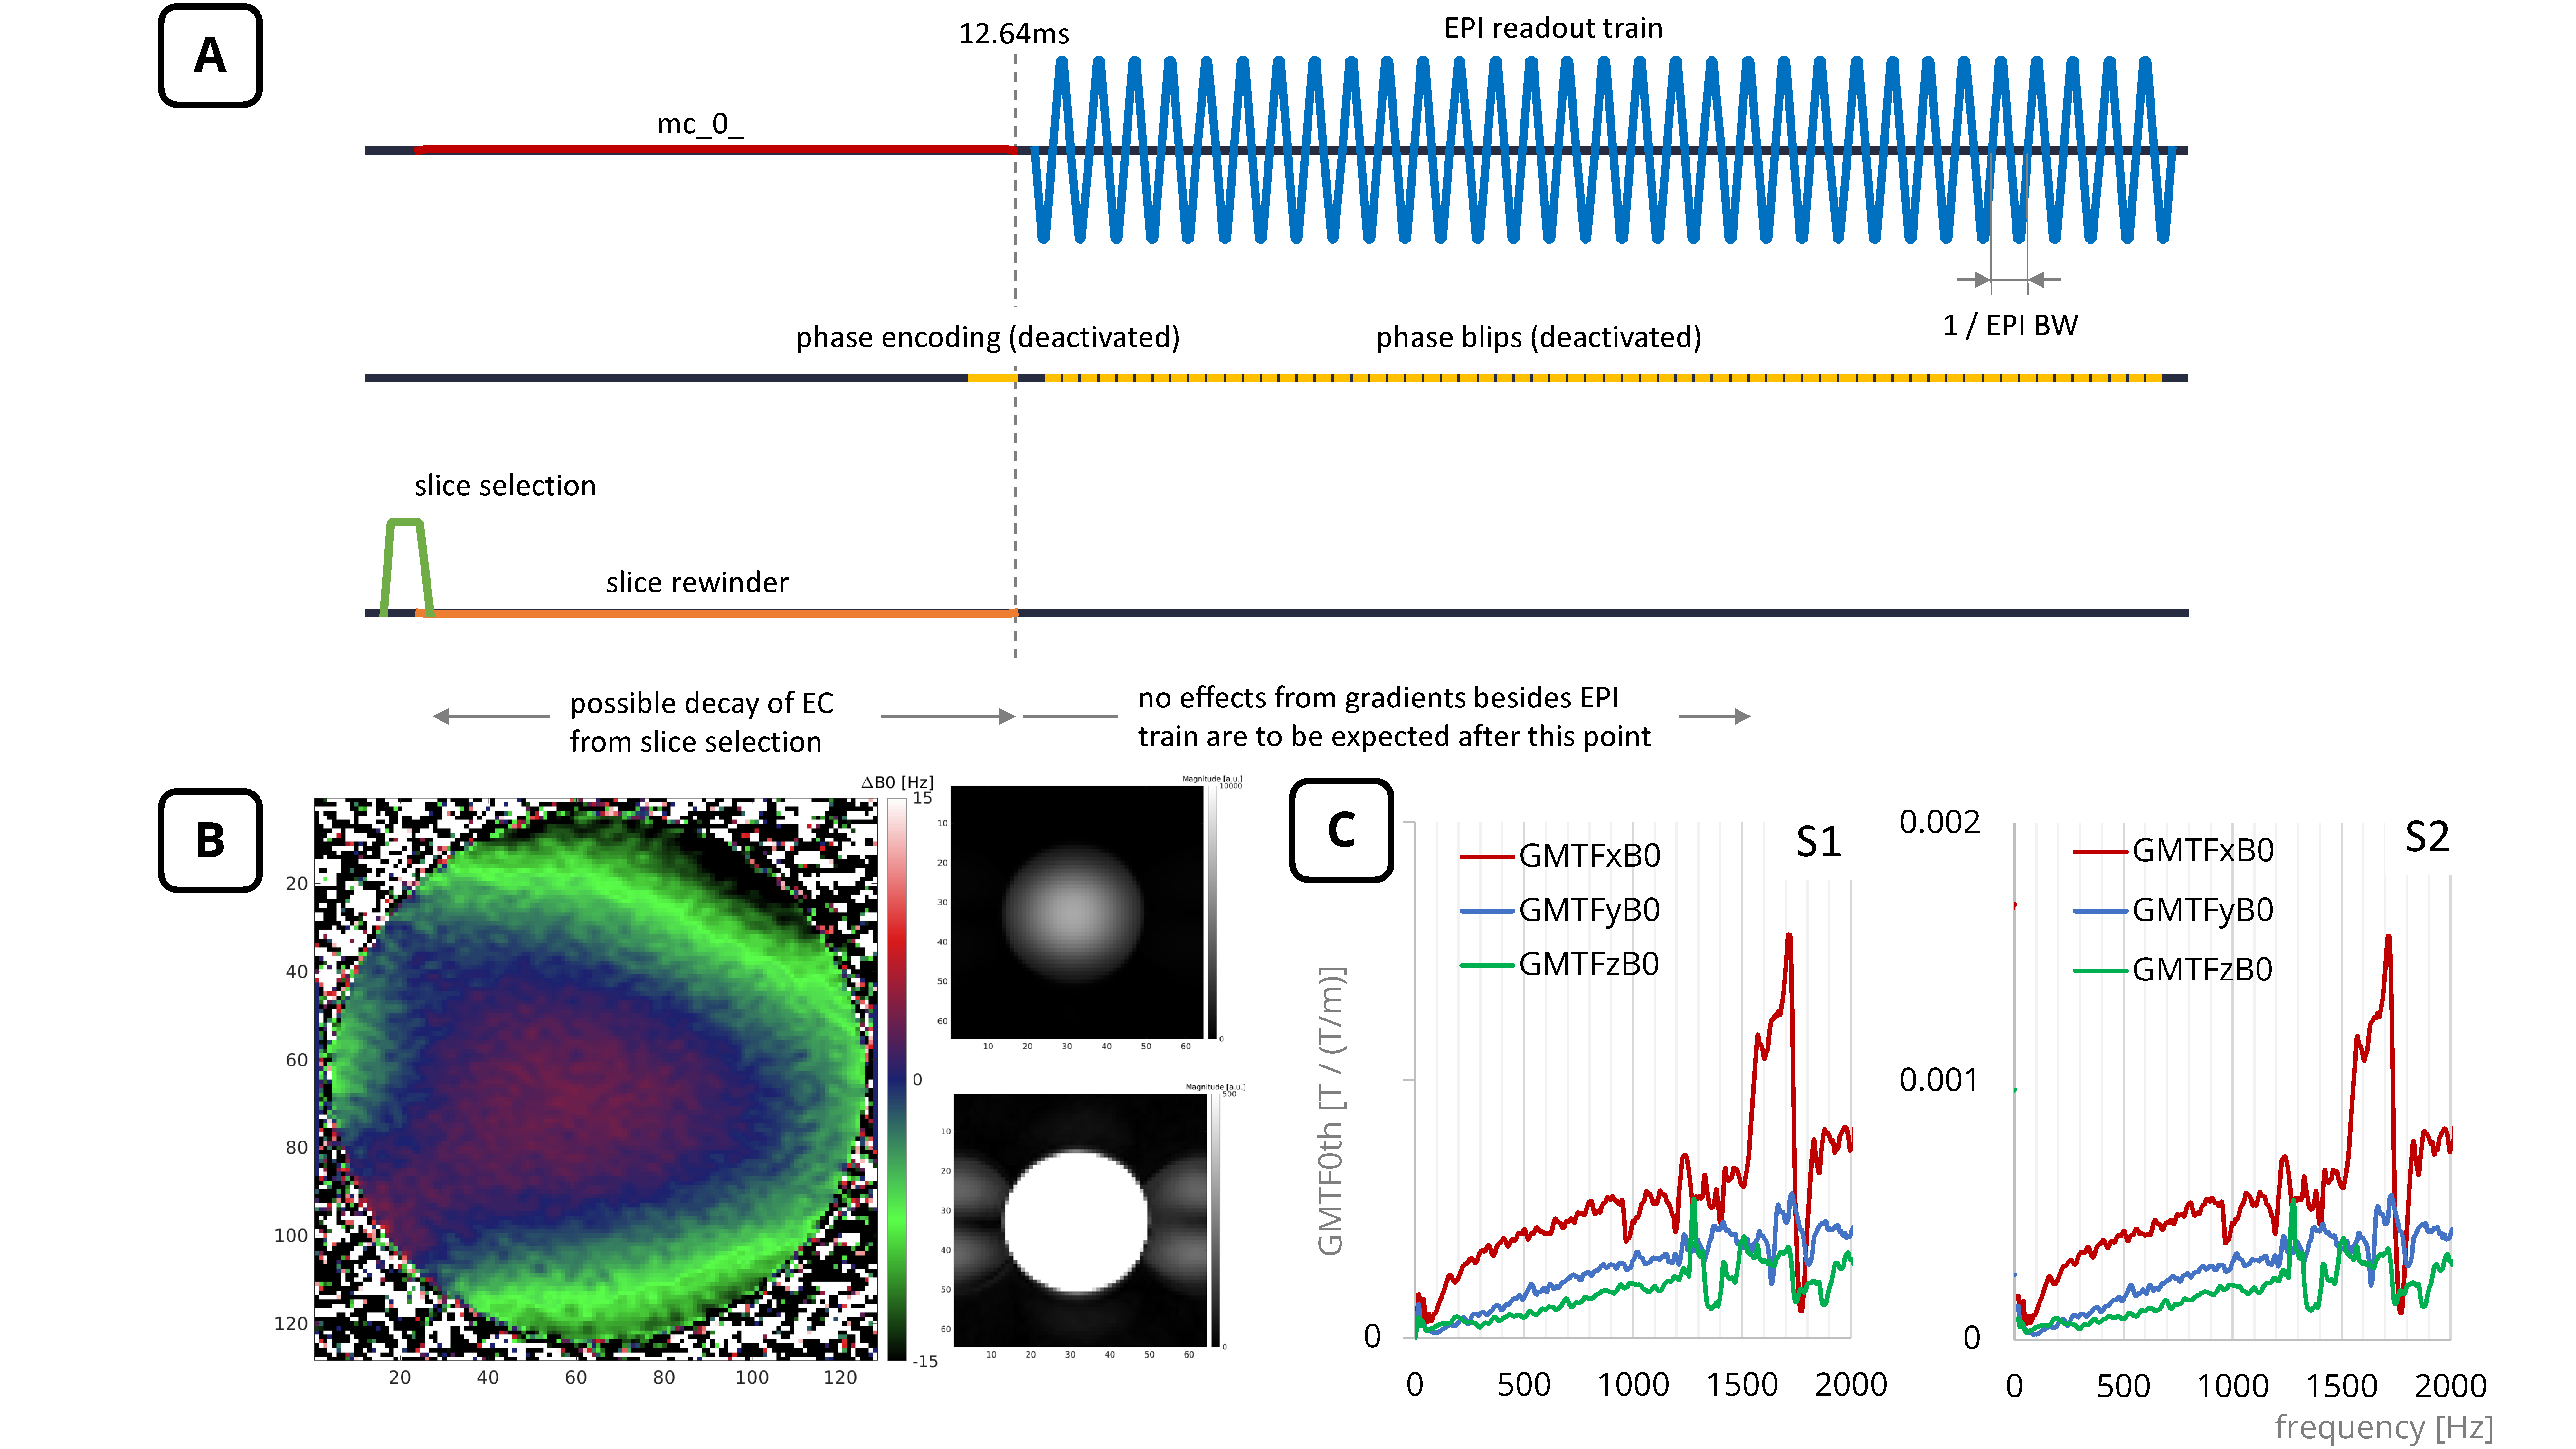
A vendor supplied EPI sequence (Figure 2A) was employed to acquire a non-oblique slice of a stationary spherical phantom on two 3T MRI systems (S1, S2) of the same model (Philips Healthcare, Best, the Netherlands) at {S1: isocenter offset by 5.5cm} {S2: at isocenter}. The readout bandwidth (EPI BW) was varied between 1121Hz and 1579Hz in 24 steps by adjusting the water-fat shift (WFS) in pixels, keeping echo time (TE) constant. The phase encoding blips were deactivated such that $$$k_y(t)=0 \forall t$$$. This allows monitoring the readout process of the y-projected image over time (ky profiles). The frequency encoded direction (gradient axis along which the EPI waveform will be played out) was set to either z (S1,S2) or y (S2).In order to distinguish between$$$\;\Delta{B0}\;$$$arising from spatial variations of the main magnetic field and$$$\;\Delta{B0}_{0th}\;$$$from the GMTF, for every EPI BW the gradient waveforms were played out with normal (WFS1) and inverted sign (WFS2). The resulting image phases were subtracted such that$$$\;\Delta{B0}\;$$$would cancel out (Figure 1C). Shimming was optimized to minimize dephasing due to long readout durations.
To isolate the effects due to$$$\;\Delta{B0}_{0th}\;$$$rather than$$$\;\Delta{k}_{1st}$$$, the phase of even and odd echoes were subtracted such that the phase portion$$$\;\Delta{k}_{1st}x$$$ would cancel out.
Data was reconstructed using MRecon (GyroTools LLC, Winterthur, Switzerland) without EPI phase correction and inverse Fourier transform in ky direction.
A GMTF of both systems was acquired9 (for S2: in the same scan session) to identify the mechanical resonances of the systems.
The acquisition process was simulated in MATLAB R2019a (MathWorks, Natick, MA), assuming a simplified EPI readout trajectory with a beat amplitude modulation. The code can be found at https://osf.io/g83s4/?view_only=0036f5b1c6dc4f4eaad54ce6ad4bbbfa.
Results & Discussion
Figure 2 presents (B) a B0 map and magnitude images and (C) the reconstructed GMTF of 0th order for systems S1 and S2.In Figure 3, phase difference planes for varying EPI BW for S1 and S2 are depicted (mean of the surface has been subtracted for better interpretability). As expected, a beat of varying frequency in the ky profile direction (= over time) can be seen. Also, the beat amplitude increases over time as predicted due to $$$B0_{0th}$$$ phase accumulation.
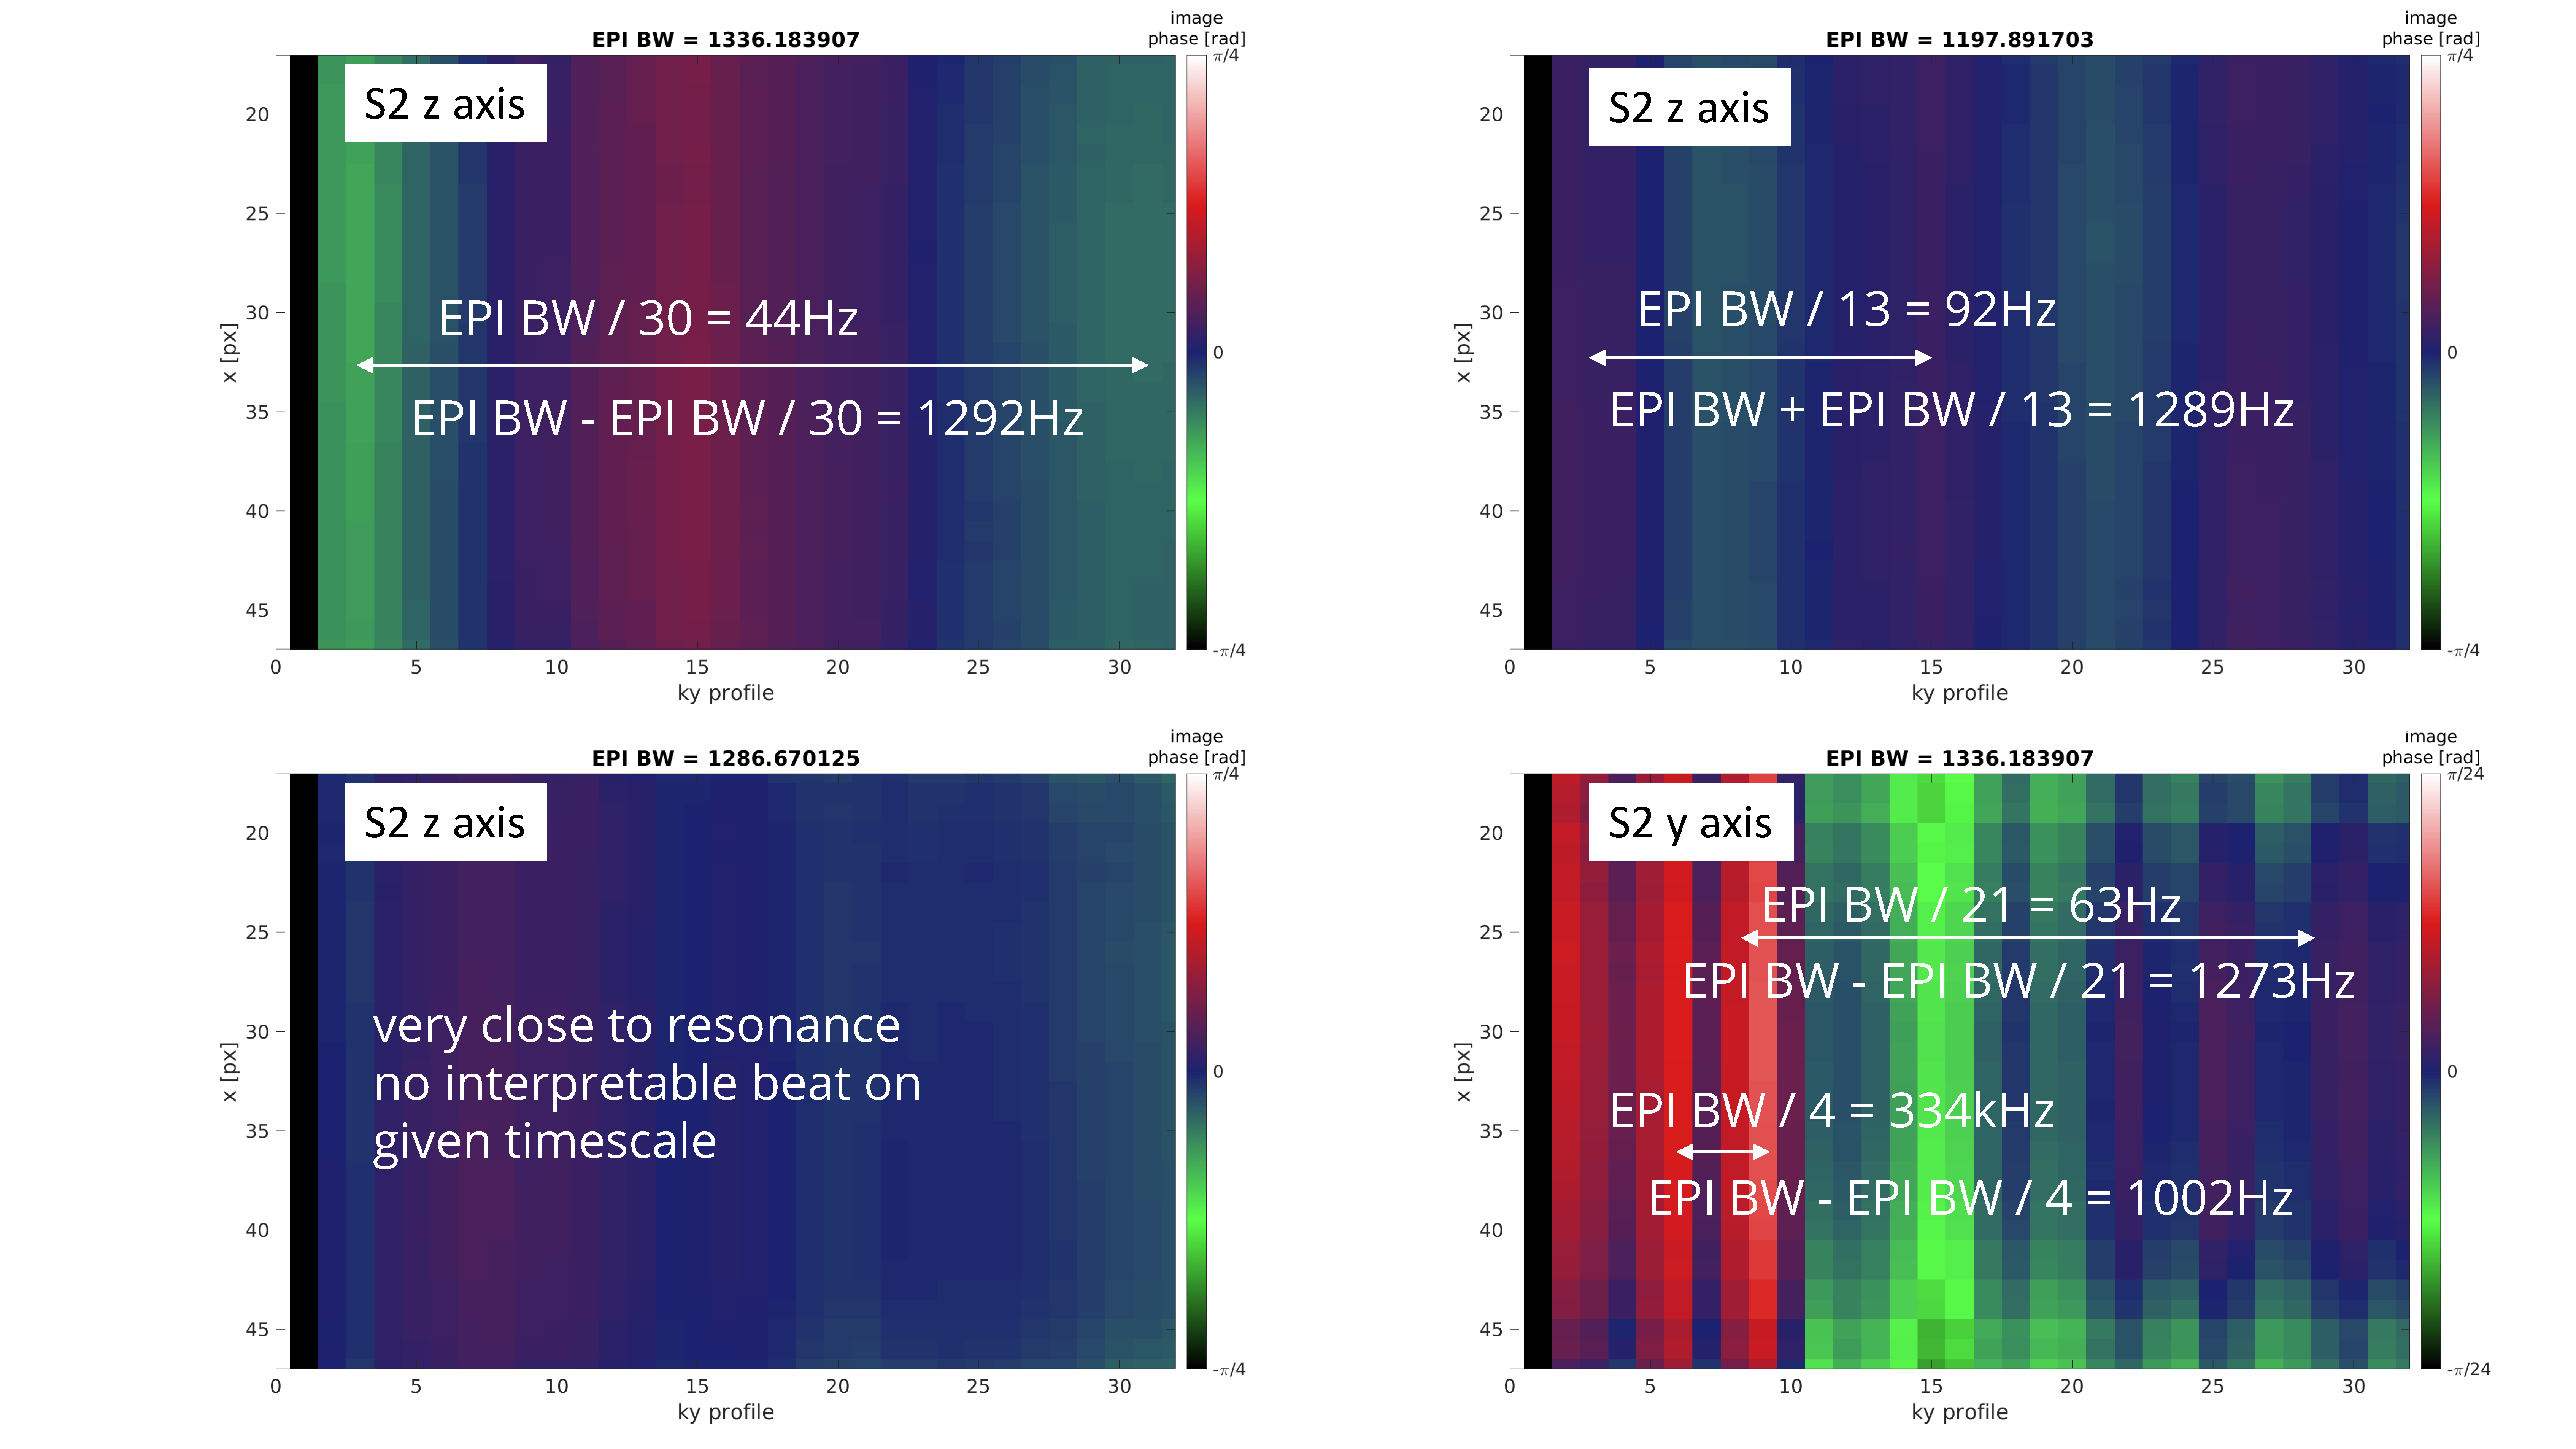
In Figure 4, the beat frequency in the data is related to the difference of the mechanical resonance and the excitation frequency for an axis with a single mechanical resonance (z axis) as described in the Theory section. The results hold for varying EPI BW. In addition, it is found also for axes with multiple resonances (y axis, Figure 5C) that multiple beat phenomena are superpositioned.
In Figure 5, the simulation output is shown where qualitatively the same beat as in the experiments can be observed. Differences in beat amplitude can be explained by the difference in the simulated versus the actual EPI trajectory and the amplitude factor given in Figure 1A. Comparing nominal and beat magnitude images for a slotted phantom, varying signal pile up is found which relates to blurring phase encoding direction if blips would be employed.
Conclusion
In this work, we identified GMTF 0th order terms arising from mechanical resonances as a source of erroneous, time-varying B0 phase when employing EPI readouts. The beat phenomenon, which was observed in other works5, is explained by forced excitation of mechanical resonances of the MRI gradient system. Sequence design and correction methods could benefit as pre-emphasis on current MRI systems is based on oscillating compensation terms with constant amplitude over time.Acknowledgements
The authors acknowledge funding of the Platform for Advanced Scientific Computing of the Council of Federal Institutes of Technology (ETH Board), Switzerland. The authors would like to thank Jennifer Nussbaum for providing a field-cam GMTF for comparison purposes.References
1. Mansfield P. Multi-planar image formation using NMR spin echoes. J Phys C Solid State Phys. 1977;10(3):55-58. doi:10.1088/0022-3719/10/3/004
2. Jezzard P, Balaban RS. Correction for geometric distortion in echo planar images from B0 field variations. Magn Reson Med. 1995;34(1):65-73. doi:10.1002/mrm.1910340111
3. DeLaPaz RL. Echo-planar imaging. Radiographics. 1994;14(5):1045-1058. doi:10.1148/radiographics.14.5.7991813
4. Vannesjo SJ, Graedel NN, Kasper L, et al. Image reconstruction using a gradient impulse response model for trajectory prediction. Magn Reson Med. 2016;76(1):45-58. doi:10.1002/mrm.25841
5. Kasper L, Bollmann S, Vannesjo SJ, et al. Monitoring, analysis, and correction of magnetic field fluctuations in echo planar imaging time series. Magn Reson Med. 2015;74(2):396-409. doi:10.1002/mrm.25407
6. Dillinger H, Kozerke S, Guenthner C. Direct Comparison of Gradient Modulation Transfer Functions and Acoustic Noise Spectra of the same MRI at High- (3T) and Lower-Field (0.75T). Proc. Intl. Soc. Mag. Reson. Med. 30 (2021)
7. Dillinger H, Peper E, Guenthner C, Kozerke S. Background Phase Error Reduction in Phase-Contrast MRI based on Acoustic Noise Recordings. Proc. Intl. Soc. Mag. Reson. Med. 30 (2021)
8. Lifschitz EM, Landau D. Lehrbuch Der Theoretischen Physik: Bd.1 Mechanik. Europa-Lehrmittel; 1967.
9. Rahmer J, Mazurkewitz P, Börnert P, Nielsen T. Rapid acquisition of the 3D MRI gradient impulse response function using a simple phantom measurement. Magn Reson Med. 2019;82(6):2146-2159. doi:10.1002/mrm.27902
Figures